Hydrological and ecological impacts of dams on the Kafue Flats floodplain system, southern Zambia
- 格式:pdf
- 大小:231.19 KB
- 文档页数:6
Classification of natural flow regimes in Australia to support environmental flow managementMARK J.KENNARD*,†,BRADLEY J.PUSEY*,†,JULIAN D.OLDEN ‡,STEPHEN J.MACKAY*,JANET L.STEIN §AND NICK MARSH –*Australian Rivers Institute,Griffith University,Nathan,Qld,Australia †Tropical Rivers and Coastal Knowledge (TRaCK)Commonwealth Environmental Research Facility,Australian Government,Canberra,ACT,Australia ‡School of Aquatic and Fishery Sciences,University of Washington,Seattle,WA,U.S.A.§The Fenner School of Environment and Society,Australian National University,Canberra,ACT,Australia –eWater Cooperative Research Centre and CSIRO Land and Water,Indooroopilly,Qld,AustraliaSUMMARY1.The importance of hydrologic variability for shaping the biophysical attributes and functioning of riverine ecosystems is well recognised by ecologists and water resource managers.In addition to the ecological dependences of flow for aquatic organisms,human societies modify natural flow regimes to provide dependable ecological services,including water supply,hydropower generation,flood control,recreation and navigation.Manage-ment of scarce water resources needs to be based on sound science that supports the development of environmental flow standards at the regional scale.2.Hydrological classification has long played an essential role in the ecological sciences for understanding geographic patterns of riverine flow variability and exploring its influence on biological communities,and more recently,has been identified as a critical process in environmental flow assessments.3.We present the first continental-scale classification of hydrologic regimes for Australia based on 120metrics describing ecologically relevant characteristics of the natural hydrologic regime derived from discharge data for 830stream gauges.Metrics werecalculated from continuous time series (15–30years of record constrained within a 36-year period)of mean daily discharge data,and classification was undertaken using a fuzzy partitional method –Bayesian mixture modelling.4.The analysis resulted in the most likely classification having 12classes of distinctive flow-regime types differing in the seasonal pattern of discharge,degree of flowpermanence (i.e.perennial versus varying degrees of intermittency),variations in flood magnitude and frequency and other aspects of flow predictability and variability.Geographic,climatic and some catchment topographic factors were generally strongdiscriminators of flow-regime classes.The geographical distribution of flow-regime classes showed varying degrees of spatial cohesion,with stream gauges from certain flow-regime classes often being non-contiguously distributed across the continent.These resultssupport the view that spatial variation in hydrology is determined by interactions among climate,geology,topography and vegetation at multiple spatial and temporal scales.Decision trees were also developed to provide the ability to determine the natural flow-regime class membership of new stream gauges based on their key environmental and ⁄or hydrological characteristics.Correspondence:Mark J.Kennard,Australian Rivers Institute,Griffith University,Nathan,Qld 4111,Australia.E-mail:m.kennard@griffi.au Freshwater Biology (2010)55,171–193doi:10.1111/j.1365-2427.2009.02307.xÓ2009Blackwell Publishing Ltd1715.The need to recognise hydrologic variation at multiple spatial scales is an important first step to setting regional-scale environmental flow management strategies.We expect that the classification produced here can underpin the development of a greater understanding of flow-ecology relationships in Australia,and management efforts aimed at prescribing environmental flows for riverine restoration and conservation.Keywords:Bayesian mixture modelling,catchment characteristics,climate,hydrologic metrics, prediction,uncertaintyIntroductionThe structure and function of riverine ecosystems,and the adaptations of their constituent freshwater and riparian species,are determined by patterns of intra-and inter-annual variation in riverflows(Poff et al., 1997;Lytle&Poff,2004;Naiman et al.,2008).Under-standing natural patterns of hydrology in time and space and the associated ecological consequences of altering these patterns offlow variability has therefore become fundamental to the assessment and manage-ment of environmental water allocations for river systems,and environmentally sustainable water man-agement planning(Bunn&Arthington,2002; Arthington&Pusey,2003;Richter et al.,2006).The identification offlow-regime types by means of hydrological classification underpins one of the most recent advances in environmentalflow assessment methodologies,called ELOHA(Ecological Limits of Hydrological Alteration,Poff et al.,2010). Hydrologic classification is the process of system-atically arranging streams,rivers or catchments into types that are most similar with respect to character-istics of theirflow regime.The classification of hydrological regimes has long played a critical role in the ecological sciences for understanding geo-graphic patterns of riverineflow variability(e.g. Haines,Finlayson&McMahon,1988;Poff&Ward, 1989;Harris et al.,2000),exploring the influence of streamflow on biological communities and ecological processes(e.g.Jowett&Duncan,1990;Poff&Allan, 1995),prioritising conservation efforts for freshwater ecosystems(e.g.Higgins et al.,2005;Snelder,Dey& Leathwick,2007)and guiding river management strategies(e.g.Snelder,Biggs&Woods,2005; Arthington et al.,2006).Environmental water alloca-tions,scenario testing and risk analysis of various management options,and planning for the impacts of global climate change,all need to be based on our understanding of,and capacity to predict,the ecological consequences of changes in hydrologic regime(Poff et al.,2003;Stewardson&Gippel,2003; Richter et al.,2006).The ability to do so is constrained unless we know how much and whenflow regimes vary among rivers and regions,and the extent to which such variation influences biological patterns and ecological processes in riverine ecosystems.A key foundation of the naturalflow paradigm (sensu Poff et al.,1997)is that the long-term physical characteristics offlow variability have strong ecolog-ical consequences at local to regional scales,and at time intervals ranging from days(ecological effects) to millennia(evolutionary effects)(Lytle&Poff, 2004).Critical components of theflow regime include the magnitude and seasonal pattern offlows; timing of extremeflows;the frequency,predictabil-ity,and duration offloods,droughts,and intermit-tentflows;daily,seasonal,and annualflow variability;and rates of change in discharge events (Richter et al.,1996;Poff et al.,1997;Bunn&Ar-thington,2002).Spatial variation in these hydrologic characteristics is determined by variations in climate and mediated by catchment geology,topography and vegetation(Winter,2001).These factors interact at multiple spatial and temporal scales to influence physical habitat for aquatic and riparian biota,the availability of refuges,the distribution of food resources,opportunities for movement and migra-tion,and conditions suitable for reproduction and recruitment(Naiman et al.,2008).Given the importance of hydrologic variability for shaping the biophysical attributes and functioning of riverine ecosystems,rivers that have similar hydro-logical characteristics should also have similar assem-blage composition,species traits and community functioning(Poff&Ward,1989).Extending this notion,Arthington et al.(2006)and Poff et al.(2010) suggested that ecological responses to a given anthropogenic change inflow regime should be similar in rivers of a similar initial naturalflow172M.J.Kennard et al.Ó2009Blackwell Publishing Ltd,Freshwater Biology,55,171–193regime.If true,this provides researchers and man-agers with a powerful foundation for predicting future responses toflow-regime changes whether it arises from localised basin-specific impacts or global climate change.Moreover,the outcomes offlow restoration exercises may be better planned and implemented.The ability to identify and classify spatial patterns in ecologically relevantflow-regime characteristics is therefore an importantfirst step in achieving these goals(Arthington et al.,2006;Poff et al.,2010).Hydrological classifications have previously been attempted in Australia at various scales,using a variety of methods,and usually describing only a subset of ecologically relevantflow-regime compo-nents.Finlayson&McMahon(1988)applied the Haines et al.(1988)global classification of streamflow seasonality at a continental scale.Other continental scale classifications of climate and catchment envi-ronmental attributes with a direct relevance to hydrology have also been undertaken(e.g.Hutchin-son et al.,2005;Stein et al.,2008).Hydrologic classifi-cations have been derived for particular regions(e.g. Hughes&James,1989;Leigh&Sheldon,2008; Moliere,Lowry&Humphrey,2009)and individual catchments(e.g.Thoms&Parsons,2003).A continen-tal scale multi-metric classification of ecologically relevant aspects of theflow regime has not yet been undertaken and few studies have examined the environmental mechanisms responsible for spatial variation inflow-regime characteristics(but see Nathan&McMahon,1990;Moliere et al.,2009).In this paper,we present thefirst continental-scale classification of hydrologic regimes for Australia.The classification is based on multiple hydrologic metrics describing the key ecologically relevantflow-regime characteristics using discharge data from a large set of stream gauges throughout the country.We attempt to gain insight into the mechanisms responsible for shaping broad-scale variation inflow regimes by using combinations of environmental variables describing catchment topography,surficial geology and substrate,vegetative cover and climate to explain and predictflow-regime class membership of stream gauges.We also develop a decision tree to enable new stream gauges(i.e.not used in the present analyses)to be assigned to aflow-regime class based on a subset of key discriminating hydrological characteristics.This facility is also important for predicting the type offlow regime existing prior to human impacts.By addressing these objectives,we aim to improve our understanding of spatial variation in naturalflow regimes throughout Australia and provide the ability to determine the naturalflow-regime class member-ship of new stream gauges based on their key environmental and⁄or hydrological characteristics. We expect that the hydrological classification pro-duced here can underpin the development of a greater understanding of the interaction between hydrology and ecology in Australian rivers,and support man-agement efforts aimed at prescribing environmental flows for riverine restoration and conservation. MethodsStudy area–climate and geographyThe Australian continent is notable for its generally low topography(average elevation=330m.a.s.l., maximum=2745m.a.s.l.),large inland arheic and endorheic river basins and low gradient coastal exorheic river basins(Bridgewater,1987).The climate is diverse(12of the30Koeppen-Geiger climate classes represented)but most of the continent is within two arid climate classes(Peel,Finlayson&McMahon, 2007).The climate is dominated by the dry sinking air of the subtropical high pressure belt that moves north and south with the seasons such that most rainfall in the north occurs during the austral summer(i.e. monsoonal wet)whilst most rainfall in the south occurs in the austral winter(i.e.temperate wet)and is associ-ated with complex low pressure weather systems originating in the Southern Ocean and South Pacific Ocean.Low rainfall(average=451mm year)1),high mean annual temperatures(21.5°C)and high rates of evaporation(typically in excess of rainfall)typically lead to low runoff(McMahon et al.,2007).Spatial variations in runoff separate the continent into two distinct areas,a humid coastline and an arid interior, with the greatest proportion of total runoff occurring in the northern and north-eastern coastal areas(88% from only26%of the land area),and the least recorded in arid and semi-arid regions(75%of the continent receives<12.5mm of annual runoff).Pro-nounced temporal variations in runoff are also characteristic of much but not all of Australia, particularly relative to other regions of the world (Puckridge et al.,1998).Classification of naturalflow regimes in Australia173Ó2009Blackwell Publishing Ltd,Freshwater Biology,55,171–193Quantifying characteristics of theflow regime Discharge data.Mean daily discharge data for an initial set of2686gauges with>10years of record were acquired from Australian state and territory water resources agencies.These gauges were screened and a subset fulfilling the following criteria were selected:(i)little or no hydrologic modification due to human activities;(ii)a period of hydrologic record ‡15years within the period1st January1965to31st December2000,preferably extending throughout a common year(i.e.1980);and(iii)continuous mean daily discharge data where possible.Our objective was to maximise the number and spatial coverage of gauges available for inclusion in subsequent analyses whilst ensuring that stream gauges were comparable in terms of data quality and quantity.Criterion1was assessed as follows.Stream gauges potentially subject to hydrologic modifications due to dams,weirs, interbasin transfers and water extraction were iden-tified using available information on the location of major dams and weirs(e.g.ANCOLD Inc.,2002), discussion with colleagues from water resource man-agement agencies and other institutions,as well as by examining GIS layers of the locations of major canals and pipelines(GeoSciences Australia.,2006).Potential human impacts onflow regimes were also evaluated using the River Disturbance Index(RDI;Stein,Stein& Nix,2002).This index comprises indirect measures of flow-regime disturbance due to impoundments,flow diversions and levee banks,and catchment distur-bance due to urbanisation,road infrastructure and land use activities.This information was summarised for the catchment upstream of each gauge and was used as a guide to identify and exclude gauges subject to intense human disturbances.Criterion2was based on the conclusions of Kennard et al.(2009)that estimation of hydrologic metrics based on at least 15years of discharge record was suitable for use in hydrologic classification analyses that aim to cha-racterise spatial variation in hydrologic regimes, provided that the discharge records were contained within a discrete temporal window(i.e.preferably >50%overlap between records).A total of830stream gauges met all of the screening criteria.While the hydrologic regimes of some of these stream gauges are likely affected by human activities to some extent,this represents our best efforts to identify the subset of least-disturbed stream gauges in Australia.The majority of selected stream gauges (76%,630of830gauges)had continuous dailyflow data with the remainder being most frequently(80%) characterised as missing less than30days(i.e.<0.6% of record).Missing periods of record were infilled using linear interpolation or regression(see Kennard et al.,2008).The period of record for all gauges was within the years1965–2000and85%included the year 1980(Fig.1a).The majority of gauges(>60%)had at least20years of record and only7%of gauges had 15years of data(Fig.1b),the minimum length of record for inclusion in the classification.Most stream gauges also overlapped substantially in their period of discharge record(e.g.c.90%of gauges overlapped by more than50%)(Fig.1b).The geographical location and length of discharge record for each of the830 gauges is shown in Fig.2.Gauge density was greatest (>0.4gauges per1000km2)for the eastern coastal region of Australia(i.e.drainage division I,II and III) and least(<0.02gauges per1000km2)for the two arid internally draining basins(X and XI).Few gauges that were unaffected by human activity were available in the Murray-Darling Basin(division IV),except in headwater tributaries.Tropical northern Australia(i.e. drainage divisions VIII and IX)was generally charac-terised by gauges with short record lengths(i.e.£20years)compared with elsewhere in Australia (Fig.2).Gauges were situated on streams and rivers with a wide range of upstream catchment areas (6–222674km2)but with most(72%)being100–10000km2in area.The set of830gauges covered most of the climatic(and hence potentialflow-regime)174M.J.Kennard et al.Ó2009Blackwell Publishing Ltd,Freshwater Biology,55,171–193types throughout Australia and were comparable with respect to the length and temporal period of discharge record(see Kennard et al.,2009). Hydrologic metrics.Numerous hydrologic metrics can be used to describe ecologically relevant components of the hydrologic regime in terms of the magnitude, frequency,duration and timing of discharge events, rate of change in discharge events and the temporal variability in these measures[reviewed by Olden& Poff(2003)].Olden&Poff(2003)examined patterns of correlation among171hydrologic metrics and quan-tified their ability to describe the key ecologically relevant components of hydrologic regimes in420 stream gauges across the continental U.S.A.They concluded that the66hydrologic metrics(including measures of central tendency and dispersion)calcu-lated by the Indicators of Hydrologic Alteration(IHA) software package(Mathews&Richter,2007)could adequately describe most of the majorflow-regime components but recommended several additional metrics to describe the magnitude and frequency of high-flow events.This reduced set of minimally redundant metrics formed the basis for the selection of hydrological metrics for the present study.To these,we added metrics that describe ecologically important aspects offlow regimes in Australia,par-ticularly those associated with the low-flow end of the hydrological spectrum.We also attempted to‘balance’the number of metrics for each major component of theflow regime to avoid one component being overrepresented in the hydrologic classification, although this was unavoidable in some instances (i.e.there are limited ways to describe rates of change inflow events compared with numerous approaches available to describeflow magnitude).Following Olden&Poff(2003),we grouped our final set of120individual hydrologic metrics(see Appendix S1for details on the method of calculation) intofive major categories describing different ecolog-ically relevant components of theflow regime.These included measures of central tendency(mean)and dispersion(variance)in the magnitude(n=54met-rics),frequency(n=14),duration(n=34),timing (n=12)and rate of change(n=6)inflow events, where magnitudes were subsequently divided into average(n=32),low(n=7)and high(n=15)cate-gories,frequency into low(n=6)and high(n=8) categories,and duration into low(n=18)and high (n=16)categories.The extent of multicollinearity among hydrologic metrics,as evaluated by examining cross-correlations between all120metrics,was gener-ally low(Kennard et al.,2008).The majority(i.e.>70%) of between-metric comparisons had absolute correlation coefficients<0.5and fewer than5%of between-metric comparisons had absolute correlation coefficients>0.80. These observations were consistent when examining for linear(Pearson’s correlation)and rank-order(Spear-man’s correlation)relationships among variables. Hydrologic metrics were calculated using the Time Series Analysis module of the River Analysis Package(RAP,Marsh,Stewardson&Kennard,2003). Hydrologic metrics describingflow magnitude were standardised to downweight their influence on subsequent classifications.Except for six metrics specifically describing runoff(i.e.discharge divided by upstream catchment area–see Appendix S1),all metrics describingflow magnitude(expressed in ML day)1)for each stream gauge were standardised by dividing by the mean dailyflow calculated for the entire record.Mean dailyflow was used as the denominator rather than median dailyflow(as has often been used in other studies)because many gauges had long-term median dailyflows ofzero.Classification of naturalflow regimes in Australia175Ó2009Blackwell Publishing Ltd,Freshwater Biology,55,171–193Geospatial and environmental dataGeospatial and environmental data hypothesised to be important discriminators offlow-regime types were used to interpret the hydrological classification. These included variables describing the geographic location of each stream gauge(latitude and longitude) and environmental characteristics of the reach and⁄or catchment upstream of each gauge.Environmental variables included catchment and valley topography [n=12variables describing elevation,catchment area and shape(elongation ratio),catchment storage,val-ley confinement catchment relief,distance to source and stream network density],surficial geology and substrate(n=11variables describing catchment aver-age values of soil saturated hydraulic conductivity and plant-available water-holding capacity,areal percentage of catchment overlying various bedrock lithology classes including siliciclastic and carbonate sedimentary rocks,metamorphic rock,igneous rock and unconsolidated rocks),present-day vegetative cover(n=2variables describing the areal proportion of the catchment covered by trees and grasses, respectively)and climate(n=35variables describing catchment average annual and monthly areal actual evapotranspiration,annual and monthly mean rain-fall,mean rainfall in the driest,wettest,coldest and warmest quarter,catchment average annual mean solar radiation,catchment mean temperature,mean temperature in the hottest and coldest month,and catchment average rainfall erosivity).A detailed description of environmental variables and their methods of derivation and source are described in Stein et al.(2008).Statistical analysesHydrological classification.Hydrological classification was undertaken using a fuzzy partitional method, Bayesian mixture modelling,implemented using the AutoClass C program(v 3.3.4–Hanson,Stutz& Cheeseman,1991;Cheeseman&Stutz,1996).In Bayesian mixture modelling,the observed distribu-tion of data is modelled as a mixture of afinite number of component distributions to determine the number of distributions,their parameters,and object memberships(Webb et al.,2007).The approach is fully probabilistic and uncertainty is explicitly reported in terms of data specification,class speci-fication and thefinal classification chosen.Multiple plausible classifications are produced,which are then ranked on their estimated marginal likelihoods to select the most parsimonious classification that is guaranteed to have the highest posterior probability;i.e.the probability of the model being correct given the data(Cheeseman&Stutz,1996;Webb et al.,2007). All120attributes(hydrologic metrics)were log10(x+1)transformed prior to analysis and mod-elled as normally distributed continuous variables. Outputs from the analysis include:the probability of class membership for each object(gauge);class strength(the probability that the attribute distribu-tions at the class level can be used to predict the class members,with strong classes tending to have tight distributions of attribute values);and the importance of the individual attributes for distinguishing each class.This is evaluated using the Kullback-Leibler distance,a measure of distance between data distri-butions,which accounts for the central tendency and variability of the data distribution.The summed Kullback-Leibler distances over all attributes pro-vided an estimate of overall divergence of each class from the overall distribution of cases.Bayesian classification using AutoClass requires the user to specify measurement uncertainty for each attribute and those attributes with lower uncertainty have more influence on thefinal classification(Webb et al.,2007).Uncertainty in the estimation of different hydrologic metrics is primarily a function of the length of discharge record used to calculate them and varies between different metrics for a given length of record(Kennard et al.,2009).We specified uncertainty for each hydrologic metric using estimates of mean accuracy(i.e.the scaled mean squared error,hereafter termed sMSE)based on the minimum discharge record length(15years)(Kennard et al.,2009).We viewed the use of the15-year sMSE as conservative but compared the classification based on the15-year sMSE(C1)with a classification using the30-year sMSE(C2).We also investigated the effects of includ-ing only the334stream gauges with‡25years of record(C3)and the effects of data order on clustering results.We re-ordered the data randomly10times, and re-ran the original classification(i.e.15year sMSE uncertainty for each metric).The most probable solutions for all10data orderings(C4–C13)were compared with the original classification(C1).Lastly, we undertook a‘hard’classification(C14)of the176M.J.Kennard et al.Ó2009Blackwell Publishing Ltd,Freshwater Biology,55,171–193stream gauges in which individual objects are assigned to a single class only.We used an agglom-erative hierarchical fusion technique(unweighted pairwise group arithmetic averaging)based on a Euclidean distance matrix(hydrologic metrics were range-standardised prior to analyses)and set the number of groups to equal the number produced by the most likely Bayesian solution of C1to provide a direct comparison of the two classification results. The different clustering results were compared using the adjusted Rand index(ARI;Hubert&Arabie 1985).The ARI has been shown to be the most desirable index for measuring cluster recovery(e.g. Steinley,2004).The index is based on the relation of every pair of objects(gauges),and whether these relations differ between two cluster solutions.The index ranges between0(indicating agreement between two clustering solutions is no better than chance)and1(indicating perfect agreement).After assigning objects to their most probable classes(from the Bayesian classifications),we calculated the ARI comparing C1with all other solutions(C2–C14)and tested significance values for each comparison using a randomisation approach following Steinley(2004) and the mclust(v.3)package for R(Fraley&Raftery, 2006).We also compared the relative influence of hydrologic metrics(based on Kullback-Leibler dis-tances)on each classification(C1–C13)using Pear-son’s correlation to evaluate whether the classes defined in each classification were hydrologically similar.The relative influence of hydrologic metrics on the hard classification(C14)was defined by the magnitude of Kruskal–Wallis test statistics used to evaluate the ability of each hydrologic metric to discriminate among C14classes.Graphical methods were also used to evaluate among-class variation (from C1)in a subset of key hydrologic metrics representing each of thefive ecologically relevant components of theflow regime and which are commonly used in ecohydrological studies,are easily interpretable,and hence potentially amenable to management action(Poff et al.,2010).Explanation and prediction offlow-regime classes using external environmental data.We explored the mecha-nisms responsible for shaping broad-scale variation in flow regimes by comparing the geospatial and envi-ronmental characteristics of stream gauges across flow-regime classes.Differences in multivariate envi-ronmental characteristics amongflow-regime classes were tested using an Analysis of Similarity(OSA N O S I M) based on the normalised Euclidian distance coefficient (PRIMER software,v.5.2.9;Clarke&Gorley,2001).A N O S I M compares rank similarities within a priori defined groups(i.e.classification groups)against rank similarities among groups and calculates a statistic,R, which is scaled to lie between)1and+1(Clarke& Gorley,2001).In the context of our study,a value of1 indicates that all gauges withinflow classes are more similar to one another than any gauges from different classes,a value of0indicates that there is no difference amongflow classes(i.e.representing the null hypothesis),and a value of)1indicates that all gauges within classes are less similar to one another than any gauges from different classes.Statistical significance was assessed using a permutation test where group membership is randomly permutated 999times and R calculated for each permutation. Separate A N OS I M s were conducted using different combinations of variables including:(i)geographic location;(ii)climate;(iii)catchment topography;(iv) geology,substrate and vegetative cover;and(v) combined environmental variables sets(ii)–(iv).We also developed classification tree models (CART,Breiman et al.,1984)to predict theflow-regime class membership of each stream gauge using each set of environmental data.This approach can identify those environmental variables important in discriminating among homogeneous groups of stream gauges,if indeed they do exist.Tree-based modelling provides aflexible nonparametric alternative to dis-criminant functions analysis for classification prob-lems in that it can model nonlinear,non-additive relationships among mixed variable types,it is invariant to monotonic transformations of the explan-atory variables and it facilitates the examination of collinear variables in thefinal model(De’ath& Fabricus,2000).The splitting criterion was based on the Gini impurity index,and we selected the smallest tree within1standard error of the tree with the least classification error as determined using10-fold cross-validation(Breiman et al.,1984).We conducted separate analyses using thefive different sets of environmental data described earlier for the A N O S I M analyses.Predictive performance of the classification trees was evaluated by calculating the percentage of stream gauges correctly allocated to their a priori definedflow-regime class and comparing these Classification of naturalflow regimes in Australia177Ó2009Blackwell Publishing Ltd,Freshwater Biology,55,171–193。

生态修复英语Ecological restorationEcological restoration refers to the process of restoring a degraded, damaged, or destroyed ecosystem to its original or near-original condition. It involves the repair and improvement of the ecological functions of an ecosystem for the benefit of both humans and nature. 。
Reforestation involves planting trees to restore a forest ecosystem that has been cleared or destroyed. This helps to stabilize the soil, reduce erosion, and provide habitats for many species. Habitat restoration focuses on recreating specific habitats, such as wetlands, grasslands, or coral reefs, to support the recovery of plant and animal populations. Wetland restoration involves restoring the natural hydrological and ecological processes of wetland ecosystems, which provide important services such as water filtration and flood control. Pollution remediation involves removing or treating pollutants from ecosystems to improve water or air quality.In addition to ecological benefits, ecological restoration can also have social and economic benefits. Restored ecosystems provide valuable resources and services, such as clean water, timber, and recreational opportunities, which contribute to human well-being and economic development. Restored ecosystems also support the recovery of endangered species and promotebiodiversity conservation, which is essential for the long-term sustainability of our planet.。

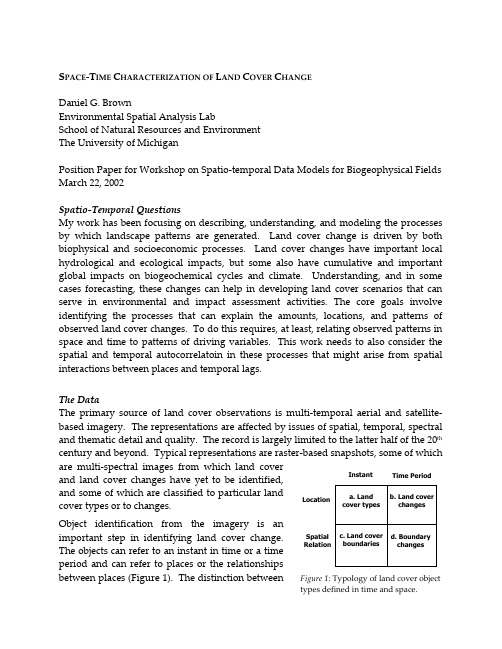
S PACE-T IME C HARACTERIZATION OF L AND C OVER C HANGEDaniel G. BrownEnvironmental Spatial Analysis LabSchool of Natural Resources and EnvironmentThe University of MichiganPosition Paper for Workshop on Spatio-temporal Data Models for Biogeophysical Fields March 22, 2002Spatio-Temporal QuestionsMy work has been focusing on describing, understanding, and modeling the processes by which landscape patterns are generated. Land cover change is driven by both biophysical and socioeconomic processes. Land cover changes have important local hydrological and ecological impacts, but some also have cumulative and important global impacts on biogeochemical cycles and climate. Understanding, and in some cases forecasting, these changes can help in developing land cover scenarios that can serve in environmental and impact assessment activities. The core goals involve identifying the processes that can explain the amounts, locations, and patterns of observed land cover changes. To do this requires, at least, relating observed patterns in space and time to patterns of driving variables. This work needs to also consider the spatial and temporal autocorrelatoin in these processes that might arise from spatial interactions between places and temporal lags.The DataThe primary source of land cover observations is multi-temporal aerial and satellite-based imagery. The representations are affected by issues of spatial, temporal, spectral and thematic detail and quality. The record is largely limited to the latter half of the 20th century and beyond. Typical representations are raster-based snapshots, some of whichare multi-spectral images from which land cover and land cover changes have yet to be identified, and some of which are classified to particular land cover types or to changes.InstantTime Period LocationObject identification from the imagery is animportant step in identifying land cover change. The objects can refer to an instant in time or a time period and can refer to places or the relationships between places (Figure 1). The distinction betweenSpatialRelationFigure 1: Typology of land cover object types defined in time and space.image-based change detection and post-classification change detection (e.g., Jensen, 1995) refers to when the temporal relationships are examined relative when the objects are identified. Both of these common approaches to land cover change focus on identifying objects of Type b (Figure 1), but differ in whether or not they first produce objects of Type a. The remote sensing literature does not address well the identification of boundary or gradient changes, which probably first requires identification of multi-temporal boundaries development of a movement model of some sort.Spatial-Temporal Data ModelsBy far the most common data model used in land cover change work is the snapshot, i.e., multiple spatial representations created for different points in time. A good rationale for this model is that the data are collected in essentially this way, i.e., complete spatial images taken at instances that are separated by time intervals. This suggests a case where good (often complete) spatial coverage exists for a fairly limited number of times (though this is getting better). This model is good for representing objects of Types a and c in Figure 1, but not for Types b and d. Once we have identified locations and types of change, we don't have a good working data model within which to structure those changes to include time (i.e., when they occurred and the intervals they represent). This is particularly problematic because the time intervals are often not constant, and this needs to be represented somehow.Interface to Spatial-Temporal Process ModelsIn order to relate observed changes to processes, which much of this work is ultimately aimed towards, we are inevitably faced with comparing or interfacing the representations of change (i.e., the data models) with the representations of process (i.e., process models). We are working with two broad types of land cover change process models. The first, which I will describe in more detail here, are what I'm calling top-down models. We are using geostatistical methods to characterize the space-time patterns inherent in observations of land cover change. These patterns can be related to space-time patterns in variables that represent various driving forces. The second type of model we are working on is bottom-up models, so-called because they develop a detailed agent-based description of how people make decisions about land cover change, and simulate the space-time patterns of land cover that emerge through the collective effects of those individual decisions. Ultimately, we seek strengthen our understanding of land cover change processes through the comparative contributions of both top-down and bottom-up models.To accomplish the top-down modeling we employ geostatistics, which provide a probabilistic framework for data analysis that builds on the joint spatial and temporal dependence between observations (Brown et al., In Review). The model of change thatwe employ is calibrated to land cover changes observed in a pair of images and involves (1) an initial map of land cover, (2) description of the change probabilities at locations, and (3) description of the spatial pattern of observed changes. The distribution of change probabilities is described using a statistical model that associates where changes occur with the characteristics of places on a number of suspected driving variables. The spatial patterns of change are described through indicator variograms describing each type of change and indicator cross-variograms describing the spatial interactions between changes. Reducing the observed changes to several parameters, which are part of the statistical model of change locations and the geostatistical description of change patterns, facilitates evaluations of spatial and temporal stationarity in the change process, comparisons based on hypothesized driving variables, and simulation of change for spatial-temporal interpolation or forecasting purposes. Because the framework facilitates simulation, it can also be used in the evaluation of how uncertainty propogates through the change processes observed, for example following approaches described by Goovaerts (1997) and Huevelink (1998).Final ThoughtsReasoning about space-time processes requires that we work with representations of both phenomena (entities and events) and processes (cause-effect linkages, feedbacks, etc.). One of the more fundamental questions we face is how we reconcile our observations of empirical reality, which rarely offer the reasoning power of controlled experiments, with our models of process, which are necessarily simplified representations of complex processes. We need to decide what are the characteristics of the observations that we think need to be well reproduced by our models. For this purpose, data mining to create reduced descriptions of space-time patterns is critical. Further, summarization of model output and the search of space-time data that match these summaries will facilitate the process of model validation. For these reasons, I see the development of intuitive and robust interfaces between models of data and models of process as an important research agenda item in the context of this workshop. ReferencesGoovaerts, P. 1997. Geostatistics for Natural Resources Evaluation. New York: Oxford.Heuvelink, G.B.M. 1998. Error Propagation in Environmental Modeling with GIS. New York: Taylor and Francis.Jensen, J.R. 1995. Introductory Digital Image Processing: A Remote Sensing Perspective. Upper Saddle River, NJ: Prentice Hall.Brown, D.G., Goovaerts, P., Burnicki, A.C., and Li, M.-Y. n.d. Stochastic simulation of land-cover change using geostatistics and generalized additive models. In Review.。

城市水务(081521)(Urban Water Affairs)学科门类:工学(08)一级学科:水利工程(0815)城市水务隶属于水利工程一级学科,河海大学是全国第一个设置城市水务学科硕士和博士点的大学,从2004年开始招生。
目前有博士生导师3人。
本学科依托河海大学在水利、土木、环境等学科的综合优势,主要涉及城市化地区水文规律分析、水环境及生态保护、水务工程规划、城市水灾害防治、城市水务管理等基本理论研究和技术开发,为城市水利、水务、市政、环境部门以及流域机构培养高层次学术人才。
河海大学已有水文水资源与水利工程科学国家重点实验室,水资源高效利用与工程安全国家工程研究中心,建设有上海市等水务科研实践基地,为培养城市水务博士研究生提供了有力的支撑。
我校开展城市水务研究已有近三十年的历史,承担了数百项有关城市水务方面的国家攻关项目、国家自然科学基金和部、省级重点科研项目,取得了多项有重要学术价值的科研成果。
一、培养要求培养面向现代化,品行端正,身心健康,具有强烈的事业心和良好的学术道德,在城市水务科学方面掌握坚实宽广的基础理论和系统深入的专门知识,具备独立从事科学研究和专门技术工作的能力并做出创新性成果,适应我国社会主义建设需要的德智体美全面发展的高层次学术型人才。
二、主要研究方向1.城市水循环机理(Urban Water Cycle Mechanism)2.城市水务规划与管理(Urban water Engineering Planning and Management) 3.城市水环境(Urban Water Environment)三、学分要求课程总学分为18学分,其中学位课程12学分,非学位课程6学分,教学环节3学分。
四、课程设置城市水务学科博士研究生课程设置城市水务(081521)(Urban Water Affairs)学科门类:工学(08)一级学科:水利工程(0815)城市水务隶属于水利工程一级学科,河海大学是全国第一个设置城市水务学科硕士和博士点的大学,从2004年开始招生。

描述大自然的英语单词Describing Nature in English.Nature, the vast and diverse realm of life and non-life processes, is a source of inspiration and wonder for countless individuals. The English language, with its rich vocabulary and expressive capabilities, provides ample means to describe the natural world. In this article, we delve into a selection of English words that encapsulate the essence of nature, its diverse elements, and the profound impact it has on our lives.1. Wilderness.The wilderness refers to an area of land that islargely uninhabited and undisturbed by human activity. Itis characterized by its primitive state, rich biodiversity, and often, by its remoteness. Wilderness areas are revered for their ecological significance and are often protected by law to conserve their natural state.2. Forest.A forest is an extensive area covered primarily with trees. Forests play a crucial role in the global carbon cycle, providing habitats for a wide range of wildlife, and serving as sources of timber, fuel, and other resources. They also contribute to the overall health and well-being of the planet.3. Mountain.Mountains are natural landforms that rise above the surrounding terrain, often in the form of steep slopes and peaks. Mountains are geologically diverse, ranging from volcanoes and fold mountains to fault-block mountains. They are significant for their ecological, hydrological, and cultural values.4. River.A river is a natural watercourse that flows in acontinuous stream, usually from a source such as a glacier or lake, to an outlet such as an ocean or another lake. Rivers are essential for water supply, irrigation, transportation, and many other human activities. They also play a crucial role in the global water cycle and the ecology of the regions they traverse.5. Ocean.The ocean covers over 70% of the Earth's surface and is the largest continuous body of water on the planet. Oceans are home to a diverse array of marine life, including coral reefs, fish species, and whales. They also play a vitalrole in climate regulation, nutrient cycling, and the overall health of the global ecosystem.6. Wildlife.Wildlife refers to the plants and animals that live in their natural habitats, outside of human settlements. Wildlife is a crucial component of the natural world, contributing to ecological balance and biodiversity. Italso provides a source of inspiration and awe for many people, who appreciate the beauty and uniqueness of wild animals and plants.7. Weather.Weather refers to the atmospheric conditions that prevail at a given place and time. It includes factors such as temperature, humidity, wind speed and direction, precipitation, and cloudiness. Weather patterns and events such as storms, hurricanes, and droughts have a significant impact on the natural world and human society.8. Climate.Climate refers to the average weather conditions experienced over a long period of time in a particular region. It is influenced by various factors including latitude, altitude, ocean currents, and the presence of mountains or other landforms. Climate has a profound impact on the distribution and abundance of plant and animal species, as well as on human settlement patterns andactivities.9. Landscape.Landscape refers to the visible features of the land, including its natural and anthropogenic elements. It includes features such as mountains, valleys, rivers, forests, cities, and farmland. Landscapes are highly variable and diverse, reflecting the unique geography, history, and culture of the regions they inhabit.10. Biodiversity.Biodiversity refers to the variety of life forms found in a particular ecosystem or region. It includes genetic diversity within species, diversity among species, and diversity of ecosystems. Biodiversity is essential for the health and resilience of natural systems, providingcritical ecological services such as pollination, nutrient cycling, and carbon sequestration.In conclusion, the English language offers a rich anddiverse vocabulary to describe the wonders of nature. These words reflect the breadth and depth of the natural world, its complexity and interconnectedness, and its profound impact on our lives. As we delve into the world of nature, we discover new meanings and insights through the language of English, a powerful tool for understanding and appreciating the natural world.。
水文水利类相关SCI、EI期刊汇总国内:水利学报、水科学进展、水力发电学报、水动力学研究与进展(A辑中文版EI收录,B辑英文版SCI收录)International Journal of Sediment Research(《International Journal of Sedi ment Research》(译名《国际泥沙研究》)是国际泥沙研究培训中心主办的纯英文版科技期刊,为季刊。
自2007起成为SCI源刊,被SCI-E收录。
)国外主要期刊有:主要期刊有:Journal of Hydraulic Engineering, ASCEJournal of Hydraulic Research, IAHRJournal of Engineering Mechanics, ASCEJournal of Fluid Mechanics, CambridgeWater Resources Research, AGUWater Management, ICE UKAdvances in Water Resources, ElsevierEarth Surface Processes and Landforms, WileyRiver Research and Applications, Wiley (formerly Regulated Rivers: Research & Management)相关机构有:IAHR: International Association of Hydraulic Engineering and ResearchIAHS: International Association of Hydrological ScienceIWA: International Water AssociationIWRA: International Water Resources AssociationAWRA: American Water Resources AssociationICOLD: International Commission on Large DamsASCE: American Society of Civil EngineersAGU: American Geophysical UnionUSGS: United States Geological SurveyICE: Institution of Civil Engineers, UKWASER: World Association of Sedimentation and Erosion ResearchCHES: Chinese Hydraulic Engineering Society相关期刊详细介绍:1 Journal of HydrologyISSN: 0022-1694IF=2.305网址:/wps/find ... ription#descriptionThe Journal of Hydrology publishes original research papers and comprehensive reviews in all the subfields of the hydrological sciences including water based management and policy issues that impact on economics and society. These comprise, but are not limited to the physical, chemical, biogeochemical, stochastic and systems aspects of surface and groundwater hydrology, hydrometeorology and hydrogeology. Relevant topics incorporating the insights and methodologies of disciplines such as climatology, water resource systems, hydraulics, agrohydrology, geomorphology, soil science, instrumentation and remote sensing, civil and environmental engineering are included. Social science perspectives on hydrological problems such as resource and ecological economics, environmental sociology, psychology and behavioural science, management and policy analysis are also invited. Multi-and interdisciplinary analyses of hydrological problems are within scope.期刊简介:期刊发表有关水文科学领域的原创研究论文和全面性的综述,包括水管理和水政策对社会经济的影响,涉及内容包括地表和地下水水文、水文气象和水文地质的物理、化学、生物学、随机性和系统方面,但不仅限于此,相关主题包含各学科(气候学、水资源系统、水力学、农业水文学、地形地貌学、土壤科学、仪器仪表、遥感、土木和环境工程)的方法论和前瞻性研究。
水文水利类相关SCI、EI期刊汇总国内:水利学报、水科学进展、水力发电学报、水动力学研究与进展(A辑中文版EI收录,B辑英文版SCI收录)International Journal of Sediment Research(《International Journal of Sedi ment Research》(译名《国际泥沙研究》)是国际泥沙研究培训中心主办的纯英文版科技期刊,为季刊。
自2007起成为SCI源刊,被SCI-E收录。
)国外主要期刊有:主要期刊有:Journal of Hydraulic Engineering, ASCEJournal of Hydraulic Research, IAHRJournal of Engineering Mechanics, ASCEJournal of Fluid Mechanics, CambridgeWater Resources Research, AGUWater Management, ICE UKAdvances in Water Resources, ElsevierEarth Surface Processes and Landforms, WileyRiver Research and Applications, Wiley (formerly Regulated Rivers: Research & Management)相关机构有:IAHR: International Association of Hydraulic Engineering and ResearchIAHS: International Association of Hydrological ScienceIWA: International Water AssociationIWRA: International Water Resources AssociationAWRA: American Water Resources AssociationICOLD: International Commission on Large DamsASCE: American Society of Civil EngineersAGU: American Geophysical UnionUSGS: United States Geological SurveyICE: Institution of Civil Engineers, UKWASER: World Association of Sedimentation and Erosion ResearchCHES: Chinese Hydraulic Engineering Society相关期刊详细介绍:1 Journal of HydrologyISSN: 0022-1694IF=网址: ... ription#descriptionThe Journal of Hydrology publishes original research papers and comprehensive reviews in all the subfields of the hydrological sciences including water based management and policy issues that impact on economics and society. These comprise, but are not limited to the physical, chemical, biogeochemical, stochastic and systems aspects of surface and groundwater hydrology, hydrometeorology and hydrogeology. Relevant topics incorporating the insights and methodologies of disciplines such as climatology, water resource systems, hydraulics, agrohydrology, geomorphology, soil science, instrumentation and remote sensing, civil and environmental engineering are included. Social science perspectives on hydrological problems such as resource and ecological economics, environmental sociology, psychology and behavioural science, management and policy analysis are also invited. Multi-and interdisciplinary analyses of hydrological problems are within scope.期刊简介:期刊发表有关水文科学领域的原创研究论文和全面性的综述,包括水管理和水政策对社会经济的影响,涉及内容包括地表和地下水水文、水文气象和水文地质的物理、化学、生物学、随机性和系统方面,但不仅限于此,相关主题包含各学科(气候学、水资源系统、水力学、农业水文学、地形地貌学、土壤科学、仪器仪表、遥感、土木和环境工程)的方法论和前瞻性研究。
农田排水沟渠的生态环境效应研究综述摘要农田排水沟渠是农业生态系统中的重要组成部分,随着研究的深入,农田排水沟渠的生态环境效应逐渐得到大家的关注。
该文从水文效应、生物效应和去污效应等方面归纳了目前国内外农田排水沟渠的研究进展,重点阐述了农田排水沟渠与农田地下水位、生物多样性和去除氮磷等营养物质的机制,同时简要介绍了沟渠模型和管理方面的研究,结合目前研究状况,提出今后尚需进一步研究的问题,以期为农田排水沟渠生态环境效应的研究提供参考。
关键词农田排水沟渠;水文效应;生态环境Abstract Agricultural land drainage ditches is an important part of the agro-ecosystems,with the further research,ecological and environmental effects of agricultural land drainage ditches are gradually focused. This paper reviewed the research advances in the effect of agricultural land drainage ditches on hydrological and eco-environment at home and abroad,and explained explicitly the mechanism of between agricultural drainage ditches and agricultural groundwater level and biodiversity,and the removal of nutrients such as nitrogen and phosphorus;Additionally,it introduced the advance in ditch modeling and ditch management study,further researches needed in the future were put forward in the light of current research conditions,in order to provide the reference for the study of the ecological and environmental effects of agricultural land drainage ditches.Key words agricultural land drainage ditches;hydrological effects;eco-environment农田排水沟渠一般指位于农田间或地头以排水或灌溉为目的,为满足人类生产、生活安全保障等需要而人工挖取的水道。
水文水利类相关SCI、EI期刊汇总(2012-03-21 17:02:26)国内:水利学报、水科学进展、水力发电学报、水动力学研究与进展(A辑中文版EI收录,B辑英文版SCI收录)International Journal of Sediment Research(《International Journal of Sedi ment Re search》(译名《国际泥沙研究》)是国际泥沙研究培训中心主办的纯英文版科技期刊,为季刊。
自2007起成为SCI源刊,被SCI-E收录。
)国外主要期刊有:主要期刊有:Journal of Hydraulic Engineering, ASCEJournal of Hydraulic Research, IAHRJournal of Engineering Mechanics, ASCEJournal of Fluid Mechanics, CambridgeWater Resources Research, AGUWater Management, ICE UKAdvances in Water Resources, ElsevierEarth Surface Processes and Landforms, WileyRiver Research and Applications, Wiley (formerly Regulated Rivers: Research & Mana gement)相关机构有:IAHR: International Association of Hydraulic Engineering and ResearchIAHS: International Association of Hydrological ScienceIWA: International Water AssociationIWRA: International Water Resources AssociationAWRA: American Water Resources AssociationICOLD: International Commission on Large DamsASCE: American Society of Civil EngineersAGU: American Geophysical UnionUSGS: United States Geological SurveyICE: Institution of Civil Engineers, UKWASER: World Association of Sedimentation and Erosion ResearchCHES: Chinese Hydraulic Engineering Society相关期刊详细介绍:1 Journal of HydrologyISSN: 0022-1694IF=2.305网址:/wps/find ... ription#descriptionThe Journal of Hydrology publishes original research papers and comprehensive revi ews in all the subfields of the hydrological sciences including water based managem ent and policy issues that impact on economics and society. These comprise, but ar e not limited to the physical, chemical, biogeochemical, stochastic and systems aspe cts of surface and groundwater hydrology, hydrometeorology and hydrogeology. Rele vant topics incorporating the insights and methodologies of disciplines such as climat ology, water resource systems, hydraulics, agrohydrology, geomorphology, soil scienc e, instrumentation and remote sensing, civil and environmental engineering are inclu ded. Social science perspectives on hydrological problems such as resource and ecol ogical economics, environmental sociology, psychology and behavioural science, man agement and policy analysis are also invited. Multi-and interdisciplinary analyses of h ydrological problems are within scope.期刊简介:期刊发表有关水文科学领域的原创研究论文和全面性的综述,包括水管理和水政策对社会经济的影响,涉及内容包括地表和地下水水文、水文气象和水文地质的物理、化学、生物学、随机性和系统方面,但不仅限于此,相关主题包含各学科(气候学、水资源系统、水力学、农业水文学、地形地貌学、土壤科学、仪器仪表、遥感、土木和环境工程)的方法论和前瞻性研究。
Hydrological and ecological impacts of dams on the KafueFlats floodplain system,southern ZambiaM.Mumba *,J.R.ThompsonWetland Research Unit,Department of Geography,University College London,London WC1H 0AP,United KingdomAvailable online 21July 2005AbstractDevelopmental changes in river basins in Africa have become a reality.Many wetland ecosystems have been impacted by dams and other hydrological interventions resulting in both foreseen and unexpected consequences.The Kafue Flats in southern Zambia is an extensive floodplain system that lies within the middle Kafue river basin.The floodplain is about 255km long and 60km wide,covering an area of approximately 6,500km 2.It is currently sandwiched between two large dams which are approximately 270km apart.These dams have completely altered the hydrological regime of the system.Backwater from the downstream dam and releases from upstream have created a permanently flooded area within the floodplain that was not present in the past.Elsewhere,flooding has been reduced.The ecological consequences of these changes for the floodplain,which hosts two national parks (both Ramsar sites),have been extensive.Hydrological and vegetation changes have impacted the habitat for important wildlife communities including the endemic antelope,Kobus leche kafuensis .The most dramatic change in vegetation is associated with the colonisation of parts of the floodplain by the invasive alien plant,Mimosa pigra .This paper discusses these changes and their potential consequences.Ó2005Elsevier Ltd.All rights reserved.Keywords:Dams;Kafue Flats;Mimosa pigra ;Wetlands;Zambia1.The Kafue River basin and the Kafue Flats floodplain systemThe Kafue river,draining from central Zambia,is some 1,577km in length down to its confluence with the Zambezi (Fig.1).At this point the catchment area is approximately 154,000km 2,nearly one fifth of the to-tal area of the country (Williams,1977).The Kafue River Basin is the most studied and developed of Zambia Õs riv-er basins (e.g.Minderhound,1980;Howard and Wil-liams,1982;JICA,1992).It plays a central role in the economy of the country.Most of the mining,industrial and agricultural activities take place within the basinwhilst around 50%of the Zambian population live with-in it (Burke et al.,1994).The Kafue flats are situated towards the downstream end of the Kafue Basin in southern Zambia (26°–28°E and 15°200–15°550S,Fig.1).The flats are an extensive floodplain extending over 255km along the course of the river.Their maximum width is 60km and they cover more than 6,500km 2(Chabwela and Mumba,1998).The average annual rainfall over the flats is in the order of 800mm and it is concentrated in the wet season (October–April).This rainfall contributes to the initial flooding of the flats at the start of the rainy season.However,it is the large river flows originating from wet-ter areas upstream (annual rainfall approximately 1,400mm)that were historically responsible for inun-dating large areas within the flats.The flats are one of the most biologically diverse eco-systems in Zambia and comprise complex patterns of1474-7065/$-see front matter Ó2005Elsevier Ltd.All rights reserved.doi:10.1016/j.pce.2005.06.009*Corresponding author.Fax:+442076794293.E-mail addresses:m.mumba@ (M.Mumba),j.thompson@ (J.R.Thompson)./locate/pcePhysics and Chemistry of the Earth 30(2005)442–447lagoon,marshes and floodplain grassland that provide habitat for a wide range of wildlife and water fowl (Acr-eman et al.,2000).The floodplain is most notable for the lechwe,Kobus leche kafuensis ,a species of endemic ante-lope.Parts of the flats are designated as national parks and internationally important wetlands under the Ram-sar Convention.Cattle of the local Tonga and Ila tribes have also traditionally been grazed on the flats provid-ing the floodplain with important cultural significance.Most of the 1.3million people who live in the area are engaged in small-scale agricultural and pastoral activi-ties although some larger commercial farming activities have also been present in the flats for several years,most notably sugar production.2.Impacts of water resources management upon the hydrology of the Kafue FlatsThe hydrological regime of the lower Kafue River,and in turn that of the Kafue Flats,has been signifi-cantly modified through the construction and operation of two dams designed for hydro-electricity generation.The first dam,at Kafue Gorge,was completed in 1971downstream of the flats.This HEP dam is an earth-rock fill structure 50m high,376m long with a storage capac-ity of 785·106m 3.It requires a minimum discharge of 120m 3s À1through its turbines to maintain its 450MW energy generation target (CEH,2001).In order to main-tain these flows a second dam,Itezhi-tezhi,upstream of the flats and 270km from Kafue Gorge,was con-structed during the period 1973–1976and commissioned in 1978.The reservoir behind the dam,which has a max-imum capacity of 6,000·106m 3(CEH,2001),stores water during the wet season which is then released for the turbines at Kafue Gorge.Water takes approximately eight weeks to travel between Itezhi-tezhi and Kafue Gorge.As noted above,flooding within the Kafue Flats has historically been the result of high flows within the Ka-fue River.Howard and Williams (1982)stated that flows in excess of 170m 3s À1as the river passes through the flats would exceed the capacity of the channel and lead to inundation.Peak flood extent historically oc-curred sometime between April and May.The flats would subsequently slowly drain with very little sur-face water remaining by October/November.Fig.2shows the daily discharges at Hook Bridge,which is approximately 60km upstream of Itezhi-tezhi Dam and so unregulated,for the period October 1978–Sep-tember 2000.Flows in excess of 500m 3s À1occur in March of all but the driest years whilst discharges of twice this size are not uncommon.The mean March discharge at Hook Bridge for the period represented in Fig.3is 726m 3s À1.Fig.3shows that at this site the 170m 3s À1threshold discharge is on average ex-ceeded during the six months between January andJune.Fig.1.Zambia and the Kafue River Basin (source:Howard,1985).M.Mumba,J.R.Thompson /Physics and Chemistry of the Earth 30(2005)442–447443Releases from Itezhi-tezhi Dam are very different to the historicalflows experienced within the Kafue River.Fig.4shows the daily discharges downstream of Itezhi-tezhi.The smooth annual rise and fall in dis-charge has been replaced by sudden increases inflow as large volumes of water are released from the dam.These are followed by equally rapid declines in discharge as the large releases are terminated.Fig.3 shows that the average discharge at the height of the wet season is considerably lower(476m3sÀ1)at Itezhi-tezhi than at Hook Bridge.However,Figs.3 and4both demonstrate that a substantial discharge is maintained throughout the dry season whereas naturally this period is associated with lower river flows.The monthly mean discharges exceed the 170m3sÀ1threshold between October and June,an additional three months compared to theflow at Hook Bridge,whilst for the remainder of the year they are within20m3sÀ1of this critical discharge (Fig.3).During the period represented in Fig.4in only four years did the dailyflow from Itezhi-tezhi fall below100m3sÀ1for more than50days.In contrast, theflow at Hook Bridge over the same period (Fig.2)was on average below100m3sÀ1for139days each year.Flow data from within the Kafue Flats themselves are unfortunately limited.There is one gauging station on the main river at Nyimba close to where a distrib-utary channel provides water to the Chunga Lagoon, a seasonally inundated lake of approximately78km2. However,the record from this station is largely incom-plete and extended periods of missing data are com-mon.There are only two complete hydrological years of data for both the pre-and post-dam periods (1974/5–1975/6and2001/2–2002/3respectively).Mete-orological conditions in these two periods are very dif-ferent.The pre-dam period is considerably wetter with over twice the annualflow at the unregulated Hook Bridge in1974/5–1975/6compared with2001/2–2002/ 3.Differentiating the impacts of different meteorologi-cal conditions from those associated with the operation of Itezhi-tezhi with these limited data is therefore difficult.Despite the problems of access to data from within the Kafue Flats,the changes in upstreamflows be-tween Hook Bridge and Itezhi-tezhi suggest a signifi-cant shift in hydrological conditions within the floodplain.Although maximumflood extents may be reduced as a result of lower wet season peakflows, the almost year-round releases from the upstream dam,which are above or close to the threshold dis-charge associated with inundation,means that in parts of thefloodplain inundation is a permanent feature. This shift from seasonal to permanent inundation is exacerbated further downstream where the Kafue Gorge Dam has created a large reservoir.This perma-nentlyflooded area covers between800and1,100km2 as water back ups into the eastern end of theflats (CEH,2001)including parts of Chunga Lagoon.The enhanced dry seasonflows released from Itezhi-tezhi (Fig.3)maintain the inundation throughout the year in this part of thefloodplain. 444M.Mumba,J.R.Thompson/Physics and Chemistry of the Earth30(2005)442–4473.Ecological implications of changing hydrological changes within the Kafue FlatsThe response of river ecosystems toflow variability varies from one region to another(e.g.Downes et al., 2002).However,it has become increasingly clear that regulation of river systems has been accompanied by major changes in the structure of biotic communities (Poffet al.,1997).Flow disturbance is known to provide the stimulus for the establishment of opportunistic plants particularly alien invasive species(Røslett, 1988).Areas within the Kafue Flats such as Chunga La-goon have witnessed rapid changes in vegetation.It was recognised that some changes in the ecological character of theflats following regulation would take place(Howard and Williams,1982).However the inva-sion and eventual establishment of a woody alien species in a grassland ecosystem was perhaps the least expected.M.Mumba,J.R.Thompson/Physics and Chemistry of the Earth30(2005)442–447445Mimosa pigra(henceforth mimosa)has become a dom-inant species in the Chunga Lagoon over the last15 years.Before1980there was only one infestation occu-pying approximately2ha at the head of the Nam-pongwe stream,whichflows through Chunga Lagoon, although it had previously been recorded on levees bor-dering the Kafue River(Douthwaite and van Lavieren, 1977;Sheppe,1985).By the mid1980s it was spreading and Thompson(1986)suggested that it was showing signs of becoming a weed that might require control. Ground and aerial surveys undertaken from1983to 1985showed that mimosa had spread downstream onto thefloodplain.In1986it covered approximately100ha (Thompson,1986)whilst a survey undertaken in2003 shows that this area has since increased to around 2,500ha.An incredibly monospecific species(Lonsdale,1983), mimosa is quickly replacing grassland vegetation previ-ously dominant in theflats such as Echinochloa stagnina and Oryza longistaminata.The explosion of mimosa, which thrives inflooded areas,has been concentrated in those parts of thefloodplain which are now inundated permanently,or at leastflooded for longer periods than in the past,as a result of the year-round releases from Itezhi-tezhi and backwater effects from the Kafue Gorge dam.Species which cannot withstand longer periods of flooding,such as Nymphaea(waterlilies),are completely absent at Chunga Lagoon.Other moreflood tolerant species such as Phragmites mauritanus and Typha domingensis are also increasing in extent.As a biological invasion,the existence and spread of mimosa could lead to detrimental consequences in the floodplain ecosystem through the alteration of resource utilization,modification of the trophic structure or even changes in the disturbance regime(e.g Lonsdale,1983). Elsewhere in the world such impacts have already been felt.For example,in the ecologically and economically valuable wetlands of the top end of northern Australia, mimosa has replaced native vegetation(Braithwaite et al.,1989).Such changes within the Kafue Flats could severely impact the services for which this wetland is val-ued in particular food and habitat support for wildlife. The extent of grassland habitat is declining with clear detrimental implications for wildlife,including the ende-mic lechwe,as well as pastoral communities.4.ConclusionThe construction and operation of the two dams in between which the Kafue Flats are sandwiched have modified the hydrological regime of thefloodplain.Parts of thefloodplain are now permanentlyflooded due to year-round releases from Itezhi-tezhi upstream and the backwater effects from the Kafue Gorge Dam further downstream.In these areas changing hydrological con-ditions have permitted the invasion and expansion of mimosa.The ecological value of this internationally important wetland is threatened by a plant which is known to reduce plant and animal biodiversity onflood-plains by out competing native plants and reducing valuable habitat for wildlife(Braithwaite et al.,1989). Changing vegetation patterns within thefloodplain also have important implications for the pastoralist commu-nities within theflats.The case of the Kafue Flats illustrates the need to monitor this and similar wetlands throughout the African continent if changes in ecological conditions following anthropogenic disturbances,which are increasing in number and magnitude,are to be accu-rately predicted and managed.There is a particular need to investigate the adaptations of tropical wetland vegetation communities to changes inflow andflood-ing regimes.AcknowledgementsThe work presented in this paper forms part of an ongoing PhD study by M.Mumba.The PhD is funded through the University College London(UCL)Ted Hollis Scholarship in Wetland Hydrology and Conser-vation.The authors are grateful to the many donors who made the Scholarship possible.Additionalfinancial support has been obtained from the Department of Geography,UCL and the UCL Graduate School. ReferencesAcreman,M.C.,Fraquharson,F.A.K.,McCartney,M.P.,Sullivan,C., Campbell,K.,Hodgson,N.,Morton,J.,Smith,D.,Birley,M., Knott, D.,Lazenby,J.,Wingfield,R.,Barbier, E.B.,2000.Managedflood releases from reservoirs:issues and guidance.Report to DFID and the World Commission on Dams.Centre for Ecology and Hydrology,Wallingford,UK.Burke,J.J.,Jones,M.J.,Kasimona,V.,1994.Approaches to integrated water resources development and management of the Kafue Basin, Zambia.In:Kirby,C.,White,W.R.(Eds.),Integrated River Basin Development.Wiley,London,UK,pp.407–424.Braithwaite,R.W.,Lonsdale,W.M.,Estbergs,J.A.,1989.Alien vegetation and native biota in tropical Australia:the impact of Mimosa pigra.Biol.Conserv.48,189–210.Centre for Ecology and Hydrology(CEH).,2001.Managedflood releases:Aworking conference on guidelines for managedflood releases and lessons learned from Itezhi-tezhi.Report for Work-shop,Lusaka,Zambia,13–14March2001.Chabwela,H.N.W.,Mumba,W.,1998.Integrating water conservation and population strategies on the Kafue Flats.In:de Sherbinin,A., Dompka,V.(Eds.),Water and Population Dynamics.American Association for the Advancement of Science,Washington,DC, USA.Available from(2004):/international/ ehn/waterpop/zambia.htm.Douthwaite,R.J.,van Lavieren,L.P.,1977.ADescription of the vegetation of Lochinvar National Park,Zambia.Technical report 34,National Council for Scientific Research,Lusaka,Zambia.446M.Mumba,J.R.Thompson/Physics and Chemistry of the Earth30(2005)442–447Downes,B.J.,Barmuta,L.A.,Fairweather,P.G.,Faith,D.P.,Keough, M.J.,Lake,P.S.,Mapstone,B.D.,Quinn,G.P.,2002.Monitoring Ecological Impacts:Concepts and Practice in Flowing Waters.Cambridge University Press,Cambridge,UK.Howard,G.W.,1985.The Kafue Flats of Zambia—a wetland ecosystem comparable withfloodplain areas of northern Australia.Proceedings of the Ecological society of Australia13,293–306. Howard,G.W.,Williams,G.J.(Eds.),1982.Proceedings of the National Seminar on Environment and Change:The Consequences of Hydroelectric Power Development on the Utilization of the Kafue Flats.Kafue Basin Research Committee,University of Zambia,Lusaka,Zambia.Japan International Cooperation Agency(JICA)1992.Final report main:The master plan study on Hydrologic observation systems of the major river basins of ernment of Republic of Zambia/Ministry of Energy and Water Develeopment,Lusaka, Zambia.Lonsdale,W.M.,1983.Rates of spread of an invading species—Mimosa pigra in northern Australia.J.Ecol.81,513–521.Minderhound,P.,1980.Planning of Flood Control and Land Use in Relation to Water Management in the Lower Kafue Catchment Area in Zambia.DHV,Delft,The Netherlands.Poff,N.L.,Allan,J.D.,Bain,M.B.,Karr,J.R.,Prestergaard,K.L., Richter,B.D.,Sparks,R.E.,Stromberg,J.C.,1997.The natural flow regime:a paradigm for river conservation and restoration.Bioscience47,769–784.Røslett,B.,1988.Aquatic weed problems in a hydroelectric river:the river Otra,Norway.Regulated Rivers:Res.Manag.17,303–310.Sheppe,W.A.,1985.Effects of human activities on ZambiaÕs Kafue Flats ecosystems.Environ.Conserv.12(1),49–57. Thompson,S.R.,1986.Report on new invasion by Mimosa pigra in an African National Park.Aquaphyte,summer1986.Williams,G.J.,1977.Transferred water use in the Kafue Flats.In: Williams,G.J.,Howard,G.W.(Eds.),Development and Ecology in the Lower Kafue Basin in the1970s.Kafue Basin Research Committee,University of Zambia,Lusaka,Zambia,pp.13–27.M.Mumba,J.R.Thompson/Physics and Chemistry of the Earth30(2005)442–447447。