第五章 风险与风险管理-马尔科夫分析法(MARKOVANALYSIS)
- 格式:pdf
- 大小:107.37 KB
- 文档页数:2
2015年注册会计师资格考试内部资料公司战略与风险管理第五章 风险与风险管理知识点:统计推论法● 详细描述:统计推论是进行项目风险评估和分析的一种十分有效的方法,它可分为前推、后推和旁推三种类型。
【前推】就是根据历史的经验和数据推断出未来事件发生的概率及其后果。
【后推】是在手头没有历史数据可供使用时所采用的一种方法。
是把未知的想象的事件及后果与一已知事件与后果联系起来,把未来风险事件归结到有数据可查的造成这一风险事件的初始事件上,从而对风险做出评估和分析。
【旁推法】就是利用类似项目的数据进行外推,用某一项目的历史记录对新的类似建设项目可能遇到的风险进行评估和分析。
风险事件:下暴雨 后果:项目延期 问题:不知道投资期间是否会下暴雨 该地区6月份至9月份为汛期,暴雨增多 考察一下项目计划投资时间(一)适用范围:适合于各种风险分析预测。
(二)实施步骤 (三)主要优点和局限性 【主要优点】 (1)在数据充足可靠的情况下简单易行; (2)结果准确率高。
【局限性】 (1)由于历史事件的前提和环境已发生了变化,不一定适用于今天或未来; (2)没有考虑事件的因果关系,使外推结果可能产生较大偏差。
为了修正这些偏差,有时必须在历史数据的处理中加入专家或集体的经验修正。
例题:1.下列关于项目风险的说法中,观点不正确的是()。
A.任何项目都充满着风险B.不同项目的风险是不一样的C.项目风险的源头往往来自于组织外部D.组织内部的利益冲突易产生项目风险正确答案:C解析:项目风险的普遍性说明任何项目都充满着风险;而完全一样的项目不存在,不同项目的风险是不一样的;项目风险的源头往往来自组织本身。
2.甲公司计划向市场推出一款新产品,公司历史上从未销售过类似产品。
为降低产品上市失败的可能性,公司搜集了一些其他公司类似产品上市后的销售数据进行分析。
根据以上信息可以判断,甲公司采用的这一方法是()。
A.旁推法B.后推法C.前推法D.正推法正确答案:A解析:旁推法就是利用类似项目的数据进行外推,用某一项目的历史记录对新的类似建设项目可能遇到的风险进行评估和分析。
Chapter 18Markov Analysis18.1INTRODUCTIONMarkov analysis (MA)is an analysis technique for modeling system state transitions and calculating the probability of reaching various system states from the model.MA is a tool for modeling complex system designs involving timing,sequencing,repair,redundancy,and fault tolerance.MA is accomplished by drawing system state transition diagrams and examining these diagrams for understanding how cer-tain undesired states are reached and their relative probability.MA can be used to model system performance,dependability,availability,reliability,and safety.MA describes failed states and degraded states of operation where the system is either partially failed or in a degraded mode where some functions are performed while others are not.Markov chains are random processes in which changes occur only at fixed times.However,many of the physical phenomena observed in everyday life are based on changes that occur continuously over time.Examples of these continuous processes are equipment breakdowns,arrival of telephone calls,and radioactive decay.Markov processes are random processes in which changes occur continuously over time,where the future depends only on the present state and is independent of history.This property provides the basic framework for investigations of system reliability,dependability,and safety.There are several different types of Markov processes.In a semi-Markov process,time between transitions is a random variable that depends on the transition.317Hazard Analysis Techniques for System Safety ,by Clifton A.Ericson,IICopyright #2005John Wiley &Sons,Inc.318MARKOV ANALYSIS18.2BACKGROUNDThis analysis technique falls under the system design hazard analysis type (SD-HAT)and should be used as a supplement to the SD-HAT analysis.Refer to Chapter3for a description of the analysis types.The purpose of MA is to provide a technique to graphically model and evaluate systems components in order to resolve system reliability,safety,and dependency issues.The graphical model can be translated into a mathematical model for probability calculations.The strength of MA is its ability to precisely model and numerically evaluate complex system designs,particularly those involving repair and dependencies.Markov analysis can be used to model the operation,or failure,of complex system designs.MA models can be constructed on detailed component designs or at a more abstract subsystem design level.MA provides a very detailed mathematical model of system failure states,state transitions,and timing.The MA model quickly becomes large and unwieldy as system size increases and is,therefore,usually used only on small system applications or systems abstracted to a smaller more manageable model.Markov analysis can be applied to a system early in development and thereby identify design issues early in the design process.Early application will help system developers to design in safety and reliability of a system during early development rather than having to take corrective action after a test failure or,worse yet,a mishap.Markov analysis is a somewhat difficult technique to learn,understand,and master.A high-level understanding of mathematics is needed to apply the method-ology.The technique must be mastered,the material understood,and there must be detailed requisite knowledge of the process being modeled.MA generally requires an analyst very experienced with the technique and the mathematics involved.Although a very powerful analysis tool,MA does not appear to provide a strong benefit to the system safety analyst as do other analysis tools that are available.It is more often used in reliability for availability modeling and analysis.MA does not identify hazards;its main purpose is to model state transitions for better understand-ing of system operation and calculating failure state probabilities.MA models can quickly become excessively large and complex,thereby forcing simplified models of the system.MA is recommended primarily only when extremely precise prob-ability calculations are required.Fault tree analysis(FTA)is recommended for most analysis applications because the fault tree combinatorial model is easier to generate from the system design,and the resulting probability calculations are equal or very close to results from MA models.FTA can be used to model extremely large complex systems,which would be impossible by MA.18.3HISTORYMarkov chain theory derives its name from the Russian mathematician Andrei A.Markov(1856–1922),who pioneered a systematic investigation of18.4DEFINITIONS319 mathematically describing random processes.The semi-Markov process was intro-duced in1954by Paul Levy to provide a more general model for probabilistic systems.18.4DEFINITIONSIn order to facilitate a better understanding of MA,some definitions for specific terms are in order.The following are basic MA terms:State Condition of a component or system at a particular point in time(i.e.,oper-ational state,failed state,degraded state,etc.).Connecting edge Line or arrow that depicts a component changing from one system state to a different state,such as transitioning from an operational state to a failed state.State transition diagram State transition diagram is a directed graph represen-tation of system states,transitions between states,and transition rates.These diagrams contain sufficient information for developing the state equations, which are used for probability calculations.The state transition diagram is the backbone of the technique.Combinatorial model Graphical representation of a system that logically com-bines system components together according to the rules of the particular model.Various types of combinatorial models available include reliability block diagrams(RBDs),fault trees(FTs),and success trees.In MA the state transition diagram is the combinatorial model.Deterministic process Deterministic process or model predicts a single outcome from a given set of circumstances.A deterministic process results in a sure or certain outcome and is repeatable with the same data.A deterministic model is sure or certain and is the antonym of random.Stochastic process A stochastic process or model predicts a set of possible outcomes weighted by their likelihoods or probabilities.A stochastic process isa random or chance outcome.Markov chain Sequence of random variables in which the future variable is deter-mined by the present variable but is independent of the way in which the present state arose from its predecessors(the future is independent of the past given the present).The Markov chain assumes discrete states and a discrete time par-ameter,such as a global clock.Markov process Assumes states are continuous.The Markov process evaluates the probability of jumping from one known state into the next logical state until the system has reached thefinal state.For example,thefirst state is every-thing in the system working,the next state is thefirst item failed,and this continues until thefinal system failed state is reached.The behavior of this pro-cess is that every state is memoryless,meaning that the future state of the systemdepends only on its present state.In a stationary system the probabilities that gov-ern the transitions from state to state remain constant,regardless of the point in time when the transition occurs.Semi-Markov process Similar to that of a pure Markov model,except the tran-sition times and probabilities depend upon the time at which the system reached the present state.The semi-Markov model is useful in analyzing complex dyna-mical systems and is frequently used in reliability calculations.18.5THEORYMarkov analysis utilizes a state transition diagram or directed graph that portrays in a single diagram the operational and failure states of the system.The state diagram is flexible in that it can serve equally well for a single component or an entire system.The diagram provides for representation of system states,transitions between states,and transition rates.These diagrams contain sufficient information for developing the state equations,which when resolved provide the probability calculations for each state.Figure 18.1illustrates the overall MA process.18.6METHODOLOGYTable 18.1lists and describes the basic steps of the MA process.18.6.1State Transition Diagram ConstructionAlthough the basic rules guiding the construction of a state diagram are simple,a good understanding of the system being analyzed is necessary.Construction of a state diagram begins with an examination of the system and a determination of the possible states in which it may exist.Figure 18.2shows the symbols utilized in MAmodeling.State Transition Diagram State Equations System & State Probability CalculationsData• Failure Rates •Repair RatesFigure 18.1MA process.320MARKOV ANALYSISSpecifically,the state diagram is constructed as follows:1.Begin at the left of the diagram with a state (circle)identified as S1.All equip-ment is initially good (operational)in this state.2.Study the consequences of failing each element (any component,circuit,orchannel defined as a single failure)in each of its failure modes.Group as a common consequence any that result in removing the same or equivalent cir-cuitry from operation.3.Assign new states (circles)and identify as S2,S3,S4,and so on for the uniqueconsequences of step 2.TABLE 18.1MA ProcessStepTask Description 1Define the system.Examine the system and define the system boundaries,subsystems,and interfaces.2Identify the system states.Establish the goals of the MA and determine the system and component states of interest.3Construct state diagram.Construct the state diagram for all of the identified systemstates.Show the transitions between states andtransition rates.4Develop mathematical equations.Develop the mathematical equations from the statediagram.5Solve mathematical equations.Solve the mathematical equations through manual orcomputer techniques.6Evaluate the outcome.Evaluate the outcome of the MA analysis.7Recommend corrective action.Make recommended design changes as found necessaryfrom the MA analysis.8Hazard tracking.Enter identified hazards,or hazard data,into the hazardtracking system (HTS).9Document MA.Document the entire MA process,including state diagrams,equations,transition rates,and mathematical solution.Figure 18.2MA symbols.18.6METHODOLOGY 3214.Connect arrows from S1,to each of the new states,and note on each arrow thefailure rate or rates of the element or elements whose failure determined tran-sition to the new state.5.Repeat steps 2,3,and 4for each of the new states failing only the elementsstill operational in that state.Continuously observe for cases where the fail-ures may cause transition to one of the states formerly defined.6.Continue the process until the initial equipment is totally nonoperational.To limit the state diagram to a reasonable size,without a major sacrifice in accu-racy,longer paths between the initial operational state and the system failure state may be truncated.For example,if one path to a system failure consists of three transitions and another is five transitions,then the longer path may be truncated.The effect of this approximation must be examined in the final model to ensure minimal impact.Figure 18.3shows an example MA state transition model for a one-component system with no repair.The reliability block diagram (RBD)shows the system design complexity.In this MA model only two states are possible,the operational state and the failed state.The starting state is S1in which the system is operational (good).In state S2the system is failed.The transition from state S1to state S2is based on the component failure rate l A .Note that A W indicates component A working and A F indicates component A failed.The connecting edge with the notation l A indicates the transitional failure of component A.Figure 18.4shows an example MA model for a one-component system with repair.Note how component A can return from the failed stated to the operational state at the repair transition rate m A .A WAFRBD Model MA State Transition ModelFigure 18.3MA model—one-component system with no repair.A WAFRBD Model MA State Transition ModelFigure 18.4MA model—one-component system with repair.322MARKOV ANALYSIS18.6.2State Equation ConstructionA stochastic processes is a random process controlled by the laws of probability that involve the “dynamic”part of probability theory,which includes a collection of ran-dom variables,their interdependence,their change in time,and limiting behavior.The most important variables in analyzing a dynamic process are those of rate and state.MA models are representations of a stochastic process.A Markov process is completely characterized by its transition probability matrix,which is developed from the transition diagram.In safety and reliability work,events involve failure and repair of components.The transitional probabilities between states are a function of the failure rates of the various system components.A set of first-order differential equations is developed by describing the probability of being in each state in terms of the transitional probabilities from and to each state.The number of first-order differential equations will equal the number of system states.The mathematical formula is shown in Figure 18.5and the solution then becomes one of solving the differential equations.Figure 18.6shows a Markov transition diagram for a two-component system comprised of components A and B.A W indicates component A working and A F indicates component A failed.States S1,S2,and S3are noted a “good,”indicating Where P and P are n ¥ 1 column vectors and [A ] is an n ¥ n matrix.Where exp[A ]t is an n ¥ n matrix and P (0) is the initial probability vectordescribing the initial state of the system. P = exp[A ]t • P (0)P = [A ] P •Figure 18.5Markov state equations.A FB FA WB W A Figure 18.6Markov transition diagram—two-component system.18.6METHODOLOGY 323324MARKOV ANALYSISthe system is operational.State S4is noted as“failed,”meaning the system is now in the failed state.The Markov differential equations are developed by describing the probability of being in each system state at time tþD t as a function of the state of the system at time t.The probability of being in state S1at some time tþD t is equal to the prob-ability of being in state S1at time t and not transitioning out during D t.This equation can be written as:P1(tþD t)¼P1(t):½1À(l Aþl B):D tThe probability of being in state S2at time tþD t is equal to the probability of being in state S1at time t and transitioning to state S2in D t plus the probability of being in state S2at time t and not transitioning out during D t.This equation can be written as: P2(tþD t)¼P1(t):l A:D tþP2(t)(1Àl B:D t)All of the state equations are generated in a similar manner,resulting in the follow-ing equations:P1(tþD t)¼P1(t):½1À(l Aþl B):D tP2(tþD t)¼P1(t):l A:D tþP2(t)(1Àl B:D t)P3(tþD t)¼P1(t):l B:D tþP3(t)(1Àl A:D t)P4(tþD t)¼P2(t):l B:D tþP3(t):l A:D tþP4(t) Rearranging the equations results in:½P1(tþD t)ÀP1(t) =D t¼À(l Aþl B):P1(t)½P2(tþD t)ÀP2(t) =D t¼l A:P1(t)Àl B:P2(t)½P3(tþD t)ÀP3(t) =D t¼l B:P1(t)Àl A:P3(t)½P4(tþD t)ÀP4(t) =D t¼l B:P2(t)þl A:P3(t)Taking the limit as D t!0results in:dP1(t)=D t¼À(l Aþl B):P1(t)dP2(t)=D t¼l A:P1(t)Àl B:P2(t)dP3(t)=D t¼l B:P1(t)Àl A:P3(t)dP4(t)=D t¼l B:P2(t)þl A:P3(t)In matrix form this becomes:dP 1(t )=D t dP 2(t )=D t dP 3(t )=D t dP 4(t )=D t ¼À(l A þl B )000l A Àl B 00l B 0Àl A 00l B l A 0 :P 1(t )P 2(t )P 3(t )P 3(t )Solution of these equations provides the probability of being in each state.18.7EXAMPLES 18.7.1Markov ChainA Markov model can look at a long sequence of rainy and sunny days and analyze the likelihood that one kind of weather is followed by another kind.Let us say it was found that 25percent of the time,a rainy day was followed by a sunny day,and 75percent of the time a rainy day was followed by more rain.Additionally,sunny days were followed 50percent of the time by rain and 50percent by sun.Given this data,a new sequence of statistically similar weather can be generated from the following steps:1.Start with today’s weather.2.Given today’s weather,choose a random number to pick tomorrow’s weather.3.Make tomorrow’s weather “today’s weather”and go back to step 2.A sequence of days would result,which might look like:Sunny–Sunny–Rainy–Rainy–Rainy–Rainy–Sunny–Rainy–Rainy–Sunny–Sunny ...The “output chain”would statistically reflect the transition probabilities derived from observed weather.This stream of events is called a Markov chain.18.7.2Markov Model of Two-Component Series Systemwith No RepairFigure 18.7shows an example MA model for a two-component series system with no repair.The RBD indicates that successful system operation requires successful operation of both components A and B.If either component fails,the system fails.In this MA model two states are possible.The starting state is S1,whereby the system is good (operational)when both A and B are working.Transition to state S2occurs when either A fails or B fails.In state S2,either A and B are failed and the system is failed.18.7EXAMPLES 32518.7.3Markov Model of Two-Component Parallel Systemwith No RepairFigure 18.8shows an example MA model for a two-component parallel system with no repair.The RBD indicates that successful system operation only requires success-ful operation of either component A or B.Both components must fail to result in system failure.In this MA model four states are possible.The starting state is S1,whereby the system is good (operational)when both A and B are working.Based on A failure rate l A ,it transitions to the failed state S2.In state S2,A is failed,while B is still good.In state S3,B is failed,while A is still good.In state S4,both A and B are failed.In states S1,S2,and S3the system is good,while in state S4the system is failed.18.7.4Markov Model of Two-Component Parallel System withComponent RepairFigure 18.9shows the MA model for a two-component parallel system with com-ponent repair but no system repair.As in the previous figure,this MA model has four possible states.In this system design and MA model,if the system transitions to state S2,but A is repaired before B fails,then the system is returned to state S1.RBD ModelMA State Transition ModelA WB W A F or B F Figure18.7MA model—two-component series system with no repair.RBD ModelA F FA FB FA WB W MA State Transition ModelFigure 18.8MA model—two-component parallel system with no repair.326MARKOV ANALYSISConversely,if the system is in state S3,the system returns to state S1if component B is repaired before component A fails.The connecting edge with the notation m A indicates repair of component A,and m B indicates repair of component B.18.7.5Markov Model of Two-Component Parallel System with Component /System RepairFigure 18.10shows the MA model for a two-component parallel system with com-ponent repair and /or system repair.In this system design,even after system failure occurs,one or both components can be repaired,thereby making the system oper-ational again.As in the previous figure,this MA model has four possible states.In this system design,and corresponding MA model,if the system transitions to state S2,but A is repaired before B fails,then the system is returned to state S1.Conversely,if the system is in state S3,the system returns to state S1if component B is repaired before component A fails.If state S4is reached,the system can be repaired through repair of A and /or B.RBD ModelMA State Transition ModelFigure 18.9MA model—two-component parallel system with component repair.RBD ModelMA State Transition ModelFigure 18.10MA model—two-component parallel system with system /component repair.18.7EXAMPLES32718.7.6Markov Model of Two-Component Parallel System with SequencingFigure 18.11shows the MA model for a two-component parallel system where system failure only occurs when the components fail in a specific sequence.In this system design,A monitors B such that if B fails,the fault is detected by A and is immediately repaired.If A fails before B,then it cannot detect failure of B and initiate the repair of B and system failure occurs.Note that this model assumes that B is always repaired before A can fail,thereby maintaining an operational system.In this MA model four states are possible.The starting state is S1,whereby the system is good (operational)when both A and B are working.In state S3component B has failed while A is still working.In this state repair is the only option,thereby taking the system back to state S1.In state S2component A is failed while B is working.If A is repaired before B fails,the system can be restored to state S1,other-wise the system will continue to operate until component B fails,thereby taking the system to state S4,which is system failure.18.8MARKOV ANALYSIS AND FTA COMPARISONSMarkov analysis and FTA are often competing techniques.Each technique has its advantages and disadvantages.This section demonstrates both MA and FTA models and probability calculations for the same system design paring the two methods side by side helps to illustrate some of the strengths and weaknesses of each methodology.Figure 18.12compares MA and FTA for a two-component series system.The conclusion from this comparison is that both methods provide the same results (i.e.,the equations are identical).For most analysts the FTA model is easier to understand and the FTA mathematics are easier to solve.Figure 18.13compares MA and FTA for a two-component parallel system.The conclusion from this comparison is that both methods provide the same results (i.e.,the equations are identical).For most analysts the FTA model is easier to understand and the FTA mathematics are easier to solve.MA State Transition ModelRBD ModelFigure 18.11MA model—two-component parallel system with sequencing.328MARKOV ANALYSIS18.8MARKOV ANALYSIS AND FTA COMPARISONS329Figure18.12MA and FTA comparison for a two-component series system.Figure18.14compares MA and FTA for a two-component sequence parallel sys-tem.The conclusion from this comparison is that the resulting equations for each model are different.The FT equation is an approximation.The numerical compari-son table shows calculations for different time intervals using the same failure rates. The results contained in this table show that the two models produce very closeFigure18.13MA and FTA comparison for a two-component parallel system.330MARKOV ANALYSISFigure18.14MA and FTA comparison for a two-component sequence parallel system. results up to about1million hours of operation.This indicates that the FTA approxi-mation produces very good results.For most analysts the FTA model is easier to understand and the FTA mathematics are easier to solve.Figure18.15compares MA and FTA for a partial monitor with coverage system. This is a coverage-type problem,whereby the monitor does not provide complete coverage of the circuit being monitored.The conclusion from this comparison is that the resulting equations for each model are different.The FT equation is an approximation.The numerical compari-son table shows calculations for different time intervals using the same failure rates. The results contained in this table show that the two models produce very close results up to about10,000hours of operation.This indicates that the FTA approxi-mation produces very good results.For most analysts the FTA model is easier to understand and the FTA mathematics are easier to solve.18.9ADVANTAGES AND DISADVANTAGES331Figure18.15MA and FTA comparison for a partial monitor with coverage system.18.9ADVANTAGES AND DISADVANTAGESThe following are advantages of the MA technique:1.MA provides a precise model representation for special design complexities,such as timing,sequencing,repair,redundancy,and fault tolerance.2.MA is a good tool for modeling and understanding system operation,as wellas potential system failure states and repair.3.MA can be applied to a system very early in development and thereby identifysafety issues early in the design process.332MARKOV ANALYSIS4.There are commercial software packages available to assist in MA modelingand probability calculations.Although a strong and powerful technique,MA analysis has the following disadvantages:1.MA does not identify system hazards;it only evaluates identified hazards inmore detail.2.MA is not a root cause analysis tool.It is a tool for evaluating the most effec-tive methods for combining components together.3.MA requires an experienced analyst to generate the graphical models andprobability calculations.4.The MA model quickly becomes large and complex;thus it is more limited tosmall systems or a high-level system abstraction.18.10COMMON MISTAKES TO AVOIDWhenfirst learning how to perform an MA,it is commonplace to commit some traditional errors.The following is a list of typical errors made during the conduct of an MA:1.Not obtaining the necessary training.ing the complex MA technique when a simpler technique,such as FTA,might be more appropriate.3.Failing to recognize that the transitions(probabilities)of changing fromone state to another are assumed to remain constant.Thus,a Markov model is used only when a constant failure rate and repair rate assumption is justified.4.Failing to recognize that the transition probabilities are determined only by thepresent state and not the system’s history.This means future states of the sys-tem are assumed to be independent of all but the current state of the system.The Markov model allows only the representation of independent states.18.11SUMMARYThis chapter discussed the MA technique.The following are basic principles that help summarize the discussion in this chapter:1.MA is a tool for modeling complex system designs involving timing,sequen-cing,repair,redundancy,and fault tolerance.2.MA provides both graphical and mathematical(probabilistic)system models.BIBLIOGRAPHY3333.MA models can easily become too large in size for comprehension and math-ematical calculations,unless the system model is simplifiputer tools are available to aid in analyzing more complex systems.4.MA is recommended only when very precise mathematical calculations arenecessary.5.MA should be a supplement to the SD-HAT analysis.BIBLIOGRAPHYEricson,C.A.and J.D.Andrews,Fault Tree and Markov Analysis Applied to Various Design Complexities,Proceedings of the18th International System Safety Conference,2000, pp.324–335.Faraci,V.,Jr.,Calculating Probabilities of Hazardous Events(Markov vs.FTA),Proceedings of the18th International System Safety Conference,2000,pp.305–323. International Electrotechnical Commission,IEC61165,Application of Markov Techniques, 1995.Pukite,J.and P.Pukite,Modeling for Reliability Analysis:Markov Modeling for Reliability, Maintainability,Safety and Supportability Analyses of Complex Computer Systems,IEEE Press,1998.。
马尔科夫随机场在金融风险管理中的应用技巧一、马尔科夫随机场的基本原理马尔科夫随机场是一种用来描述随机现象的数学模型,其基本原理是假设未来的状态只依赖于当前状态,与过去的状态无关。
在金融风险管理中,马尔科夫随机场可用于建立模型,对金融市场的波动和风险进行预测和管理。
二、金融市场的风险特点金融市场的波动性和不确定性是金融风险管理中的重要问题。
市场中的各种因素相互影响,导致金融资产价格的波动,从而带来风险。
马尔科夫随机场可以捕捉到这些复杂的市场因素之间的关联性,为金融风险管理提供有力的工具。
三、马尔科夫随机场在金融市场波动性预测中的应用通过建立马尔科夫随机场模型,可以对金融市场的波动性进行预测。
通过对历史数据进行分析,可以建立马尔科夫链,从而推断未来的市场波动情况。
这对于投资者进行风险管理和资产配置具有重要意义。
四、马尔科夫随机场在金融风险定价中的应用金融市场的风险定价是金融领域重要的课题之一。
马尔科夫随机场可以将市场中的不同因素进行整合,从而对金融资产的风险进行定价。
这有助于投资者更加准确地评估风险和收益,制定更加合理的投资策略。
五、马尔科夫随机场在金融风险监测中的应用金融风险监测是金融机构日常工作的重要组成部分。
通过应用马尔科夫随机场模型,可以对金融市场中的风险因素进行监测和预警。
及时发现和应对风险,有助于避免金融危机的发生,保障金融市场的稳定和安全。
六、马尔科夫随机场在金融衍生品定价中的应用金融衍生品是金融市场中常见的交易工具,其定价是金融领域的重要问题。
马尔科夫随机场可以对不同的金融市场因素进行建模,从而对金融衍生品的风险和定价进行分析和预测。
这有助于金融机构和投资者更加准确地对衍生品进行定价和交易。
七、马尔科夫随机场在金融风险管理中的挑战与前景尽管马尔科夫随机场在金融风险管理中有着广泛的应用前景,但同时也面临着一些挑战。
金融市场的复杂性和不确定性使得建立准确的马尔科夫随机场模型成为一项挑战。

第五章风险与风险管理第五节风险管理技术与方法七、情景分析法(★)情景分析法又称前景描述法,是假定某种现象或某种趋势将持续到未来的前提下,对预测对象可能出现的情况或引起的后果作出预测的方法。
通常用来对预测对象的未来发展作出种种设想或预计,是一种直观的预测方法。
情景分析可用来预计威胁和机遇可能发生的方式,以及如何将威胁和机遇用于各类长期及短期风险。
在周期较短及数据充分的情况下,可以从现有情景中推断出可能出现的情景。
对于周期较长或数据不充分的情况,情景分析的有效性更依赖于合乎情理的想象力。
在识别和分析那些反映诸如最佳情景、最差情景及期望情景的多种情景时,可用来识别在特定环境下可能发生的事件并分析潜在的后果及每种情景的可能性。
如果积极后果和消极后果的分布存在比较大的差异,情景分析就会有很大用途。
情景分析需要分析的变化可能包括:外部情况的变化(例如技术变化);不久将要做出的决定,而这些决定可能会产生各种不同的后果;利益相关者的需求以及需求可能的变化方式;宏观环境的变化(如监管及人口统计等);有些变化是必然的,而有些是不确定的。
有时,某种变化可能归因于另一个风险带来的结果。
例如,气候变化的风险正在造成与食物链有关的消费需求发生变化,这样会改变哪些食品的出口会盈利,以及哪些食品可能在当地生产更经济。
局部及宏观因素或趋势可以按重要性和不确定性进行列举并排序。
应特别关注那些最重要、最不确定的因素。
可以绘制出关键因素或趋势的图形,以显示那些情景可以进行开发的区域。
(一)适用范围通过模拟不确定性情景,对企业面临的风险进行定性和定量分析。
(二)主要优点和局限性1.主要优点:对于未来变化不大的情况能够给出比较精确的模拟结果。
2.局限性:(1)在存在较大不确定性的情况下,有些情景可能不够现实;(2)在运用情景分析时,主要的难点涉及数据的有效性以及分析师和决策者开发现实情境的能力,这些难点对结果的分析具有修正作用;(3)如果将情景分析作为一种决策工具,其危险在于所用情景可能缺乏充分的基础,数据可能具有随机性,同时可能无法发现那些不切实际的结果。
第五章风险与风险管理经典例题详解一、单项选择题【例题1·单选题】今年以来,受国内外各种不确定性因素的影响,房地产行业的发展进入了一个新阶段,甲房地产公司从定性和定量的角度,按照很好、较好、一般、较差4种不同的假设条件,预测了本公司本年度将面临的各种不确定因素以及由此给公司带来的各种不同后果,甲房地产公司采用的风险管理技术与方法是()。
(2014年)A.条件预测法B.敏感性分析法C.统计推论法D.情景分析法【答案】D【解析】情景分析法在识别和分析那些反映诸如最佳情景、最差情景及期望情景的多种情景时,可用来识别在特定环境下可能发生的事件并分析潜在的后果及每种情景的可能性。
情景分析法通过模拟不确定性情景,对企业面临的风险进行定性和定量分析。
题目中,甲房地产公司从定性和定量的角度,按照很好、较好、一般、较差4种不同的假设条件,预测了本公司本年度将面临的各种不确定因素,属于情景分析法。
选项D正确。
【例题2·单选题】下列风险管理技术与方法中,能够对风险进行定量分析的是()。
(2014年)A.事件树分析法B.专家意见法C.风险评估系图法D.流程图分析法【答案】A【解析】选项B、C、D是定性分析;事件树分析法可以用于定性和定量分析,所以选项A正确。
【例题3·单选题】企业信息安全管理中发生失误导致的风险属于()。
(2014年)A.运营风险B.市场风险C.操作风险D.技术风险【答案】A【解析】运营风险至少要考虑以下几个方面:(1)企业产品结构、新产品研发方面可能引发的风险;(2)企业新市场开发,市场营销策略(包括产品或服务定价与销售渠道,市场营销环境状况等)方面可能引发的风险;(3)企业组织效能、管理现状、企业文化,高、中层管理人员和重要业务流程中专业人员的知识结构、专业经验等方面可能引发的风险;(4)期货等衍生产品业务中发生失误带来的风险;(5)质量、安全、环保、信息安全等管理中发生失误导致的风险;(6)因企业内、外部人员的道德风险或业务控制系统失灵导致的风险;(7)给企业造成损失的自然灾害等风险;(8)企业现有业务流程和信息系统操作运行情况的监管、运行评价及持续改进能力方面引发的风险。
金融市场的马尔可夫转换和风险分析随着金融市场的不断发展,投资者需要更加精准的分析手段以获取更大的利润,但金融市场的波动性很大,如何更好地预测市场的走向成为了亟需解决的问题。
马尔可夫转换和风险分析成为了投资者们重要的工具之一。
一、马尔可夫转换马尔可夫转换是一种基于概率模型的数学方法,它用于描述具有有限状态空间的随机过程。
在金融市场中,马尔可夫转换用于建立起一条状态转移的链,使得我们能够通过当前的状态预测下一时刻的状态可能出现的情况。
简单来说,马尔可夫转换把市场的波动态势抽象出来,将其转化成一系列的状态。
这个状态是随时变化的,同时还会受到各种因素的影响,而马尔可夫转换就是建立这种影响之间的联系,让我们可以根据历史数据预测出未来的情况。
二、风险分析风险分析是针对不确定性和风险的管理过程,其目的是识别、评估和控制可能影响投资的不确定因素。
在金融市场中,风险分析可以帮助我们更好地进行投资决策,尽量降低投资风险,同时获取更大的利润。
在金融市场中,对风险进行分析需要考虑多种因素,包括市场环境、历史数据、行业动态、政策规定、公司财务等。
通过对这些因素进行分析,可以评估投资的风险,通过控制风险可以在市场走势良好的时候获得更大的利润。
三、马尔可夫转换与风险分析的结合马尔可夫转换和风险分析是两种不同的方法,但它们可以结合起来使用,形成一种更加精确的投资分析方法。
通过使用马尔可夫转换,我们可以将市场的波动态势转化成一种状态链,在这个状态链下我们可以从历史数据中预测未来的情况。
而风险分析则可以用来评估这种情况的风险,并采取一些措施来降低风险。
这种方法的好处是可以利用历史数据进行预测,并且可以通过分析风险来避免投资的损失。
同时,在实际操作中,我们还可以使用马尔可夫转换的一些扩展和优化算法来改进我们的分析效果。
例如,我们可以使用隐马尔可夫模型或动态贝叶斯网络等算法来更好地预测市场的走向。
四、总结马尔可夫转换和风险分析是投资领域中被广泛使用的两种分析方法。
第五章风险与风险管理经典例题详解一、单项选择题【例题1·单选题】今年以来,受国内外各种不确定性因素的影响,房地产行业的发展进入了一个新阶段,甲房地产公司从定性和定量的角度,按照很好、较好、一般、较差4种不同的假设条件,预测了本公司本年度将面临的各种不确定因素以及由此给公司带来的各种不同后果,甲房地产公司采用的风险管理技术与方法是()。
(2014年)A.条件预测法B.敏感性分析法C.统计推论法D.情景分析法【答案】D【解析】情景分析法在识别和分析那些反映诸如最佳情景、最差情景及期望情景的多种情景时,可用来识别在特定环境下可能发生的事件并分析潜在的后果及每种情景的可能性。
情景分析法通过模拟不确定性情景,对企业面临的风险进行定性和定量分析。
题目中,甲房地产公司从定性和定量的角度,按照很好、较好、一般、较差4种不同的假设条件,预测了本公司本年度将面临的各种不确定因素,属于情景分析法。
选项D正确。
【例题2·单选题】下列风险管理技术与方法中,能够对风险进行定量分析的是()。
(2014年)A.事件树分析法B.专家意见法C.风险评估系图法D.流程图分析法【答案】A【解析】选项B、C、D是定性分析;事件树分析法可以用于定性和定量分析,所以选项A正确。
【例题3·单选题】企业信息安全管理中发生失误导致的风险属于()。
(2014年)A.运营风险B.市场风险C.操作风险D.技术风险【答案】A【解析】运营风险至少要考虑以下几个方面:(1)企业产品结构、新产品研发方面可能引发的风险;(2)企业新市场开发,市场营销策略(包括产品或服务定价与销售渠道,市场营销环境状况等)方面可能引发的风险;(3)企业组织效能、管理现状、企业文化,高、中层管理人员和重要业务流程中专业人员的知识结构、专业经验等方面可能引发的风险;(4)期货等衍生产品业务中发生失误带来的风险;(5)质量、安全、环保、信息安全等管理中发生失误导致的风险;(6)因企业内、外部人员的道德风险或业务控制系统失灵导致的风险;(7)给企业造成损失的自然灾害等风险;(8)企业现有业务流程和信息系统操作运行情况的监管、运行评价及持续改进能力方面引发的风险。
2021注会《公司战略与风险管理》考试大纲
考试目标
考生应当根据本科目考试内容与能力等级的要求,理解、掌握或运用下列相关的专业知识和职业技能,坚守职业价值观、遵循职业道德、坚持职业态度,解决实务问题。
考试涉及的相关法规截至2020年12月31日。
1.公司战略的基本理论;
2.战略管理的特征与过程;
3.外部环境分析与内部环境分析的主要内容与方法;
4.公司三个层次战略的主要内容;
5.公司各种战略的开发方向与实现途径;
6.战略实施和战略控制的主要内容、过程与方法;
7.公司治理的概念及理论;
8.公司内部治理结构和外部治理机制;
9.公司治理的基础设施;
10.风险管理基本原理;
11.风险管理的基本流程和管理体系;
12.风险管理的主要技术与方法。
考试内容与能力等级
参考法规
1.中央企业全面风险管理指引(国资发改革[2006]108号,2006年6月6日)
2.企业内部控制基本规范(财会[2008]7号,2008年5月22日)
3.企业内部控制应用指引(财会[2010]11号,2010年4月15日)
4.企业内部控制评价指引(财会[2010]11号,2010年4月15日)
5.企业内部控制审计指引(财会[2010]11号,2010年4月15日)
6.关于加强中央企业内部控制体系建设与监督工作的实施意见(国资发监督规〔2019〕101号,2019年10月19日)。
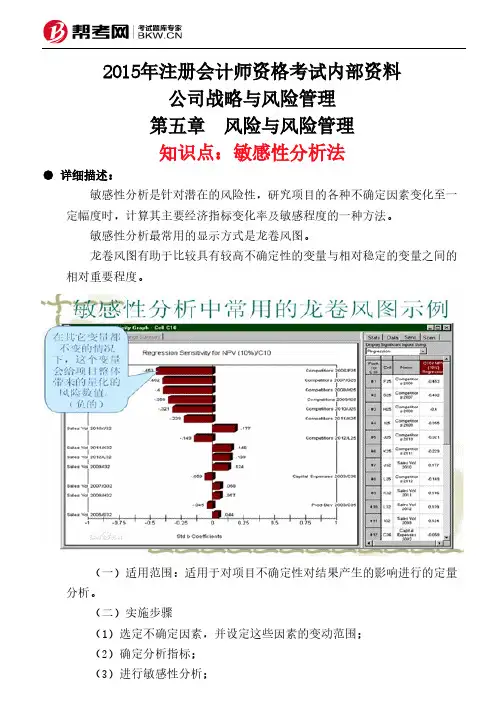
2015年注册会计师资格考试内部资料公司战略与风险管理第五章 风险与风险管理知识点:敏感性分析法● 详细描述:敏感性分析是针对潜在的风险性,研究项目的各种不确定因素变化至一定幅度时,计算其主要经济指标变化率及敏感程度的一种方法。
敏感性分析最常用的显示方式是龙卷风图。
龙卷风图有助于比较具有较高不确定性的变量与相对稳定的变量之间的相对重要程度。
(一)适用范围:适用于对项目不确定性对结果产生的影响进行的定量分析。
(二)实施步骤 (1)选定不确定因素,并设定这些因素的变动范围; (2)确定分析指标; (3)进行敏感性分析; (4)绘制敏感性分析图; (5)确定变化的临界点。
【例】某企业打算在A市兴建一座大桥,但这个项目的不确定性因素很多,如项目总投资、银行贷款利率、过桥费收入。
【分析】以下因素变化的可能性较大: 工程设计变更、不可抗力、材料价格上涨,从而导致项目的投资增加; 银行贷款利率也会在一定范围内变化,因而会较大地影响本工程贷款金额;能否取得优惠贷款,这对资金成本影响很大,进而对工程经济指标也产生影响; 根据A市物价局的规定,本大桥开始收费后每三年需要重新报批收费标准,并且过桥车辆数量也会发生增减变化,这些都会导致过桥费收入的变化。
(三)主要优点和局限性 【主要优点】 为决策者提供有价值的参考信息; 可以清晰地为风险分析指明方向; 可以帮助企业制定紧急预案。
【局限性】 主要包括分析所需要的数据经常缺乏,无法提供可靠的参数变化; 分析时借助公式计算,没有考虑各种不确定因素在未来发生变动的概率,无法给出各参数的变化情况,因此其分析结果可能和实际相反。
例题:1.甲公司是一家化纤企业,近期准备新建一生产线项目,考虑项目实施过程中一些不确定性因素的变化,该公司分别将固定资产投资、经营成本、销售收入这三个因素作为分析对象,分析每一个因素的变化对该项目内部收益率的影响。
根据以上信息可以判断,该投资方采取的分析方法是()。
马尔科夫链是一种描述随机过程的数学工具,它可以用来对环境风险进行评估。
环境风险评估是指对环境状况、自然资源和生态系统的可能影响进行分析和评估的过程。
马尔科夫链可以帮助我们预测未来的环境风险,并制定相应的应对措施。
本文将介绍马尔科夫链的基本原理,并探讨其在环境风险评估中的应用。
马尔科夫链是一个数学模型,描述的是一系列状态之间的转移和概率。
它的基本原理是假设一个系统在某一时刻的状态只依赖于前一时刻的状态,与更早的状态无关。
这种假设称为马尔科夫性质。
马尔科夫链可以用一个状态转移矩阵来描述,矩阵的每个元素表示从一个状态转移到另一个状态的概率。
在环境风险评估中,我们可以将环境状况的不同状态看作马尔科夫链中的状态,而环境的演变过程可以看作状态之间的转移。
通过构建环境状态转移矩阵,我们可以利用马尔科夫链来评估环境风险。
首先,我们需要确定环境的各种可能状态,并对状态之间的转移概率进行估计。
然后,利用马尔科夫链的稳态分布理论,我们可以预测未来环境状态的概率分布,从而评估环境风险的可能性和程度。
马尔科夫链在环境风险评估中的应用可以帮助我们更好地理解环境的演变规律和风险变化趋势。
通过对环境状态转移的概率进行建模和分析,我们可以识别环境风险的关键因素和演变规律,为环境保护和风险管理提供科学依据。
此外,马尔科夫链还可以用于对不同环境管理措施的效果进行评估,从而指导环境政策和管理实践。
然而,马尔科夫链模型也存在一些局限性。
首先,它假设系统的状态转移只受到前一时刻的状态影响,忽略了更早时刻的状态信息。
这种假设在某些环境系统中可能不成立,导致模型预测的不准确性。
其次,马尔科夫链假设状态之间的转移概率是固定的,不受外部因素的影响。
然而,在实际环境中,各种外部因素对状态转移概率的影响往往是动态变化的,这也会影响模型的准确性。
因此,在应用马尔科夫链进行环境风险评估时,我们需要充分考虑模型的局限性,并结合实际情况进行合理的修正和调整。
马尔可夫分析法(markov analysis)又称为马尔可夫转移矩阵法,是指在马尔可夫过程的假设前提下,通过分析随机变量的现时变化情况来预测这些变量未来变化情况的一种预测方法。
马尔可夫分析起源于俄国数学家安德烈·马尔可夫对成链的试验序列的研究。
1907年马尔可夫发现某些随机事件的第N次试验结果常决定于它的前一次(N-1次)试验结果,马尔可夫假定各次转移过程中的转移概率无后效性,用以对物理学中的布朗运动作出数学描述;1923年由美国数学家诺伯特·维纳提出连续轨道的马尔可夫过程的严格数学结构;30-40年代由柯尔莫戈罗夫、费勒、德布林、莱维和杜布等人建立了马尔可夫过程的一般理论,并把时间序列转移概率的链式称为马尔可夫链。
马尔可夫分析法已成为市场预测的有效工具,用来预测顾客的购买行为和商品的市场占有率等,同时也应用在企业的人力资源管理上。
基本涵义单个生产厂家的产品在同类商品总额中所占的比率,称为该厂产品的市场占有率。
在激烈的竞争中,市场占有率随产品的质量、消费者的偏好以及企业的促销作用等因素而发生变化,企业在对产品种类与经营方向做出决策时,需要预测各种商品之间不断转移的市场占有率。
市场占有率的预测可采用马尔可夫分析法,也就是运用转移概率矩阵对市场占有率进行市场趋势分析的方法。
俄国数学家马尔可夫在20世纪初发现:一个系统的某些因素在转移中,第N次结果只受第N-1次结果影响,只与当前所处状态有关,与其他无关。
例如:研究一个商店的累计销售额,如果现在时刻的累计销售额已知,则未来某一时刻的累计销售额与现在时刻以前的任一时刻的累计销售额都无关。
在马尔可夫分析中,引入状态转移这个概念。
所谓状态是指客观事物可能出现或存在的状态;状态转移是指客观事物由一种状态转移到另一种状态的概率。
马尔可夫分析法的一般步骤为:1、调查目前的市场占有率情况;2、调查消费者购买产品时的变动情况;3、建立数学模型;4、预测未来市场的占有率。
2015年注册会计师资格考试内部资料公司战略与风险管理第五章 风险与风险管理知识点:风险度量风险管理的有效性标准● 详细描述:(一)风险度量1.关键在于量化。
风险偏好可以定性,但风险承受度一定要定量。
2.风险度量。
指度量风险的方法。
企业应该采取统一制定的风险度量模型,对所采取的风险度量取得共识; 不一定在整个企业使用唯一的风险度量,允许对不同的风险采取不同的度量方法。
所有的风险度量应当在企业层面的风险管理策略中得到评价。
3.风险度量方法。
【在险值】又称VAR(Value at Risk),是指在正常的市场条件下,在给定的时间段中,给定的置信区间内,预期可能发生的最大损失。
(99%,10万美元) 【优点】在险值具有通用、直观、灵活的特点。
为《巴塞尔协议》采用。
【局限性】适用的风险范围小,对数据要求严格,计算困难,对肥尾效应无能为力。
(二)风险管理的有效性标准风险管理有效性标准的作用是帮助企业了解: 企业现在的风险是否在风险承受度范围之内—— 风险是否优化 企业风险状况的变化是否是所要求的—— 风险的变化是否优化 量化的企业风险管理的有效性标准与企业风险承受度有相同的度量基础。
风险管理有效性标准的原则如下: (1)风险管理的有效性标准要针对企业的重大风险,能够反映企业重大风险管理的现状; (2)风险管理有效性标准应当对照全面风险管理的总体目标,在所有五个方面保证企业的运营效果; (3)风险管理有效性标准应当在企业的风险评估中应用,并根据风险的变化随时调整; (4)风险管理有效性标准应当用于衡量全面风险管理体系的运行效果。
例题:1.下面几种VaR计算方法中,无需假设货币收益呈正态分布,而是曲线形,不足之处是这种方法需要一个大型数据库,而且计算量大。
该方法是()。
A.历史模拟法B.方差-协方差法C.蒙特卡罗模拟法D.净现值法正确答案:A解析:历史模拟法的优点是它并非假设货币收益呈正态分布,而明确记录了这些收益不是正态分布的,而是曲线形。
风险分析与风险管理1定义和术语风险分析是一个正在发展中的理论体系,因此有关术语及其定义也在不断地修改和完善之中。
危害(hazard):设备可能导致不良经济、质量、环境与安全不良效果的化学、或者物理因素或状态。
风险(risk):一种不良效果的可能性以及这种效果严重程度的函数,这种效果是由设备的危害所引起的。
一般,风险定义为事故概率和事故后果的乘积。
风险分析(riskanalysis):包含三个部分的一个过程,即:风险评估、风险管理和风险情况交流。
风险评估(riskassessment):一个建立在科学基础上的包含下列步骤的过程:(ⅰ)危害识别,(ⅱ)危害描述,(ⅲ)暴露评估,以及(ⅳ)风险描述。
危害识别(hazardidentification):识别可能产生设备不良效果并且可能存在于某种或某类设备中的化学和物理因素。
危害描述(hazardcharacterization):对与设备中可能存在的化学和物理因素有关的不良效果的性质的定性和/或定量评价。
风险描述(riskcharacterization):根据危害识别、危害描述对经济、质量、环境与安全不良效果的发生可能性和严重程度进行定性和/或定量的估计,其中包括伴随的不确定性。
风险管理(riskmanagement):根据风险评估的结果,对备选策略进行权衡,并且在需要时选择和实施适当的控制选择、包括规章管理措施的过程。
风险情况交流(riskcommunication):在风险评估人员、风险管理人员、设备使用者、检查与维修人员和其他有关的团体之间就与风险有关的信息和意见进行相互交流。
2风险分析与风险管理的基本内容1、风险评估风险评估的过程可以分为四个明显不同的阶段:危害识别,危害描述,概率评估以及风险描述。
危害识别采用的是定性方法,其余三步可以采用定性方法,但最好采用定量方法。
风险评估是一种系统地组织科学技术信息及其不确定度的方法,用以回答有关设备风险的特定问题。
2015年注册会计师资格考试内部资料
公司战略与风险管理
第五章 风险与风险管理
知识点:马尔科夫分析法(MARKOVANALYSIS)● 详细描述:
通常用于对那些存在多种状态(包括各种降级使用状态)的可维修复杂系统进行分析。
(一)适用范围
适用于对复杂系统中不确定性事件及其状态改变的定量分析。
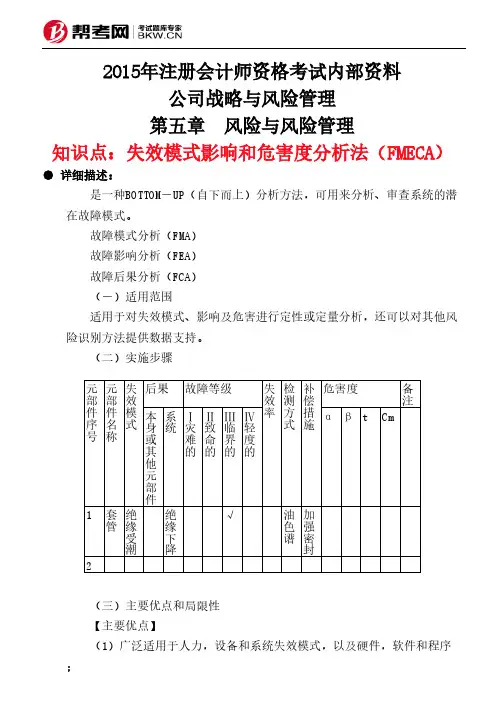
(二)实施步骤
【案例】
分析一种仅存在三种状态的复杂系统。
功能 —— 状态S1
降级 —— 状态S2
故障 —— 状态S3
每天,系统都会存在于这三种状态中的某一种。
马尔科夫矩阵说明了系统明天处于状态Si的概率
(i可以是1、2或3)
表5-13 马尔科夫矩阵
Pi表示系统处于状态i (i可以是1、2或3)的概率: P1=0.95P1+0.30P2+0.20P3 (1)
P2=0.04P1+0.65P2+0.60P3 (2)
P3=0.01P1+0.05P2+0.20P3 (3) 这三个方程并非独立的,无法解出三个未知数。
因此,下列方程必须使
今天状态S1(功能)S2(降级)S3(故障)明天状态S1(P1)
0.950.30.2S2(P2)
0.040.650.6S3(P3)0.010.050.2
用,而上述方程中有一个方程可以弃用。
1=P1+P2+P3 (4)
解联立方程组,得到:
状态1的概率P1=0.85
状态2的概率P2=0.13
状态3的概率P3=0.02
(三)主要优点和局限性
【主要优点】能够计算出具有维修能力和多重降级状态的系统的概率。
【局限性】
(1)无论是故障还是维修,都假设状态变化的概率是固定的;
(2)所有事项在统计上具有独立性,因此未来的状态独立于一切过去的状态,除非两个状态紧密相连;
(3)需要了解状态变化的各种概率;
(4)有关矩阵运算的知识比较复杂,非专业人士很难看懂。
例题:。