斯托克、沃森着《计量经济学》第九章
- 格式:pdf
- 大小:283.99 KB
- 文档页数:44


计量经济学斯托克沃森第三版答案1、盈余公积是企业从()中提取的公积金。
[单选题] *A.税后净利润(正确答案)B.营业利润C.利润总额D.税前利润2、企业在转销已经确认无法支付的应付账款时,应贷记的会计科目是()。
[单选题] *A.其他业务收入B.营业外收入(正确答案)C.盈余公积D.资本公积3、企业因解除与职工的劳动关系给予职工补偿而发生的职工薪酬,应借记的会计科目是()。
[单选题] *A.管理费用(正确答案)B.计入存货成本或劳务成本C.营业外支出D.计入销售费用4、由投资者投资转入的无形资产,应按合同或协议约定的价值,借记“无形资产”科目,按其在注册资本所占的份额,贷记“实收资本”科目,按其差额记入()科目。
[单选题] *A.“资本公积—资本溢价”(正确答案)B.“营业外收入”C.“资本公积—其它资本公积”D.“营业外支出”5、下列各项,不影响企业营业利润的项目是()。
[单选题] *A.主营业务收入B.其他收益C.资产处置损益D.营业外收入(正确答案)6、2018年12月31日,甲公司某项固定资产计提减值准备前的账面价值为1 000万元,公允价值为980万元,预计处置费用为80万元,预计未来现金流量的现值为1 050万元。
2018年12月31日,甲公司应对该项固定资产计提的减值准备为()万元。
[单选题] *A.0(正确答案)B.20C.50D.1007、.(年浙江省高职考)下列各项中,属于会计对经济活动进行事中核算的主要形式的是()[单选题] *A预测B决策C计划D控制(正确答案)8、专利权有法定有效期限,一般发明专利的有效期限为()。
[单选题] *A.5年B.10年C.15年D.20年(正确答案)9、.(年预测)下列属于货币资金转换为生产资金的经济活动的是()[单选题] *A购买原材料B生产领用原材料C支付工资费用(正确答案)D销售产品10、.(年浙江省第一次联考)下列各项中,不属于会计核算的前提条件的是()[单选题] *A持续经营B货币计量C权责发生制(正确答案)D会计主体11、下列各项税金中不影响企业损益的是()。

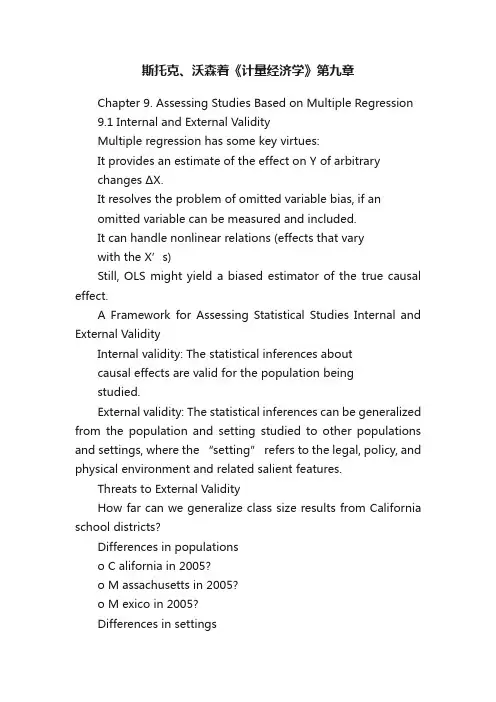
斯托克、沃森着《计量经济学》第九章Chapter 9. Assessing Studies Based on Multiple Regression9.1 Internal and External ValidityMultiple regression has some key virtues:It provides an estimate of the effect on Y of arbitrarychanges ΔX.It resolves the problem of omitted variable bias, if anomitted variable can be measured and included.It can handle nonlinear relations (effects that varywith the X’s)Still, OLS might yield a biased estimator of the true causal effect.A Framework for Assessing Statistical Studies Internal and External ValidityInternal validity: The statistical inferences aboutcausal effects are valid for the population beingstudied.External validity: The statistical inferences can be generalized from the population and setting studied to other populations and settings, where the “setting” refers to the legal, policy, and physical environment and related salient features.Threats to External ValidityHow far can we generalize class size results from California school districts?Differences in populationso C alifornia in 2005?o M assachusetts in 2005?o M exico in 2005?Differences in settingso Different legal requirements concerning specialeducationo Different treatment of bilingual educationo Differences in teacher characteristics9.2 Threats to Internal Validity of Multiple Regression AnalysisInternal validity: The statistical inferences about causal effects are valid for the population being studied.Five threats to the internal validity of regression studies:1.Omitted variable bias2.Wrong functional form3.Errors-in-variables bias4.Sample selection bias5.Simultaneous causality biasAll of these imply that E(u i |X1i, …, X ki) ≠ 0.1. Omitted variable biasArises if an omitted variable both (i) is a determinant of Y and (ii) is correlated with at least one included regressor.Potential solutions to omitted variable biasIf the variable can be measured, include it as aregressor in multiple regression;Possibly, use panel data in which each entity(individual) is observed more than once;If the variable cannot be measured, use instrumentalvariables regression;Run a randomized controlled experiment.2. Wrong functional formArises if the functional form is incorrect –for example, an interaction term is incorrectly omitted; then inferences on causal effects will be biased.Potential solutions to functional form misspecification ?Continuous dependent variable: Use the “appropriate” nonlinear specifications in X(logarithms, interactions, etc.)Discrete (example: binary) dependent variable:Need an extension of multiple regression methods(“probit” or “logit” analysis for binary dependentvariables).3. Errors-in-variables biasSo far we have assumed that X is measured without error. In reality, economic data often have measurement error ?Data entry errors in administrative dataRecollection(记忆)errors in surveys (when did you start your current job?)Ambiguous questions problems (what was yourincome last year?)Intentionally false response(故意假报)problems with surveys (What is the current value of your financialassets? How often do you drink and drive?)In general, measurement error in a regressor results in “errors-in-variables” bias.Illustration : SupposeY i = β0 + β1X i + u iis “correct” in the sense that the three least squares assumptions hold (in particular E (u i | X i ) = 0).LetX i = unmeasured true value of XiX = imprecisely measured version of XThenY i = β0 + β1X i + u i = β0 + β1i X + [β1(X i –i X ) + u i ]orY i = β0 + β1i X +i u , where i u = β1(X i –i X ) + u iIf i X is correlated with i u , then 1?β will be biased:cov(i X ,i u ) = cov(i X , β1(X i –i X ) + u i )= β1cov(i X , X i –i X ) + cov(i X , u i ) = β1[cov(i X , X i ) – var(i X )] + 0 ≠ 0because in general cov(i X , X i ) ≠ var(i X ).Y i = β0 + β1i X +i u , where i u = β1(X i –i X ) + u iIf X i is measured with error, iX is in general correlated with i u , so 1β is biased and inconsistent.It is possible to derive formulas for this bias, but they require making specific mathematical assumptions about the measurement error process (for example,that i u and X i are uncorrelated). Those formulas arespecial and particular, but the observation thatmeasurement error in X results in bias is general.Potential solutions to errors-in-variables biasObtain better data.Develop a specific model of the measurement error process.This is only possible if a lot is known about thenature of the measurement error – for example asubsample of the data are cross-checked usingadministrative records and the discrepancies areanalyzed and modeled. (Very specialized; we won’t pursue this here.)Instrumental variables regression.4. Sample selection biasSo far we have assumed simple random sampling of thepopulation. In some cases, simple random sampling is thwarted because the sample, in effect, “selects itself.”Sample selection bias arises when a selection process (i) influences the availability of data and (ii) that process is related to the dependent variable.Example #1: Mutual fundsDo actively managed mutual funds outperform“hold-the-market” funds?Empirical strategy:o Sampling scheme: Simple random sampling of mutual funds available to the public on a givendate.o Data: Returns for the preceding 10 years.o Estimator: Average ten-year return of the sample mutual funds, minus ten-year return on S&P500 o Is there sample selection bias?Sample selection bias induces correlation between a regressor and the error term.Mutual fund example:return i = β0 + β1managed_fund i + u iBeing a managed fund in the sample (managed_fund i = 1) means that your return was better than failed managed funds, which are not in the sample –so corr(managed_fund i, u i) ≠ 0.Example #2: Returns to educationWhat is the return to an additional year of education? ?Empirical strategy:o S ampling scheme: Simple random sampling ofworkerso D ata: Earnings and years of educationo E stimator: regress ln(earnings) on years_education o Ignore issues of omitted variable bias andmeasurement error – is there sample selectionbias?Potential solutions to sample selection biasCollect the sample in a way that avoids sample selection.o M utual funds example: Change the samplepopulation from those available at the end of theten-year period, to those available at thebeginning of the period (include failed funds)o R eturns to education example: Sample collegegraduates, not workers (include the unemployed) ?Randomized controlled experiment.Construct a model of the sample selection problem and estimate that model (we won’t do this).5. Simultaneous Causality BiasSo far we have assumed that X causes Y.What if Y causes X, too?Example: Class size effectLow STR results in better test scores。
第八章一、名词解释1、虚拟变量:在建立模型时,有一些影响经济变量的因素无法定量描述,如职业、性别对收入的影响,教育程度,季节因素等往往需要用定性变量度量。
为了在模型中反映这类因素的影响,并提高模型的精度,需要将这类变量“量化”。
根据这类边另的属性类型,构造仅取“0”或“1”的人工变量,通常称这类变量为“虚拟变量”2、虚拟变量陷阱:一般在引入虚拟变量时要求如果有m个定性变量,字在模型中引入m-1个虚拟变量。
否则,如果引入m个虚拟变量,就会导致模型解释变量间出现完全共线性的情况。
我们一般称由于引入虚拟变量个数与定性因素个数相同出现的模型无法估计的问题,称为“虚拟变量陷阱”二、单项选择题1、B:“地区”一个,“季节”三个2、A:将D=1代入估计后的方程即可3、D:“季节”包含4个类型,只能用3个虚拟变量,用4个虚拟变量会出现完全多重共线的问题,参数将无法估计4、C:“地区”只有两个类别,引入两个虚拟变量会出现完全多重共线问题5、A:1α体现了城镇和农村截距上的差异,1β体现了城镇和农村斜率上的差异,当它们为0时,表示无差异6、A:斜率相同,仅截距不同7、D:此问题表现为1000前后斜率的变化,B表示截距的变化,不合适;C在D=0时没有解释变量,不正确;A和D相比,D更合适,A会造成曲线在临界值出断开,但D会保证曲线的连贯的。
8、A:虚拟变量表示性别、季节等时,只表示属性的不同,没有等级之分,作为质的因素;表示收入高低时,高与低是有级别的,属于有序数据,可以表示数量的因素。
9、A/B:这题比较牵强,按书上原话应该选择B;但当用加法引入虚拟变量时,会存在问题。
【当用加法形式引入虚拟变量时,用一个虚拟变量作为截距项,取值全部为1;其他m-1个表示该因素的前三个类型。
如果不引入截距项,当虚拟变量都取0时不能解释该因素第四个类型的作用。
】10、D :概念性三、多项选择题1、B C D :A 太绝对,也可以表示数量因素;E 太绝对2、ABCDE :A 加法方式;B 乘法方式;C 临界指标的虚拟变量;D 在ABC 基础上可构造分段回归3、AB :C 当虚拟变量取0或2时,过程一样,但参数的意义稍作调整;D 见书P207倒数第二段。
计量经济学斯托克答案【篇一:计量经济学教材推荐】txt>【计量经济学的内容体系】古扎拉蒂《计量经济学基础》白砂堤津耶《通过例题学习计量经济学》伍德里奇《计量经济学导论:现代观点》斯托克、沃森《计量经济学导论》林文夫(fumio hayashi)《计量经济学》雨宫健(takeshi amemiya )《高级计量经济学》李子奈、潘文卿编著《计量经济学》【计量经济学的内容体系】狭义的计量经济学以揭示经济现象中的因果关系为目的,主要应用回归分析方法。
广义的计量经济学是利用经济理论、统计学和数学定量研究经济现象的经济计量方法,除了回归分析方法,还包括投入产出分析法、时间序列分析方法等。
把计量经济学分为初级、中级、高级三个层次,初级计量经济学一般包括计量经济学所必须的基础数理统计只是和矩阵代数只是、经典的线性计量经济学模型理论与方法(以单一方程模型为主)、单方程模型的应用等内容;中级计量经济学以经典的线性计量经济学模型理论与方法及其应用为主要内容,包括单一方程模型和联立方程模型。
在应用方面,主要讨论计量经济学模型在生产、需求、消费、投资、货币需求和宏观经济系统等传统领域的应用,注重于应用过程中实际问题的处理。
在描述方法上普遍运用矩阵描述;高级计量经济学以扩展的线性模型理论与方法、非线性模型理论与方法和动态模型理论与方法,以及它们的应用为主要内容。
从研究对象和侧重点的角度讲,理论计量经济学侧重于理论与方法的数学证明与推导,与数理统计联系极为密切;应用计量经济学则以建立与应用计量经济学模型为主要内容,强调应用模型的经济学和统计学基础,侧重于建立与应用模型过程中实际问题的处理。
纵观计量经济学发展史,20世纪70年代之前发展并广泛应用的计量经济学称为经典计量经济学,其理论特征是:以经济理论为导向建立因果分析的随机模型,模型具有明确的形式和参数,模型变量之间的关系多表现为线性关系,或者可以化为线性关系,以时间序列数据或者截面数据为样本,采用最小二乘方法或者极大似然方法估计模型。


《计量经济学》第9章数据《计量经济学》各章数据第9章时间序列分析例9.2.1检验中国1978-2003年间支出法GDP时间序列(表9.2.1)的平稳性。
表9.2.1 1978-2003年中国GDP(单位:亿元)年份GDP(亿元)1978 3624.11979 4038.21980 4517.81981 4862.41982 5294.71983 5934.51984 7171.01985 8964.41986 10202.21987 11962.51988 14928.31989 16909.21990 18547.91991 21617.81992 26638.11993 34634.41994 46759.41995 58478.11996 67884.61997 74462.61998 78345.21999 82067.52000 89468.12001 97314.82002 105172.32003 117251.9例9.3.1 根据表9.3.1给出的样本调查数据,建立AR(p)模型。
表9.3.1 样本数据日期t 样本y 日期t 样本y1 -0.058 13 0.0682 0.058 14 0.5953 0.729 15 -0.2174 0.280 16 -1.0235 1.027 17 -0.2266 0.670 18 -0.2617 0.559 19 0.3788 -0.482 20 -0.1289 -1.462 21 -1.00310 -2.039 22 1.19711 -1.306 23 2.06412 0.037例9.4.2检验中国城镇居民人均消费性支出与人均可支配收入(见表9.3.3与图9.4.1)时间序列的协整关系。
表9.4.2 中国城镇居民人均收入、人均消费(单位:元)年份人均可支配收入PI人均消费性支出PC年份人均可支配收入PI人均消费性支出PC1978 343.4 311.16 1991 1700.6 1453.81 1979 405.0 361.80 1992 2026.6 1671.73 1980 477.6 412.44 1993 2577.4 2110.81 1981 500.4 456.84 1994 3496.2 2851.34 1982 535.3 471.00 1995 4283.0 3537.57 1983 564.6 505.92 1996 4838.9 3919.47 1984 652.1 559.44 1997 5160.3 4185.64 1985 739.1 673.20 1998 5425.1 4331.61 1986 900.1 798.96 1999 5854.0 4615.91 1987 1002.1 884.40 2000 6280.0 4998.00 1988 1180.2 1103.98 2001 6895.6 5309.01 1989 1373.9 1210.95 2002 7702.8 6029.88 1990 1510.2 1278.89 2003 8472.0 6510.94例9.5.1表9.5.1给出了我国1978-2000年按当年价格计算的GDP 与居民消费CS数据,试检验GDP与CS是否存在因果关系。
第八章虚拟变量模型1. 回归模型中引入虚拟变量的作用是什么?答:在模型中引入虚拟变量,主要是为了寻找某(些)定性因素对解释变量的影响。
加法方式与乘法方式是最主要的引入方式,前者主要适用于定性因素对截距项产生影响的情况,后者主要适用于定性因素对斜率项产生影响的情况。
除此外,还可以加法与乘法组合的方式引入虚拟变量,这时可测度定性因素对截距项与斜率项同时产生影响的情况。
2. 虚拟变量有哪几种基本的引入方式? 它们各适用于什么情况?答:在模型中引入虚拟变量的主要方式有加法方式与乘法方式,前者主要适用于定性因素对截距项产生影响的情况,后者主要适用于定性因素对斜率项产生影响的情况。
除此外,还可以加法与乘法组合的方式引入虚拟变量,这时可测度定性因素对截距项与斜率项同时产生影响的情况。
3.什么是虚拟变量陷阱?答:根据虚拟变量的设置原则,一般情况下,如果定性变量有m个类别,则需在模型中引入m-1个变量。
如果引入了m个变量,就会导致模型解释变量出现完全的共线性问题,从而导致模型无法估计。
这种由于引入虚拟变量个数与类别个数相等导致的模型无法估计的问题,称为“虚拟变量陷阱”。
4.在一项对北京某大学学生月消费支出的研究中,认为学生的消费支出除受其家庭的每月收入水平外,还受在学校中是否得到奖学金,来自农村还是城市,是经济发达地区还是欠发达地区,以及性别等因素的影响。
试设定适当的模型,并导出如下情形下学生消费支出的平均水平:(1) 来自欠发达农村地区的女生,未得到奖学金;(2) 来自欠发达城市地区的男生,得到奖学金;(3) 来自发达地区的农村女生,得到奖学金;(4) 来自发达地区的城市男生,未得到奖学金。
解答: 记学生月消费支出为Y,其家庭月收入水平为X,则在不考虑其他因素的影响时,有如下基本回归模型:Y i=β0+β1X i+μi其他定性因素可用如下虚拟变量表示:有奖学金无奖学金来自发达地区男性来自欠发达地区女性则引入各虚拟变量后的回归模型如下:Y i=β0+β1X i+α1D1i+α2D2i+α3D3i+α4D4i+μi由此回归模型,可得如下各种情形下学生的平均消费支出:(1) 来自欠发达农村地区的女生,未得到奖学金时的月消费支出:E(Y i|= X i, D1i=D2i=D3i=D4i=0)=β0+β1X i(2) 来自欠发达城市地区的男生,得到奖学金时的月消费支出:E(Y i|= X i, D1i=D4i=1,D2i=D3i=0)=(β0+α1+α4)+β1X i(3) 来自发达地区的农村女生,得到奖学金时的月消费支出:E(Y i|= X i, D1i=D3i=1,D2i=D4i=0)=(β0+α1+α3)+β1X i(4) 来自发达地区的城市男生,未得到奖学金时的月消费支出:E(Y i|= X i,D2i=D3i=D4i=1, D1i=0)= (β0+α2+α3+α4)+β1X i5. 研究进口消费品的数量Y 与国民收入X 的模型关系时,由数据散点图显示1979年前后Y 对X 的回归关系明显不同,进口消费函数发生了结构性变化:基本消费部分下降了,而边际消费倾向变大了。
YY Y Y YYY Y Y E Y d F Fq Y E Y E Yi i u X YE Y E Y W X V Y E VE Y E Y E WE X E X W X VY X Y WV X Y XYW V W VX Y Y X Y X Y X Y X X Y X Y CM F C M F C M F M FC M F M F M F M F M F M F C M F M FC C e e e eC e CX X Y E YE YYE Y E YIntroduction to Econometrics,Y XYE Y XE Y XYY XE XYX Y E XY E X E YX Y X YX YY Y FY Z Z N Y ZE Y Y E W WY WY WE Y YY YWX S WE S X E S X E S X E S XE S X E S X E S X E S XE S E S X E S X XE S E S X E S X XE S E S X E S X XE S E S X E S X XS E S S E SE S S S E S E S S E S E SZNn Zn ZnZnY YP YP YZ nnIntroduction to Econometrics,l j i j ilj i ii Y y X x Y y Y y X x X x i i i k k lj j j j i i jj i k lj j i j il i E Y y Y y y Y y X x X x y Y y X x X x E Y X x X x X Yi j i jX x Y y X x Yy XY l k i j ij lk i j i j E XX x Y y x X x Yy l kiX i j Y j i j X Y x X x y Y y E X XE X E XE X X X X X E XE X E X E X E X E X E X E X E X E XE X E X EX E X E XX X E XX X X X X E XE X E X E X E XE X E X E X E X E X E X E X E X E XX Z X Z X Z XZ X Z Z z X x Z z E Z XE Z E Y X E X Z X E X X E Z X X X X X E XY Z E X Z E X E XYE X ZX E X E ZX E X X Z ZX E ZX E XY E X E ZXX Y X YXY E X E X E XY X E XYE X X Y n n i n n i i i ax ax ax ax ax a x x x x a x n i i n n i nn n n i i ii x y xy x y x y x x x y y y x y nia a a aa na n n i i i i ii i i i i n n n n n i i i i i ii i i i i a bx cy a b x c y abx acy bcx y na b x c y abx ac y bc x y E W E E W Z E E X X Z E E X ZE X Z E WZ E E WZ Z E ZE W Z E ZV W h Z E VE W E h Z E W h Z E W h ZE V E W E h Z E h Z h zznY N Yn YYn Ynn Ynn YnY Y YY Y p Y p Y p p ppptacttnp H p H pactp tp H p H pactp tpt ptH p H pp tppp pppp pIntroduction to Econometrics,t ttp nn pp p p p pnpp tt p p p n pn p t-ppY YY nYYYYH HYYtactacttYn Y nn YE YYnYYs YYYYnsnYsYYIntroduction to Econometrics,H H tactY Ytpact p tpY YapaYbp bYYap a p aYbp b p bapbpapbpapbpa bp papbpapbpapbpYpm mYYwwY Yi Y Y i j YE Y E Y Y i ji j YY YYY Y nYYnn m n wnm wY YwSE YTestScoreTestScoreTestScore CSSSRn SER RTSSY s nYs AgeAWEAWESER Y AWE SERRX Y X AWEu iu iX iu iE u iuX E u i X i E uiYi XiiE EXE u E u iE XE EXXEYiY Y RRiY Y iiiYX iY Y iX iiX iin iiX n i iiY b X bib X niiX n iiXIntroduction to Econometrics,X i X u i ii iX i X u itacttp H Hactp tptacttp H Hactp tpt act t pt p pIntroduction to Econometrics,Y Xn nY Y Y X Y Y Y nE Y i XX nX inXmY w m YY mY mwmwmwmmwwmwmw。
Chapter 9. Assessing Studies Based on Multiple Regression9.1 Internal and External ValidityMultiple regression has some key virtues:•It provides an estimate of the effect on Y of arbitrarychanges ΔX.•It resolves the problem of omitted variable bias, if anomitted variable can be measured and included.•It can handle nonlinear relations (effects that varywith the X’s)Still, OLS might yield a biased estimator of the true causal effect.A Framework for Assessing Statistical Studies Internal and External Validity•Internal validity: The statistical inferences aboutcausal effects are valid for the population beingstudied.•External validity: The statistical inferences can be generalized from the population and setting studied to other populations and settings, where the “setting” refers to the legal, policy, and physical environment and related salient features.Threats to External ValidityHow far can we generalize class size results from California school districts?•Differences in populationso C alifornia in 2005?o M assachusetts in 2005?o M exico in 2005?•Differences in settingso Different legal requirements concerning specialeducationo Different treatment of bilingual educationo Differences in teacher characteristics9.2 Threats to Internal Validity of Multiple Regression AnalysisInternal validity: The statistical inferences about causal effects are valid for the population being studied.Five threats to the internal validity of regression studies:1.Omitted variable bias2.Wrong functional form3.Errors-in-variables bias4.Sample selection bias5.Simultaneous causality biasAll of these imply that E(u i |X1i, …, X ki) ≠ 0.1. Omitted variable biasArises if an omitted variable both (i) is a determinant of Y and (ii) is correlated with at least one included regressor.Potential solutions to omitted variable bias•If the variable can be measured, include it as aregressor in multiple regression;•Possibly, use panel data in which each entity(individual) is observed more than once;•If the variable cannot be measured, use instrumentalvariables regression;•Run a randomized controlled experiment.2. Wrong functional formArises if the functional form is incorrect – for example, an interaction term is incorrectly omitted; then inferences on causal effects will be biased.Potential solutions to functional form misspecification •Continuous dependent variable: Use the“appropriate” nonlinear specifications in X(logarithms, interactions, etc.)•Discrete (example: binary) dependent variable:Need an extension of multiple regression methods(“probit” or “logit” analysis for binary dependentvariables).3. Errors-in-variables biasSo far we have assumed that X is measured without error. In reality, economic data often have measurement error •Data entry errors in administrative data•Recollection(记忆)errors in surveys (when did you start your current job?)•Ambiguous questions problems (what was yourincome last year?)•Intentionally false response(故意假报)problems with surveys (What is the current value of your financialassets? How often do you drink and drive?)In general, measurement error in a regressor results in “errors-in-variables” bias.Illustration : SupposeY i = β0 + β1X i + u iis “correct” in the sense that the three least squares assumptions hold (in particular E (u i | X i ) = 0).LetX i = unmeasured true value of XiX = imprecisely measured version of XThenY i = β0 + β1X i + u i = β0 + β1i X + [β1(X i –i X ) + u i ]orY i = β0 + β1i X +i u , where i u = β1(X i –i X ) + u iIf i X is correlated with i u , then 1ˆβ will be biased: cov(i X ,i u ) = cov(i X , β1(X i –iX ) + u i ) = β1cov(i X , X i – i X ) + cov(iX , u i ) = β1[cov(i X , X i ) – var(iX )] + 0 ≠ 0because in general cov(i X , X i ) ≠ var(iX ).Y i = β0 + β1i X +i u , where i u = β1(X i –i X ) + u i• If X i is measured with error, iX is in general correlated with i u , so 1ˆβ is biased and inconsistent.• It is possible to derive formulas for this bias, but theyrequire making specific mathematical assumptions about the measurement error process (for example,that i u and X i are uncorrelated). Those formulas are special and particular, but the observation that measurement error in X results in bias is general.Potential solutions to errors-in-variables bias•Obtain better data.•Develop a specific model of the measurement error process.•This is only possible if a lot is known about thenature of the measurement error – for example asubsample of the data are cross-checked usingadministrative records and the discrepancies areanalyzed and modeled. (Very specialized; we won’t pursue this here.)•Instrumental variables regression.4. Sample selection biasSo far we have assumed simple random sampling of the population. In some cases, simple random sampling is thwarted because the sample, in effect, “selects itself.”Sample selection bias arises when a selection process (i) influences the availability of data and (ii) that process is related to the dependent variable.Example #1: Mutual funds•Do actively managed mutual funds outperform“hold-the-market” funds?•Empirical strategy:o Sampling scheme: Simple random sampling of mutual funds available to the public on a givendate.o Data: Returns for the preceding 10 years.o Estimator: Average ten-year return of the sample mutual funds, minus ten-year return on S&P500 o Is there sample selection bias?Sample selection bias induces correlation between a regressor and the error term.Mutual fund example:return i = β0 + β1managed_fund i + u iBeing a managed fund in the sample (managed_fund i = 1) means that your return was better than failed managed funds, which are not in the sample – so corr(managed_fund i, u i) ≠ 0.Example #2: Returns to education•What is the return to an additional year of education? •Empirical strategy:o S ampling scheme: Simple random sampling ofworkerso D ata: Earnings and years of educationo E stimator: regress ln(earnings) on years_education o I gnore issues of omitted variable bias andmeasurement error – is there sample selectionbias?Potential solutions to sample selection bias•Collect the sample in a way that avoids sample selection.o M utual funds example: Change the samplepopulation from those available at the end of theten-year period, to those available at thebeginning of the period (include failed funds)o R eturns to education example: Sample collegegraduates, not workers (include the unemployed) •Randomized controlled experiment.•Construct a model of the sample selection problem and estimate that model (we won’t do this).5. Simultaneous Causality BiasSo far we have assumed that X causes Y.What if Y causes X, too?Example: Class size effect•Low STR results in better test scores•But suppose districts with low test scores are given extra resources: as a result of a political process they also have low STR•What does this mean for a regression of TestScore on STR?Simultaneous causality bias in equations(a) Causal effect of X on Y: Y i = β0 + β1X i + u i(b) Causal effect of Y on X: X i = γ0 + γ1Y i + v i •Large u i means large Y i, which implies large X i (if γ1>0) •Thus corr(X i, u i) ≠ 0ˆβis biased and inconsistent.•Thus1•Example: A district with particularly bad test scores given the STR (negative u i) receives extra resources, thereby lowering its STR; so STR i and u i are correlated.Potential solutions to simultaneous causality bias•Randomized controlled experiment. Because X i ischosen at random by the experimenter, there is nofeedback from the outcome variable to Y i (assuming perfect compliance).•Develop and estimate a complete model of both directions of causality. This is the idea behind many large macro models (e.g. Federal Reserve Bank-US). This is extremely difficult in practice.•Use instrumental variables regression to estimate the causal effect of interest (effect of X on Y, ignoring effect of Y on X).9.3 Internal and External Validity When the Regression Is Used for ForecastingUp to now, we have focused on the estimation of causal effects.But regression models can also be used for forecasting. In this case, concerns about external validity are very important, but concerns about unbiased estimation of causal effects are not.例:“街上行人带伞”可以预测“下雨”,但前者并不构成后者的原因。