企业诊断与咨询工具大全14设备管理组织诊断
- 格式:pptx
- 大小:173.96 KB
- 文档页数:5

试析企业诊断的方法和工具一、企业经营管理诊断又称企业管理咨询(简称企业诊断)。
它是运用一系列分析技术和判断方法对企业经营管理作出的评定和咨询,它是促进企业不断改善经营管理的重要措施,是防止企业衰败的自我治理手段。
企业诊断可以提高企业的科学管理水平,推广现代化管理方法和手段,提高企业素质,从而提高企业的经济效益。
企业诊断可分为:①全局性诊断。
如企业经营状况诊断、企业经营战略诊断、企业未来发展趋势诊断;②单元性诊断。
如企业营销管理诊断、企业生产管理诊断、产品开发设计诊断、企业质量管理诊断、企业财务管理诊断等。
企业诊断的基本过程可分为调查、分析、判断、提出改进意见和指导实施等五个阶段,即从企业的现状出发,分析存在的问题,判断未来的发展趋势,提出相应的整治措施与方案,并指导实施。
二、企业诊断的由来和发展1.企业诊断起源于美国,美国称之为管理咨询。
美国早在十九世纪30年代就开始了管理咨询服务。
当时的欧美企业,往往资产的所有者就是企业的经营者,由于这些人中有些不善于经营,致使企业萧条,甚至濒临倒闭。
为了摆脱困难的处境,往往求助于社会上的技术咨询机构,请这些机构派专家或经营顾问到企业进行诊断。
国外第一代管理咨询顾问于1914年间诞生于美国,早期开拓者:Taylor和Gilberth夫妇等。
1926年芝加哥大学会计系教授Mikinsey创建管理咨询业,管理咨询业在伴随工业化进程中自身得到了蓬勃地发展。
全球500强的企业中有50%的公司拥有长期合作的国际著名咨询公司。
美国AT&T公司有1000多家咨询公司为其进行全方位、多层面咨询,每年投入咨询费用3-5亿美元。
2.最先将“诊断”应用于企业的是日本人。
日本早在20世纪50年代就颁布《中小企业诊断实施基本纲要》。
应该说,“诊断”一词不但适用于具有强制性的管理企业的制度中,而且富有东方文化的色彩。
日本中小企业约占日本企业总数的99%,占企业总人数的70%左右,占全部企业销售额的50%,它们在日本工业中占有相当重要的地位。

4种组织诊断工具组织诊断对HRBP来说,一直就是一个挑战,今天我们就来分享几个组织诊断得实用工具。
一、麦肯锡得7S模型7S模型能够用于分析各种情境下得组织,帮助管理者从提高组织得整体表现、分析组织未来变革可能会造成得影响、在实施并购后更好地融合相关部门与高效地实施目标战略几方面提升组织有效性。
两位斯坦福大学得管理硕士、长期服务于麦肯锡管理顾问公司得学者,Thoma's J、Peter(托马斯·J·彼得斯)与Robert H、Waterman(小罗伯特·H·沃特曼),访问了美国最优秀得62家公司,又以获利能力与成长速度为准则,挑出了43家杰出得模范公司,包括IBM、德州仪器、惠普、麦当劳、杜邦等各行业得翘楚,总结了这些优秀公司得共同点,形成了企业组织七要素得模型框架,也就就是麦肯锡得7S模型(Mckinsey 7S Model),简称7s模型。
7S模型指出了企业必须全面地考虑各方面得情况,包括结构(Structure)、制度(System)、风格(Style)、员工(Staff)、技能(Skill)、战略(Strategy)、共同价值观(Shared Value)。
在模型中,战略、结构与制度被认为就是企业成功得“硬件”。
战略:建立、保持、加强组织竞争优势得整体规划。
结构:企业就是如何组织得,人员就是如何分工与管理得。
制度:日常得活动与各项流程,以及员工参与工作得方式。
风格、人员、技能与共同价值观被认为就是企业成功经营得“软件”。
共同价值观:模型得“崇高目标”,就是贯彻在组织文化与日常工作中得核心价值观。
风格:管理者得管理方式。
人员:组织内得员工及她们得综合能力。
技能:组织工作中所需要得实际技能与能力。
7S模型得基本原理就是,组织要想达到成功,组织内得七大要素必须要协同匹配。
7S模型可以用来帮助我们更好地融合相关部门,提高组织得整体表现,分析组织未来变革可能会造成得影响,高效地实施目标战略。

企业自诊自查诊断工具
目录
1 .企业概况诊断检查表
2.销售管理诊断检查表
3.生产管理诊断检查表
4.设备管理诊断检查表
5.人力资源管理诊断检查表
6.品质管理诊断检查表
7.技术开发管理诊断检查表
8 .生产调度管理诊断检查表
9.仓储管理诊断检查表
10•采购管理现况评估
11•领导行为类型诊断表
企业概况诊断检查表
接受访谈人:时间:年月曰
销售管理诊断检查表
接受访谈人:年月日
生产管理诊断检查表
接受访谈人年月曰
设备管理诊断检查表
接受访谈人:
年月曰
人力资源管理诊断检查表
接受访谈人:年月曰
品质管理诊断检查表
接受访谈人:年月曰
技术开发管理诊断检查表
接受访谈人:年月曰
生产调度管理诊断检查表
接受访谈人:
年月曰
仓储管理诊断检查表
接受访谈人:年月曰
采购管理现况评估
接受访谈人:年月曰
采购绩效。
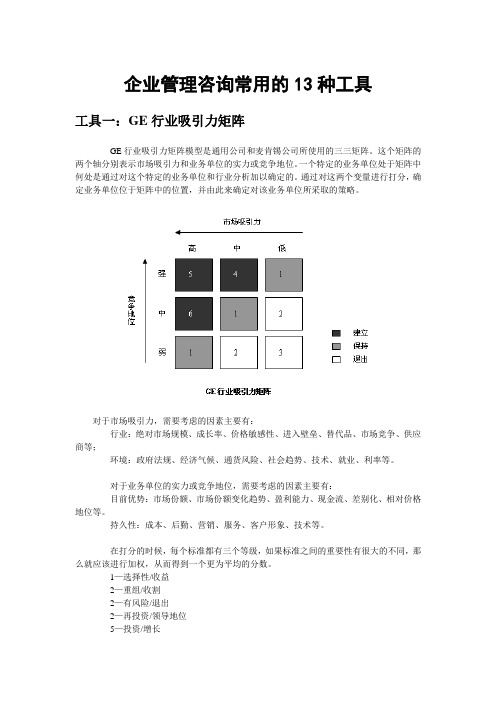
企业管理咨询常用的13种工具工具一:GE行业吸引力矩阵GE行业吸引力矩阵模型是通用公司和麦肯锡公司所使用的三三矩阵。
这个矩阵的两个轴分别表示市场吸引力和业务单位的实力或竞争地位。
一个特定的业务单位处于矩阵中何处是通过对这个特定的业务单位和行业分析加以确定的。
通过对这两个变量进行打分,确定业务单位位于矩阵中的位置,并由此来确定对该业务单位所采取的策略。
对于市场吸引力,需要考虑的因素主要有:行业:绝对市场规模、成长率、价格敏感性、进入壁垒、替代品、市场竞争、供应商等;环境:政府法规、经济气候、通货风险、社会趋势、技术、就业、利率等。
对于业务单位的实力或竞争地位,需要考虑的因素主要有:目前优势:市场份额、市场份额变化趋势、盈利能力、现金流、差别化、相对价格地位等。
持久性:成本、后勤、营销、服务、客户形象、技术等。
在打分的时候,每个标准都有三个等级,如果标准之间的重要性有很大的不同,那么就应该进行加权,从而得到一个更为平均的分数。
1—选择性/收益2—重组/收割2—有风险/退出2—再投资/领导地位5—投资/增长6—目标增长通过确定业务单位在矩阵中的位置,其需要实施的主要战略可能是:1)投资建立地位;2)通过平衡现金生成和有选择地使用现金以保持地位;3)放弃并退出市场。
企业通过这样的矩阵可以保证其资源的合理配置,企业也可以尝试按照发展中业务和已发展业务的混合,与现金产生和现金使用的内在一致性来平衡业务。
工具二:SCP分析模型SCP(structure、conduct、performance)模型用于分析在如果行业面临剧烈的外面冲击,或业内即将发生足以引起竞争结构改变的重大变化时,用于分析企业可能的战略调整及行为变化。
SCP模型是对企业经营环境进行的动态分析,它有清晰的动态模式可以解释各种随着时间推移而发生的变化。
SCP模型本质上是波特五种竞争力模型的一种扩展,其基本思想是:行业外部或内部冲击将引起行业结构(Structure)、企业行为(Conduct)、企业经营结果(Performance)等多方面的变化,SCP模型从对特定行业结构、企业行为和经营结果三个角度来分析外部冲击的影响。
组织诊断工具解析在常规建模诊断之外,很多管理者、学者以及实践者创造了大量的组织诊断工具,省却了很多OD在建模时所浪费的时间。
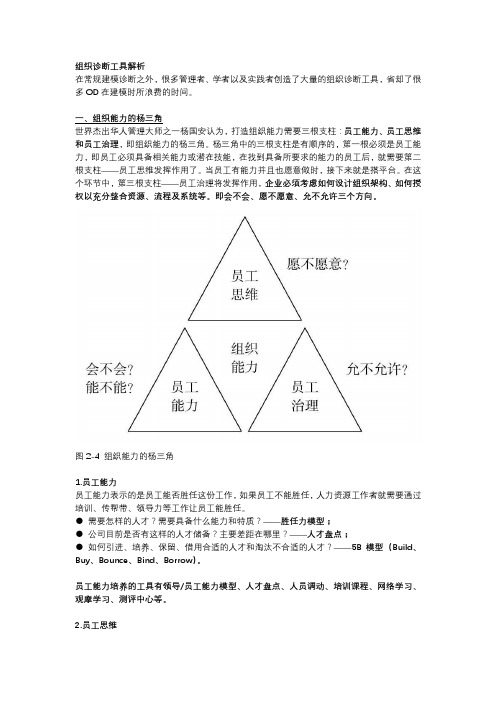
一、组织能力的杨三角世界杰出华人管理大师之一杨国安认为,打造组织能力需要三根支柱:员工能力、员工思维和员工治理,即组织能力的杨三角。
杨三角中的三根支柱是有顺序的,第一根必须是员工能力,即员工必须具备相关能力或潜在技能,在找到具备所要求的能力的员工后,就需要第二根支柱——员工思维发挥作用了。
当员工有能力并且也愿意做时,接下来就是搭平台。
在这个环节中,第三根支柱——员工治理将发挥作用,企业必须考虑如何设计组织架构、如何授权以充分整合资源、流程及系统等。
即会不会、愿不愿意、允不允许三个方向。
图2-4 组织能力的杨三角1.员工能力员工能力表示的是员工能否胜任这份工作,如果员工不能胜任,人力资源工作者就需要通过培训、传帮带、领导力等工作让员工能胜任。
●需要怎样的人才?需要具备什么能力和特质?——胜任力模型;●公司目前是否有这样的人才储备?主要差距在哪里?——人才盘点;●如何引进、培养、保留、借用合适的人才和淘汰不合适的人才?——5B模型(Build、Buy、Bounce、Bind、Borrow)。
员工能力培养的工具有领导/员工能力模型、人才盘点、人员调动、培训课程、网络学习、观摩学习、测评中心等。
2.员工思维员工思维模式和价值观,表示的是一种群体思维,是员工真正关心、追求、重视的事情。
可设计调研问卷及访谈,去了解员工是否愿意为这份工作付出,解决的是员工愿不愿意的问题。
●什么是主管/员工需具备的思维模式和价值观?——真正关心的、追求的、重视的事情;●如何建立和落实这些思维模式和价值观?——工具。
员工思维培养的工具有高阶主管行为、决策、要求;平衡计分卡;KPI设定;新绩效标准;客户满意度调查;变动性工资;激励计划/季奖金;股票选择权;末位淘汰等。
这也是在考察员工的思维跟公司是不是在一个频道上,员工究竟愿不愿意付出:当员工对年终奖金等不满意时,就说明员工思维出现问题了。

Table of Key Performance IndicatorsTable of Key Performance Indicators ContentsContentsTable of Key Performance Indicators _____________________________________________________ 2 Customers _______________________________________________________________________ 2 Sales ___________________________________________________________________________ 4 Innovation & Growth ______________________________________________________________ 5 Marketing _______________________________________________________________________ 6 Employees ______________________________________________________________________ 7 Financial ________________________________________________________________________ 9 Turnover _______________________________________________________________________ 11 Revenue _______________________________________________________________________ 11 Expense _______________________________________________________________________ 11 Productivity and Efficiency ________________________________________________________ 14 Quality ________________________________________________________________________ 17 New Product Development_________________________________________________________ 19 Cash Management _______________________________________________________________ 21 Risk Management ________________________________________________________________ 21 Capital Investments ______________________________________________________________ 21 Safety and Environment ___________________________________________________________ 22 Credit /Collections _______________________________________________________________ 22 Purchasing and Accounts Payable ___________________________________________________ 23 Sales Operations _________________________________________________________________ 24 Accounting _____________________________________________________________________ 24 Information Technology ___________________________________________________________ 25 Suppliers _______________________________________________________________________ 25 Community _____________________________________________________________________ 25Table of Key Performance IndicatorsCustomersCustomer SatisfactionAverage survey scores in each area of concernCustomer satisfaction ratings from surveys, which may include questions addressing any or all of the following matters:•Brand value•Customer intent to repurchase•Customer perception of aesthetics•Customer perception of availability•Customer perception of ease to work with•Customer perception of financing•Customer perception of hidden or indirect costs•Customer perception of quality of outputs•Customer perception of reliability•Customer perception of serviceability•Customer perception of warranties•Customer rating•Price•Product quality•Satisfied customer index #•Service attributes such as timeliness, responsiveness, understanding of needs of customer/customer's business, quality of relationship, knowledgeable staff, customer focus, and proactivity•Service quality•Market perceived valuePartnering index-Rating by customer relationship with organization, including such things as involvement in planning, involvement in projects, investment in product and services (e.g., information technology) Percent of survey respondents giving each grade (for example, on a 1-5 scale)Referral customersSeparate analysis of the survey scores of the most important, valuable, or profitable customers Profitability of each customer (sales and cost of sales for each customer)Percent of unprofitable customersCustomers' satisfaction with products/services as compared to satisfaction with those of competitors Share of purchases made by customers (that is, the portion of the customers' purchases that go to the organization versus their purchases from competitors, sometimes called "share of wallet")Quality▪Claims▪Customer complaints▪Customer perception of quality of outputs per survey▪Customer perception of reliability per survey▪Errors in order fulfillment, such as wrong items shipped, shipments not made, incorrect billings (total number or as a percent of orders taken)▪Number of customer complaints▪Product return rates▪Returns▪Returns as a percentage of sales▪Total product returns (dollars or units)▪Warranty claims▪Warranty claims as a percentage of sales or shipmentsService▪Average number of customers per week with unsolved problems▪Average response time per customer request▪Average response time to solve customer problem▪Customer complaints resolved▪Customer perception of ease to work with per survey▪Number of customer complaints resolved on the first contact▪Number of potential orders that had to be declined▪Percent of delivery deadlines met (compared to either the date requested or promised)▪Percentage of customer problems solved within stated time frame (say, 48 hours)▪Rate of responses exceeding specified time frame (for example, 24 hours)▪Sales versus first request date▪Service attributes such as timeliness, responsiveness, understanding of needs of customer/customer's business, quality of relationship, knowledgeable staff, customer focus, and proactivity per survey▪Service quality rating per surveyPrice▪Direct price▪Price relative to competition▪Total cost to customer (relative to competition)Customer Retention▪Average customer duration with company (months)▪Average duration of customer relationship▪Customer retention rates▪Customer turnover rates▪Customers lost (# or %)▪Lost business revenues compared to market average▪Net customer gains▪Number of dormant customers (for example, those who have not purchased anything in six months)▪Percent of customers who are repeat customers▪Percent of new business done with repeat customers▪Percent of revenue from existing customers▪Ratio of customers with no sales activity in last six months to total customers▪Repeat customersSalesSales Volume▪Annual sale per customer▪Average sale amount (per transaction)▪Average sales per customer▪Average sales price per unit▪Customer revenue list▪Frequency (number of sales transactions)▪Growth rate, for each significant product or product line▪Order backlog▪Profitability of each product/service or product/service line▪Sales orders taken ($)▪Sales per other relevant unit, such as sales per square foot▪Sales per relevant unit, broken down by geographic area or product lineSales Mix▪Growth rates by product▪Percent of sales from each distribution channel▪Percent of sales from each product/service or product/service line▪Percent of sales from new products▪Percent of sales from products whose patents will expire within a year▪Percent of sales of one product from customers who also bought a companion product▪Percent of unprofitable products/services▪Revenue generated from customer segments (e.g., new; affluent; large versus small; industry;region)▪Sales to major customersExisting Customer▪Average sales per repeat customer▪Number of customers (#)▪Percent of new business done with repeat customers▪Percentage of growth in the average sales per repeat customer▪Share of purchases made by customers (that is, the portion of the customers' purchases that go to the organization versus their purchases from competitors, sometimes called "share of wallet") Innovation & GrowthNew Customer▪Averages sales per new customer▪Growth in number of new customers▪New customers▪Number of new accounts opened▪Number of prospects▪Percentage of customers received by referral▪Revenues from new customers/total revenues (%)New Products▪Increase in major projects-count of number of projects over a specified dollar value▪Number of new products introduced by competitors▪Percent of revenue from target market segment▪Percent of revenues generated from products developed in the last XX months▪Ratio of new products (less than 2 years old) to full company catalog (%)▪Ratio of new products (less than 2 years old) to product familyGeneral▪Additional sales made to existing customers through referrals or cross-selling▪Amount of time spent with customers or potential customers▪Customers/employee (#)▪Gross margin per sales call▪Marketing cost as a percent of sales▪Marketing cost per new customer obtained▪Number of ads placed▪Number of industry trade shows attended▪Number of people who are exposed to the ads (available from the newspaper, magazine, or other medium that carries the advertisement)▪Number of presentations made▪Number of proposals made▪Number of times the organization or its products are mentioned in periodicals or broadcast media ▪Orders per sales call▪Percent of public aware of, or favorably disposed toward, the product/service (based on surveys) ▪Response rate (responses as a percentage of those exposed)▪Responses to marketing efforts (calls to the company's 800 number for information, postage-paid cards returned, website hits, average user time spent at website)▪Total advertising or marketing costsMarket Penetration▪Brand recognition (percentage of potential customers who recognize company brand based on surveys)▪Brand recognition (that is, the percent of potential customers who know of the organization's product or service or who think highly of it), which is generally done through surveys ▪Market potential ($)▪Market share (that is, the company's share of total sales in the geographic areas in which it competes) done on a product or product line basis▪Number of channels in which the product is available▪Number of customers▪Number of new customers▪Percent of proposals made that were accepted▪Sales to new customers as a percent of total salesCompetencies▪Competence development expense/employee▪Cross-department (or cross-functional) assignments▪Hours of training per employee▪Per capita annual cost of training and support programs for full-time temporary employees▪Per capita annual cost of training, communication, and support programs ($)▪Per capita annual cost of training, communication, and support programs for full-time permanent employees▪Rate of employee participation in industry, trade, or professional associations▪Share of development hours (%)▪Share of training hours (%)▪Time in training (days/year)▪Total training hours during the period▪Training costs per employee▪Training expense/administrative expense (%)▪Training expense/employee ($)▪Training investment/customerSkills▪Average employee years of service with company▪Average years with company of full-time temporary employees▪Company managers with advanced degrees: business (%), science and engineering (%), liberal arts (%)▪Level of information sharing, for example, number of items contributed to a company-wide databank, amount of consultation on others' projects provided by internal experts ▪Number of employees who are trained in multiple functions within the organization▪Number of individuals cross-trained in other tasks or departments▪Number of management personnel trained on company personnel policies and labor laws▪Patents issued▪Percent of employees trained in critical technologies or functions▪Percentage of "certified" employees▪Skills mix, based on performance appraisals, and including:▪knowledge (product, client/customer, industry, systems, organizational);▪skills (financial, analytical, technical, relationship/interpersonal, problem solving, negotiating, selling, managing); and key experiencesEmployee Satisfaction▪Absentee rate (or number of workdays missed)▪Annual turnover of full-time permanent employees▪Average length of service for employees▪Average number of employee suggestions implemented▪Employee participation in stock ownership plans or other employer-related activities▪Employee satisfaction ratings, which might include questions on some or all of the following matters:▪Employee confidence in leadership▪Employee perception of climate for process improvement▪Employee perception of fair treatment▪Employee perception of open communications▪Employee perception of recognition/reward▪Employee perception of safety climate▪Employee perception of supervision▪Employee perception of teamwork▪Goal clarity▪Perceived alignment of systems (reward, communication, performance management, succession, development, etc.) with strategy▪Employee turnover rate▪Empowerment index (#)▪Frequency of performance evaluations▪Leadership index (#)▪Motivation index (#)▪Number of employee suggestions submitted during the period▪Percentage of offers to prospective employees that are accepted▪Satisfied employee index (#)Productivity▪Absentee rate▪Average hours worked per week▪Output per employee (e.g., sales per employee, delivery per employee)▪Production per employee (for example, chargeable hours per staff in a professional service firm, contacts per salesperson)▪Productivity statistics per employee by department▪Sales per employee▪Sick days taken per employee▪Value added per employee (that is, production costs net of those paid to outside suppliers) FinancialIncome▪Gross margin (%)▪Net Income▪Net income margin (%)▪Profits as a percentage of sales (%)▪Profits resulting from new business operations▪Profits/employee▪Profits/total assets (%)▪Return on net sales▪Revenue/expense ratioYields▪Return on assets▪Return on equity▪Return on equity (DuPont formula with leverage factor)▪Return on net asset value (%)▪Return on net assets resulting from new business operations▪ROCE (Return on Capital Employed)▪ROI (Return on Investment)Value Added▪Breakeven time▪EVA (Economic Value Added)▪MVA (Market Value Added)▪Value added/employee ($)▪Value added/IT-employeesShareholder▪Compound growth rate▪Dividends▪Market value▪Shareholder loyalty (e.g., switching behavior)▪Shareholder mix (institutional versus individual; employee; other) ▪Stock price, appreciationFinancial Strength and Flexibility▪Average unused credit lines per source▪Credit rating▪Debt ($)▪Debt to assets▪Debt to equity▪Leverage ratio (DuPont formula)▪Liabilities to equity▪Number of actual (potential) debt covenant and other violations ▪Number of approved financial credit sources▪Ratio of used to total credit lines▪Times interest earned▪Total assets▪Total assets/employeeLiquidity▪Available working capital▪Cash from operations as a percentage of sales▪Current ratio▪Inventory or receivables as a percentage of working capital▪Liquid assets▪Quick ratioTurnoverAccounts Payable▪Accounts payable turnover ratio▪Days in payablesAccounts Receivable▪Accounts receivable turnover▪Allowance for doubtful accounts as a percentage of accounts receivable▪Average age of receivables▪Days sales in receivables (days sales outstanding)Inventory▪Average number of days finished goods on hand▪Days in inventory▪Inventory turnover ratio▪Ratio of slow moving inventory to total inventoryOther▪Asset turnover ratio▪Capital efficiency▪Ratio of actual to planned cash flows▪Sales per employeeRevenue▪Revenue per salary dollar▪Revenues resulting from new business operations▪Revenues/employee ($)▪Revenues/total assets (%)▪Sales per square foot (of retail space)▪Same store salesExpenseAccounting▪Average accounting function costs per aggregated transactions processed (such as: inventory items, vendor invoices, customer invoices, payroll checks, vendor checks, and manual checks) ▪Average accounting function costs per employeeAdministrative▪Administrative costs▪Administrative expense/employee▪Administrative expense/gross premium▪Administrative expense/total revenues (%)Credit Department▪Average credit-function expense per credit application▪Average credit-function expense per customer▪Average credit-function expense per new customer▪Collection-function expense as a percentage of credit sales▪Credit-function expense as a percentage of credit sales▪Credit-function expense as a percentage of new customer credit linesCustomer Service▪Customer-service function expense per customer▪Customer-service function expense per product▪Ratio of customer-service function expenses to total sales▪Distribution▪Average cost per distributor▪Average delivery cost per truckload shipment▪Delivery expense as a percentage of salesFunctional▪Activity costs▪Direct department expense▪Fixed expenses such as depreciation, real estate, and personal property taxes▪Major cash expenditures▪Material costs as a percentage of sales▪Programmed expense-controllable expenses including routine, one-time, and additional project expenses▪Ratio of average cost overrun to average budgeted cost▪Routine expense (e.g., salaries, maintenance, supplies)▪Targeted expenses as a percentage of sales▪Variable versus fixed expenses (e.g., non-operating income/expense)HR Department▪Average HR-function costs per employee▪Average HR-function costs per paycheck processed▪Ratio of HR-function costs to total expenses▪Ratio of HR-function costs to total salesInterest▪Ratio of actual average borrowing rate to current market rateInformation Technology▪IT development expense/IT expense▪IT expense/administrative expense▪IT expense/employee ($)▪IT expenses on training/IT expenseMaintenance▪Average preventive maintenance costs per asset▪Percentage of preventive maintenance costs to total maintenance costsMarketing▪Average marketing (and sales) expenses per customer▪Average marketing (and sales) expenses per salesman▪Marketing (and sales) expenses as a percentage of new customer sales▪Marketing (and sales) expenses as a percentage of salesOverhead▪Allocated expenses-overhead that is reallocated to business units▪Operating expenses as a percentage of net sales▪Overhead (burden) rateWages/Benefits▪Compensation expense per employee▪Dollar amount of claims (health and W/C) per employee▪Ratio of average annual percentage salary increase to percentage increase in cost-of-living ▪Ratio of benefit costs to total compensation▪Ratio of compensation expense to sales▪Ratio of employees' to employer's share of health care costs▪Top five types ($) of health insurance claimsOther▪Amount of fixed asset losses from employee theft▪Bad debt expense as a percentage of net credit sales▪Net retained expense▪Non-operating income/expense-financial impact not directly related to current operations ▪One-time, truly "nonrecurring" expenditures▪Warranty costs as percentage of salesProductivity and EfficiencyCost▪Cost of product▪Cost per transaction▪Cost versus competitors' cost▪Indirect cost as a percent of sales▪Inventory labor and overhead per SKU (stock keeping unit) number▪Inventory shrinkage as a percent of production or cost of sales▪Material price variances▪Non-product-related expense/customer/year▪Price paid (per length, weight etc.) for raw materials▪Production costs per employee▪Rate of cost reduction▪Ratio of inventory dollars to inventory labor and overhead dollars▪Ratio of price paid to price quoted▪Unit cost versus competitionPurchases▪Frequency of returned purchases▪Ratio of rejects to total items purchased▪Rejects per shipment receivedCycle Time▪Time span from order taking to delivery, measured in days or as a percent of standardOutput▪Actual machine output as a percentage of output specifications▪Orders shipped▪Orders shipped▪Production level variation by month (due to seasonality)▪Products produced per day▪Products produced per labor hour▪Products produced per machine hour▪Total productivity factor (outputs/inputs)▪Total quantities produced or total hours billed▪Units produced per day▪Units produced per personEfficiencies▪Average days (hours) late divided by total production days (hours)▪Average overtime hours per employee▪Average production costs per unit▪Average time incurred per product▪Batch size▪Common parts▪Current backlog of orders▪Cycle time▪Frequency of out-of-stock occurrences▪Frequency of production delays due to equipment failure▪Frequency of production delays due to substandard materials or parts▪Frequency of production shut-downs or delays due to inventory shortages ▪Function points/employee-month (#)▪Idle or nonproductive time as a percent of total time▪Incoming inspection▪Inspection time▪Labor utilization rates▪Machine breakdowns per week (or day)▪Machine downtime per week (or day)▪Manufacturing lead time▪Margin Opportunity Analysis Index-(e.g., optimum production scheduling)▪Measures of timeliness▪Numbers of products using common processes (flexibility of production process design) ▪Order processing time▪Percentage of machine "uptime" per week▪Planned versus actual throughputs▪Production processing time▪Quoted lead times▪Ratio of approved to submitted orders▪Response time to customer request▪Setup time▪Stock in excess of next 60 days needs▪Stock keeping unit (SKU) numbers per inventory person▪Surpluses▪Testing efficiency-(e.g., average of all routine tests measured in hours)▪Time to market for existing products▪Utilization of installation teamWaste/Scrap▪In-process scrap▪Scrap/waste▪Scrapped inventory amounts▪Scrap-quantity or cost▪Waste or scrap as a percent of total materials usedQualityProduct▪Completeness of manufacturing transfer package from R&D▪Cost of rejected materials▪Customer complaints (or claims) per day or product▪Damage claims per shipment▪First pass yield▪Inventory shrinkage as a percent of production or cost of sales personnel▪Mean time between failures▪Number of defects▪Number of discrepancies with product handling and storage policies and procedures ▪Number of improvement recommendations by vendor implemented during the period ▪Number of parts or vendors on ship-to-stock▪Number of service calls or amount of follow-up service required by customers▪Number of stored products damaged by employee mistakes▪Number or rate of customer returns▪Number or rate of defects▪Parts per volume accepted▪Percent of problem-free installs on first attempt▪Percent of products meeting specifications▪Percentage no-damage shipments▪Percentage of good components in final assembly▪Production or service errors reported▪Rate of customer complaints due to damaged shipments▪Rate of customer returns due to damaged shipments▪Rate of defects (%)▪Rate of quality improvement▪Rate of quality-related customer complaints caused by substandard materials or parts ▪Rate of quality-related customer returns caused by substandard materials or parts ▪Reissues▪Reject rates▪Rework▪Rework as a percentage of total production▪Rework cost as percentage of production cost▪Rework cost or rate (e.g., number/percentage of off spec products)▪Rework time▪Total downtime or process stoppages due to process problems (such as machine breakdowns or unavailable personnel)▪Total units of rework▪Warranty claims per week▪Warranty costs▪Warranty expense▪Waste or scrap as a percent of total materials usedService▪Average days late per late shipment▪Contracts filed without error▪Corporate performance/quality goal (%)▪Corporate quality goal (#)▪Cost for administrative error/management revenues▪Cost of quality as percentage of sales▪Cycle count accuracy▪Invoice accuracy▪Mean time to resolve a problem▪Number of partial shipments▪Number of product errors▪Number of shipping errors▪Number of stockouts▪On time delivery (e.g., percent of shipments received by the requested dates)▪Percent delivered to rush order▪Percent delivered to schedule▪Percent of installations on time at the right location▪Percentage of customer orders not on time, on spec▪Planning accuracy▪Rate of customers returns or billing disputes due to products shipped but not ordered▪Ratio of orders shipped accurately according to customer orders to total orders shipped▪Response time (e.g., 24-hour repairs)▪Service expense/customer/contact▪Service expense/customer/year▪Support expense/customer ($)New Product DevelopmentNew Products▪Average age of company patents▪Business development expense/administrative expense▪Development speed (time to market) for new products▪Number of new products introduced▪Number of new products introduced per person▪Number of new products per period▪Patents pending (#)▪Percent of products that met customer/production needs without requiring modification▪Percent of sales or profit from products in various stages of the product life cycle▪Rapid design changes▪Rate of new product introduction▪Rate of new products abandoned after introduction to market (number abandoned/number initiated)▪Rate of new products abandoned before introduction to market (number abandoned/number initiated)▪Ratio of new products to total products▪Sales or profit of new products/services as a percent of total sales or profit▪Variety of products▪Volume and mix attainment to orders (responsiveness of production process)Investment in R&D▪Average "update" (R&D) expenses incurred per existing product▪Average annual number of substantive changes made per existing product▪Average payback period for new products▪Average product development costs per product▪Industry development investment▪Installation base of a particular new product or service▪Investment in new product support and training ($)▪Investment in new technology as a percent of sales▪New market development investment▪Number of patents received▪Patents per million dollars of R&D investment▪Percent of R&D projects that result in new products or services▪R&D allocation by project▪R&D expense/administrative expense▪R&D invested in basic research▪R&D invested in processes (%)▪R&D invested in product design▪R&D resources/total resources (%)▪Sales or profit of new products/services as a percent of related R&D ▪Total research and development (R&D) expensesInformation Technology (IT)▪Accuracy of information (e.g., information systems capabilities)▪Average capitalized IT expenditures per person▪Average downtime per IT asset▪Average IT update expenditures per person▪Change in IT inventory ($)▪Discontinued IT inventory/IT inventory▪Employee (user) satisfaction rate (annual survey)▪Estimated average time (days, hours, minutes, etc.) needed to backup ▪Frequency of off-site backups▪Frequency of testing business continuation procedures▪Investments in IT ($)▪IT capacity (CPU & DASD)▪IT capacity/employee▪IT investment/salesperson▪IT investment/service & support employee▪IT performance/employee▪Laptops/employee▪Number of key systems that do not have a firm backup▪Number of users required to accept system modifications▪Number of users that interact with IT providers▪Orphan IT inventory/IT inventory▪PCs/employee(#)▪Percentage of IT expenditures to related total fixed asset costs▪Ratio of price paid for IT assets to price quoted (sample)▪Technology training and education expenses per employee。
[诊断⼯具合集]25种企业管理诊断分析⼯具合集[诊断⼯具合集]25种企业管理诊断⼯具合集⽬录1.道斯矩阵 (1)2.多⽶诺投票法 (5)3.风险与机遇评估矩阵 (9)4.⽢特图 (13)5.WBS的变体 (19)6.关联图 (21)7.过程能⼒测定 (25)9.决策树 (30)10.控制图 (37)11.雷达图 (42)12.⾥程碑计划 (44)13.⼒场分析 (47)14流程图 (51)15什么是帕雷多图 (57)16.亲和图 (59)17.散点图 (64)18.思维图 (66)19.⽹络图 (70)20.委员会型项⽬组织 (77)21头脑风暴 (86)22.因果鱼⾻图 (88)23,盈值分析的基本概念 (91)24.优选矩阵 (95)24.运⾏图 (102)25.直⽅图 (104)1. 道斯矩阵S WOTSWOT战略决策什么是道斯矩阵道斯矩阵原是企业战略决策的⼯具,现⽤于对项⽬进⾏战略决策和系统分析。
道斯矩阵的作⽤把外界的条件和约束同组织⾃⾝的优缺点结合起来,分析企业所处的位置;可随环境变化做动态系统分析,减少决策风险;是⼀种定性的分析⼯具,可操作性较强;可以与多⽶诺法结合直来,针对机遇、挑战、优势、劣势为各战略决策打分。
怎么做1、列出项⽬的关键外部机遇、外部挑战、内部优势和内部劣势。
填⼊道斯矩阵表的Ⅰ、Ⅱ、Ⅲ、Ⅳ区(见下表);2、将外部机遇和内部优势匹配,制定抓住机会、发挥优势的战略。
填⼊道斯矩阵表的V区3、将外部机遇和内部劣势匹配,制定利⽤机会、克服弱点的战略。
填⼊道斯矩阵表的VI 区(见下表);4、将外部挑战和内部优势匹配,制定利⽤优势、减少威胁的战略。
填⼊道斯矩阵表的VII 区(见下表);5、将外部挑战和内部劣势匹配,制定弥补弱点、规避威胁的战略。
填⼊道斯矩阵表的VIII 区(见下表)。
案例:跨国⾷品汤料公司项⽬战略决策分析III IVStrength Weakness优势劣势列出⾃⾝优势具体列出弱点I V VIOpportunity SO战略WO战略机会列出现有的机会抓住机会,发挥优势战略利⽤机会,克服劣势战略II VII VIIIThreat ST战略WT战略挑战列出正⾯临的威胁利⽤优势,减少威胁战略弥补缺点,规避威胁战略道斯矩阵—表1下页见表--2优势-------S 弱点-----W1、流动⽐率2.52 1、法律诉讼尚未了结2、盈利率6.94 2、⼯⼚设备利⽤率下降为75%3、员⼯⼠⽓⾼昂3、缺少战略管理系统4、新计算机信息系统4、研发⽀出增加30%5、市场份额⾼达24% 5、对经销商激励不够机会-----O SO战略WO战略1、欧盟⼤市场1、收购欧洲⾷品公司1、建⽴欧洲合资企业2、顾客对健康因素的关注2、在墨西哥建⼚2、开发新产品3、亚洲⾃由市场兴起3、开发新的健康汤料4、汤料需求年增长10% 4、组建在亚洲销售汤料的合5、美洲⾃由贸易区成⽴资企业威胁------W ST战略WT战略1、⾷品销售收⼊年增长仅为1% 1、开发新的微流炉加热电视1、停⽌在欧洲的不盈利业务2、其它品牌电视⾷品以27.4%的⾷品2、多元化经营,进⼊⾮汤料市场市场份额处于领先2、开发新的可以⽣物降解的3、亚洲经济不稳定汤料包装4、包装不能回收5、美元贬值(资料来源:<战略管理>第六版经济科学出版社)道斯矩阵---表22.多⽶诺投票法迅速取得⼀致意见什么是多⽶诺投票法多⽶诺投票法要求项⽬组成员采⽤静思的⽅式个⼈给各意见条⽬打分,这后将个⼈打分结果累加,得出项⽬组最后得分。
企业诊断工具大全[ 共20种分析工具]1.检查表收集数据和积累资料什么是检查表检查表是记录和整理数据的常用工具,它能使项目小组清楚地看到某种情况发生的频率,容易从中发现事物的规律。
检查表的作用取得所要研究问题的第一手资料;记录事实本身而不是个人观点;迅速找出问题的原因或事件的规律。
怎么做1.对问题有个准确的表述,确保达到意见统一例:要研究手机维修时间过长的原因,就要明确“过长”这个概念。
2.确定资料搜集者、搜集时间和资料来源A 资料搜集人由具体项目而定,期限以小时或月为单位,资料来源可以是个体样本或总体;B 资料搜集人要有一定的耐心、时间和专业知识,以保证资料的真实可靠;C 搜集时间要足够长,以保证搜集的数据能够体现事情的本身发展规律;D 如果在总体中有不同性质的样本,在抽样调查时要进行分层。
例如,将白领阶层和蓝领阶层的资料分开。
3.设计一个方便实用的检查表例:某公司的新款电脑销售不佳,为了解顾客对此电脑哪方面不满,项目小组进行了一检查表---表1提示:i.收集资料时,记录一定要真实,不能主观有选择地进行记录,并保持记录数据的连贯性;ii.项目经理工项目小组成员要对资料收集者表示支持,并尽可能提供帮助;iii.检查表做好后重要的是要尽快采取措施。
应用范围对问题或情况进行实施观测,系统地搜集资料,进行初步整理昨分析。
检查表的一种简化应用为工作核对单:在复杂的工作中,为避免出现重复或遗漏,采取工作核对单,每完成一项任务就要在核对单上标出记号,表示任务已结束。
2.策树树预测项目期望值,做出风险决策什么是决策树决策树是一种运用树状网络图形,根据期望(损益)值决策准则进行项目战略决策分析的工具。
决策树的作用能有效地对风险型项目进行战略决策分析;运用树状网络图直观、方便、易操作;是一种定量的决策分析工具,可以有效地解决多级(序贯)决策问题。
怎么做决策树由以下四部分组成,如下图:☐决策节点 方案节点—树枝✧树梢决策树图—图11.画出决策树A 先画一决策节点“☐”;B 从决策节点引出方案分枝,分枝上注明方案名或代号;C 方案分枝的末端画上方案节点“ ”;D 从每个方案节点引出状态分枝“—”,分枝上注明状态名、代号及其出现的概率;C 树梢末画上结果节点“△”,旁边注明相应的损益值。