Experimental study on turbulent mixing of spray droplets in crossflow
- 格式:pdf
- 大小:1.11 MB
- 文档页数:9
空气辅助雾化喷嘴的数值模拟研究刘海军;宋来武;吴华【摘要】基于欧拉-拉格朗日两相流模型,数值模拟研究了一种带有螺纹通道的空气辅助雾化喷嘴的雾化过程.分析了喷嘴内空气流动特性和雾化场中的雾化特性,结果表明喷嘴内空气速度、压力和温度等参数随着流动截面变化时会发生剧烈变化,并在喷嘴出口处达到超音速状态,雾化场中雾滴具有较大的轴向速度和较小的径向速度,雾滴直径分布均匀,雾化效果良好.【期刊名称】《节能技术》【年(卷),期】2015(033)003【总页数】5页(P207-210,215)【关键词】空气辅助;雾化;欧拉-拉格朗日;数值模拟;硝酸铀酰【作者】刘海军;宋来武;吴华【作者单位】中国核电工程有限公司,北京100840;中国核电工程有限公司,北京100840;中国核电工程有限公司,北京100840【正文语种】中文【中图分类】TH133;TP183利用核能发电是性价比高、碳排量低的新型发电方式,是化石能源和水力资源之后的世界第三种主要能源。
核燃料在发电过程中会慢慢裂变,以致无法使用,出于节能经济性和减少污染排放的要求,对核燃料进行后处理和循环利用尤为重要。
在已经确定的水法后处理中,铀以硝酸铀酰水溶液的形式被回收,浓缩的硝酸铀酰溶液在流化床中脱硝生成三氧化铀,进一步还原生成二氧化铀,然后转变成四氟化铀,最后还原成金属铀循环使用[1]。
硝酸铀酰水溶液的雾化能够使液料形成尺寸均匀,颗粒直径小的液雾,以增加硝酸铀酰水溶液与流化气和流化底料之间的接触面积,提高反应速度。
由于硝酸铀酰水溶液粘度较大,因此适合雾化高粘度液体的空气辅助雾化喷嘴是其常用的雾化设备之一。
空气雾化喷嘴具有很多突出特点,在较低的油压下可以获得良好的雾化效果,尤其是对雾化高粘度的液体有很好的雾化质量,流量调节范围广,且能在较大的燃油流量范围内得到良好的雾化质量,因此它在石油、化工、电力等众多领域应用广泛[2-4]。
国内外许多学者对其进行了大量研究[5-9]。
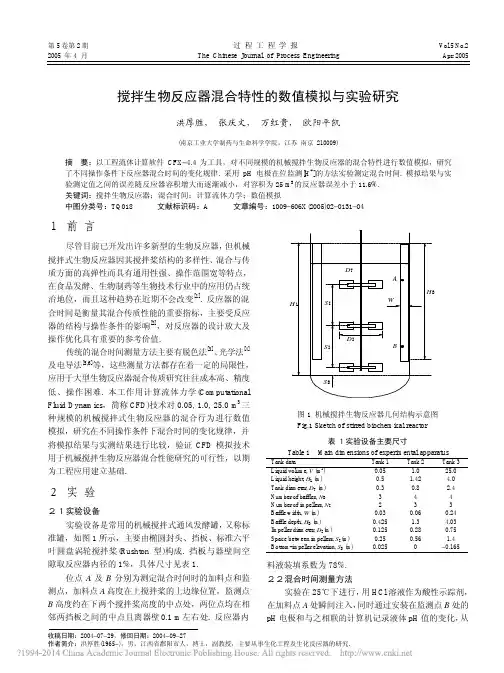
2005 年 4 月 The Chinese Journal of Process Engineering Apr. 2005收稿日期:2004−07−29,修回日期:2004−09−27作者简介:洪厚胜(1965−),男,江西省鄱阳市人,博士,副教授,主要从事生化工程及生化反应器的研究.搅拌生物反应器混合特性的数值模拟与实验研究 洪厚胜, 张庆文, 万红贵, 欧阳平凯 (南京工业大学制药与生命科学学院,江苏 南京 210009)摘 要:以工程流体计算软件CFX −4.4为工具,对不同规模的机械搅拌生物反应器的混合特性进行数值模拟,研究了不同操作条件下反应器混合时间的变化规律. 采用pH 电极在位监测[H +]的方法实验测定混合时间. 模拟结果与实验测定值之间的误差随反应器容积增大而逐渐减小,对容积为25 m 3的反应器误差小于11.6%. 关键词:搅拌生物反应器;混合时间;计算流体力学;数值模拟中图分类号:TQ018 文献标识码:A 文章编号:1009−606X(2005)02−0131−041 前 言 尽管目前已开发出许多新型的生物反应器,但机械搅拌式生物反应器因其搅拌桨结构的多样性、混合与传质方面的高弹性而具有通用性强、操作范围宽等特点,在食品发酵、生物制药等生物技术行业中的应用仍占统治地位,而且这种趋势在近期不会改变[1]. 反应器的混合时间是衡量其混合传质性能的重要指标,主要受反应器的结构与操作条件的影响[2],对反应器的设计放大及操作优化具有重要的参考价值.传统的混合时间测量方法主要有脱色法[3]、光学法[4]及电导法[5,6]等,这些测量方法都存在着一定的局限性,应用于大型生物反应器混合传质研究往往成本高、精度低、操作困难. 本工作用计算流体力学(Computational Fluid Dynamics ,简称CFD)技术对0.05, 1.0, 25.0 m 3三种规模的机械搅拌式生物反应器的混合行为进行数值模拟,研究在不同操作条件下混合时间的变化规律,并将模拟结果与实测结果进行比较,验证CFD 模拟技术用于机械搅拌生物反应器混合性能研究的可行性,以期为工程应用建立基础.2 实 验 2.1 实验设备 实验设备是常用的机械搅拌式通风发酵罐,又称标准罐,如图1所示,主要由椭圆封头、挡板、标准六平叶圆盘涡轮搅拌桨(Rushton 型)构成. 挡板与器壁间空隙取反应器内径的1%,具体尺寸见表1.位点A 及B 分别为测定混合时间时的加料点和监测点,加料点A 高度在上搅拌桨的上边缘位置,监测点B 高度约在下两个搅拌桨高度的中点处,两位点均在相邻两挡板之间的中点且离器壁0.1 m 左右处. 反应器内图1 机械搅拌生物反应器几何结构示意图Fig.1 Sketch of stirred biochemical reactor 表1 实验设备主要尺寸 Table 1 Main dimensions of experimental apparatus料液装填系数为78%. 2.2 混合时间测量方法 实验在25℃下进行,用HCl 溶液作为酸性示踪剂,在加料点A 处瞬间注入,同时通过安装在监测点B 处的pH 电极和与之相联的计算机记录液体pH 值的变化,从Tank dataTank 1 Tank 2 Tank 3 Liquid volume, V (m ) 0.05 1.0 25.0 Liquid height, H L (m) 0.5 1.42 4.0 Tank diameter, D T (m) 0.3 0.8 2.4 Number of baffles, N B 3 4 4 Number of impellers, N I 2 3 3 Baffle width, W (m) 0.03 0.06 0.24 Baffle depth, H B (m) 0.425 1.3 4.03 Impeller diameter, D I (m)0.125 0.28 0.75 Space between impellers, S I (m) 0.25 0.56 1.4 Bottom-impeller elevation, S B (m)0.025−0.165而反映液体中[H +]浓度的变化. 典型的[H +]变化过程如图2所示[7]. 一般混合过程中示踪剂浓度变化曲线的振幅随时间指数递减,而其频率与时间无关,混合时间可以从曲线上读出. 混合时间t m 是指示踪剂注入反应器至达到一定混匀程度的时间. 混匀程度的定义为0.5100%C Cm C ∝∝−∆=×. 通常认为m 达到95%时,流体即混合均匀,此时的混合时间常用t 95来表示.3 CFD数值模拟 3.1 基本原理 3.1.1 基本数学模型在工业生产常用的操作条件下,生物反应器内液体湍流运动可由时均方程组来描述,其流动守恒方程组由张量表示的通用形式描述如下:()()()k k k kv S t x x x φφφρφρφΓ∂∂∂∂+=+∂∂∂∂, 式中,φ表示质量组分、速度、压力、湍流动能、湍流耗散等变量,S φ为源项,Γφ为湍流扩散,在计算示踪剂浓度场时,Γφ=ρD φ+µT /σφ, D φ为示踪剂分子扩散系数,µT 为湍流动力粘度,其值取于速度场湍流k −ε双方程模型,σφ为湍流Prandtl 数. 3.1.2 混合时间模拟生物反应器中物料在混合过程中的浓度分布随时间变化的非稳态过程通常有两种数值计算方法,一种是联立所有方程进行求解,另一种是假设速度场稳定,单独进行流场计算. 本研究的混合时间计算采用后一种方法. 具体模拟分两步进行:第一步,用单物质模型计算稳态流场,模拟的单物质是水;第二步,在上述稳态流场的基础上引入双物质模型(如水和示踪剂)进行非稳态计算. 在加料点设置初始示踪剂的注入量,在计算过程中求解监测点示踪剂的浓度变化,当混匀程度达到95%时,即认为达到了完全混合. 这段时间就称为搅拌反应器的混合时间,记为t 95. 3.2 数值计算 3.2.1 几何模型的构建及网格划分对于带有六平叶圆盘涡轮桨及挡板的搅拌生物反应器,由于其结构的对称性,故可以用通过轴心的垂直截面将其分成对称的若干部分. 如1.0 m 3机械搅拌发酵罐就可以对称地分成两部分,只对其中一部分进行几何体构建及网格划分. 机械搅拌生物反应器中搅拌桨与挡板之间相对移动的动界面可采用滑移网格法处理. 这种方法将计算区域分为两部分,如图3所示,一部分包含了运动的搅拌桨叶,另一部分包含反应器的其他静止部分,两部分网格之间要求彼此独立,两者之间的物质、动量传递通过定义接触边界面的粘联来实现.网格划分采用在正交圆柱坐标下的结构化网格,同时采用分块网格技术,在反应器中心部位网格线较密、外围较疏,这也是由流动的特点决定的. 这样可以减少假扩散,对解的收敛和求解速度都十分有利. 其对应的3种反应器(0.05, 1.0, 25.0 m 3)几何体划分的网格总数分别为158268, 215712和246996,网格的划分对求解已经达到了无关性标准. 1.0 m 3反应器具体网格空间划分见图3所示.设定流体在反应器壁处的流动速度为0,即无滑移边界条件;假定流体表面与大气无摩擦,在反应器的液体表面采用所谓的自由滑移边界条件;在轮轴处采用无移动及轴对称设定. 3.2.3 数值求解整个方程组的求解通过流体工程软件CFX −4.4完(a)(b)第2期 洪厚胜等:搅拌生物反应器混合特性的数值模拟与实验研究 133 成,通过有限体积法将微分方程组离散成差分代数方程组后,各变量差分方程用沿主流方向逐线扫描的低松弛迭代求解. 压力−速度耦合求解采用SIMPLEC 算法.4 结果与讨论 对于大多数生化反应,物料的混匀效果和混合速率决定着反应效率和生产成本,对生物反应器的混合特性的研究具有现实意义. 在搅拌生物反应器中,物料的混合作用主要由主体流动、湍流及分子扩散这3种机理的协同作用引起. 图4所示是0.05 m 3反应器在230 r/min 的搅拌转速下不同时刻示踪剂浓度值的分布. 从图中可以很直观地观察到示踪剂的混合过程. 图5为不同体积搅拌生物反应器的混合时间模拟结果与实验结果的比较. 从图中可以看出,模拟结果在趋势上与实验结果有很好的一致性,随着搅拌转速的提高,反应器混合时间逐渐变小. 从图也清楚地看出数值模拟得到的搅拌混合时间均比实验验证值要大,产生此误差的原因有很多,主要是由采用的计算方法所引起的. 因为这种方法计算首先要假设流场稳定,而实际搅拌反应器内流场并不是稳定不变的,而是呈无规则变化的非稳态过程,但流场的不稳定可以促进传质的进行,从而使混合时间减小. 就这一点来看,本研究的模拟结果与Schmalzriedt 等[8]、Bujalski 等[9]所描述的情况基本一致. 混合时间的模拟与实验结果的误差比较见表2.图5 混合时间的模拟与实验结果比较Fig.5 Comparison between simulative and experimental mixing timest =20 s10020030040020406080100120140t 95 (s )R (r/min)6080100120140160100110120130140150160170R (r/min)14016018020022024040455055606570758085R (r/min)134 过 程 工 程 学 报 第5卷表2 混合时间的模拟与实验误差比较 Table 2 Comparison of deviations between simulative and experimental mixing timesTank 1 Tank 2 Tank 3 .50 230 400 150170 190 210 230 70 90 110 130 150 Simulation value (s) 137.5 27.9 18.0 81.9 72.2 64.6 57.2 51.1 167.4 151.1 135.3 118.3 105.0 Experiment value (s) 104.0 17.0 11.0 73.0 60.0 53.0 49.0 43.0 165.0 140.0 129.0 106.0 102.0 Deviation (%)32.264.1 63.612.220.321.916.7 18.8 1.5 7.94.911.6 2.9分析比较图5和表2所给数据还可以得知,它们的误差分别在64.1%, 21.9%及11.6%以下. 随着搅拌生物反应器容积的增大,数值模拟与实验结果之间的误差逐渐变小,模拟的可靠性逐渐增大. 对容积为25 m 3的工业规模的生物反应器,模拟与验证之间的误差值小于11.6%,完全符合当前数值模拟的工程应用要求. 产生这种现象可能是小反应器中流场的无规则周期性振荡更甚,偏离本研究数值计算的第一步流场稳定的假设条件更远所致.5 结 论 以流体工程软件CFX −4.4为工具,对不同规模的机械搅拌生物反应器的混合特性进行了数值模拟,建立了最大容积为25 m 3的工业规模冷模实验装置和混合时间测定方法,并对模拟结果进行了验证. 研究结果表明,本工作建立的数学模型及采用的算法是可行的;CFD 技术可用于机械搅拌式生物反应器混合传质的基础研究和反应器的优化设计及工程放大的应用研究.符号表:S L两搅拌桨间距 (m)W挡板宽度 (m)t 时间 (s) x k 坐标位置 (m) t m 混合时间 (s) ρ 流体密度 (kg/m 3)t 95 混匀程度95%的混合时间 (s) ∆C信号波峰值波动范围 (mol/L) v 流体质点的速度 (m/s) µT 湍流动力粘度 [kg/(m ⋅s)] V反应器体积 (m 3)σφ湍流Prandtl 数参考文献:[1] 赵学明. 搅拌生物反应器的结构模型、放大及搅拌器改型 [J]. 化学反应工程与工艺, 1996, 12(1): 80−90.[2] 韦朝海,谢波,吴超飞,等. 三重环流生物流化床反应器的混合特性 [J]. 化学反应工程与工艺, 1999, 15(2): 174−178.[3] 武斌,戴干策. 搅拌槽内粘稠物系的混合过程 [J]. 高校化学工程学报, 1997, 11(2): 143−149.[4] 林猛流,王英琛,施力田. 激光法测定搅拌器的混合特性 [J]. 化学工程, 1986, 14(3): 52−56.[5] Nienow A W. On Impeller Circulation and Mixing Effectiveness inthe Turbulent Flow Regime [J]. Chem. Eng. Sci., 1997, 52(15): 2557−2565.[6] Manna L. Comparison between Physical and Chemical Methods forthe Measurement of Mixing Times [J]. Chem. Eng. J., 1997, 67(3): 167−173.[7] 戚以政,汪叔雄. 生化反应动力学与反应器,第二版 [M]. 北京:化学工业出版社, 1999. 391−392.[8] Schmalzriedt S, Reuss M. Application of Computational FluidDynamics to Simulations of Mixing and Biotechnical Conversion Processes in Stirred T ank Bioreactors [J]. Recents Progres en Genie des Procedes, 1997, 11(51): 171−178.[9] Bujalski W, Jaworski Z, Nienow A W. CFD Study of Homogenizationwith Dual Rushton Turbines Comparison with Experimental Results: Part II: The Multiple Reference Frame [J]. Chem. Eng. Res. Des., 2002, 80(A1): 97−104.Numerical Simulation and Experimental Study on Mixing Characteristics of Stirred BioreactorHONG Hou-sheng, ZHANG Qing-wen, WAN Hong-gui, OUYANG Ping-kai(College of Pharmacy and Life Science, Nanjing University of Technology, Nanjing, Jiangsu 210009, China )Abstract: By commercial CFD package CFX-4.4, mixing characteristics of stirred bioreactor were simulated and the mixing time variation under various operation conditions was investigated. The liquid mixing time was measured by means of detecting the concentration variety of [H +] with a pH probe. The deviation between simulation and experiment becomes smaller as the bioreactor volume is increased, and the error for 25 m 3 bioreactor is less than 11.6%.Key words: stirred bioreactor; mixing time; computational fluid dynamics; numerical simulationC ∝ 理想完全混匀浓度 (mol/L) m混匀程度 D I 搅拌桨直径 (m) N B 挡板个数 D T 反应器内径 (m) N L 搅拌桨个数 H B 挡板深度 (m) R 搅拌转速 (r/min)H L液位高度 (m)S B下搅拌桨距筒体底间距 (m)。
4.7.2参考文献著录标准及格式参考文献著录应项目齐全、内容完整、顺序正确、标点无误。
具体要求如下:(1)著录格式:参考文献的序号左顶格,并用数字加方括号表示,如[1],[2],…,每一参考文献条目的最后不用加结束符。
在参考文献中的标点符号都采用“半角标点符号+空格”形式。
(2)排列顺序:根据正文中首次引用出现的先后次序递增,或者按第一作者姓的英文字母或拼音字母的英文字母顺序递增,与正文中的指示序号一致。
(3)作者姓名:只有3位及以内作者的,其姓名全部列上,中外作者一律姓前名后,外国人的名可用第一个字母的大写代替,如:William E.(名) Johns(姓)在参考文献中应写为Johns W.E.;有3位以上作者的,只列前3位,其后加“,等”或“,et al”。
(4)参考文献类型及标识:根据GB3469规定,对各类参考文献应在题名后用方括号加单字母方式加以标识。
表1 传统文献的类型标识标签:杂谈1. 问:WORD 里边怎样设置每页不同的页眉?如何使不同的章节显示的页眉不同?答:分节,每节可以设置不同的页眉。
文件――页面设置――版式――页眉和页脚――首页不同。
2. 问:请问word 中怎样让每一章用不同的页眉?怎么我现在只能用一个页眉,一改就全部改了?答:在插入分隔符里,选插入分节符,可以选连续的那个,然后下一页改页眉前,按一下“同前”钮,再做的改动就不影响前面的了。
简言之,分节符使得它们独立了。
这个工具栏上的“同前”按钮就显示在工具栏上,不过是图标的形式,把光标移到上面就显示出”同前“两个字来。
3. 问:如何合并两个WORD 文档,不同的页眉需要先写两个文件,然后合并,如何做?答:页眉设置中,选择奇偶页不同与前不同等选项。
4. 问:WORD 编辑页眉设置,如何实现奇偶页不同比如:单页浙江大学学位论文,这一个容易设;双页:(每章标题),这一个有什么技巧啊?答:插入节分隔符,与前节设置相同去掉,再设置奇偶页不同。
双锥干燥机定位原理A double cone dryer is a type of rotating, horizontal cylinder that is used to dry powders, granules, and other materials in the pharmaceutical, food, chemical, and other industries. This type of dryer operates on the principle of conduction, where heat is transferred to the materials being dried through direct contact with the dryer's heated surface.双锥干燥机是一种旋转的、水平的圆筒,用于在制药、食品、化工等行业中干燥粉末、颗粒和其他材料。
这种类型的干燥机是根据传导的原理运作的,即热量通过与干燥机加热表面的直接接触传递给被干燥的材料。
The double cone dryer consists of two conical sections that are joined at the top and separated by a small angle, creating a V-shaped chamber. The materials to be dried are loaded into the dryer through a wide opening at the top, and the dryer is then rotated, allowing the materials to cascade and mix as they move from one end of the chamber to the other. This movement promotes uniform drying and prevents the materials from forming lumps or sticking to the dryer's heated surface.双锥干燥机由两个圆锥形部分组成,顶部连接并通过一个小角度分开,形成一个V形的室内。
第35卷第1期燃气涡轮试验与研究Vol.35,No.1 2022年2月Gas Turbine Experiment and Research Feb.,2022严严严严严严严严严严严严严严严严严严严严严严严严严严严严严严严严严严严严严严严严严严严严严严严严严严严严严严严严严严严严严严严严严严严严严严严严严严严收稿日期:2021-01-09作者简介:文璧(1983-),男,四川绵阳人,高级工程师,硕士,主要从事发动机噪声测试及故障诊断技术研究。
1引言航空发动机中央锥齿轮是匹配发动机和附件机构的重要部件,其主要作用是将发动机主轴转速按一定比例与转向传递给发动机附件装置[1]。
目前,中央锥齿轮在设计中主要是作为刚体处理,忽略轮齿受载后的弹性变形,这种方法满足强度、疲劳寿命、质量、体积等条件的静态设计,但其工作在高温、高转速、交变大载荷等恶劣环境,锥齿轮盘形结构易在工作中产生行波共振的动态现象,造成齿轮成块破裂失效故障。
因此,开展锥齿轮的声振特性研究就摘要:航空发动机锥齿轮声振特性的确定对于锥齿轮的研制具有重要意义。
为研究航空发动机中央锥齿轮的声振特性,根据齿轮声振信息辨识原理,利用声导管技术在齿轮部件试验器中获取原始空气声。
分析发现,啮合频率幅值的变化能够对齿轮行波共振特性实现完全表述,不仅可反映从动轮的声振特性,同时也能反映主动轮的声振特性,边频信息则反映了齿轮的故障信息。
与应变片测量结果和设计计算结果对比分析证明,声学测试是获取齿轮声振特性的有效方法。
关键词:航空发动机;中央锥齿轮;声振特性;声学测试;行波共振中图分类号:V223文献标识码:A文章编号:1672-2620(2022)01-0036-05Experimental study on acoustic and vibration characteristicsof central bevel gears of aero-enginesWEN Bi1,3,LIU Yuan-shi2,XU Yong-qiang2,DU Jun2(1.Areo Engine High Altitude Simulation Key Laboratory,Mianyang621000China;2.AECCSichuan Gas Turbine Research Institute,Mianyang621000China;3.School ofMechanical Engineering,Xi’an Jiaotong University,Xi’an710049China)Abstract:The determination of the acoustic and vibration characteristics of aero-engine bevel gears is of great significance for the development of bevel gears.In order to study the acoustic and vibration character⁃istics of the aero-engine central bevel gear,the original air sound was obtained in the gear component tester using the acoustic dust technology according to the principle of the gear acoustic information identification. Analysis results show that the variation of the meshing frequency amplitude can fully express the traveling wave resonance characteristics of the gear,which can not only reflect the acoustic and vibration characteris⁃tics of the driving wheel,but also reflect the acoustic and vibration characteristics of the driven wheel,while the side frequency information reflects the gear fault pared with the measurement results of the strain gauges and the design calculations,the acoustics test is an effective method to obtain the acoustic vibration characteristics of the teeth.Key words:aero-engine;bevel gears;acoustic and vibration characteristics;acoustic test;traveling wave resonance36燃气涡轮试验与研究第35卷显得十分重要。
大气边界层的国内外研究现状宁志远;刘厚凤【摘要】对大气边界层的理论基础、确定方法、特征要素、影响因子、时空变化特征以及与大气污染间的相互作用进行总结,得出以下结论:大气边界层的理论体系较为完备,但理论研究进展缓慢;廓线测量是确定大气边界层结构最常用的方法,雷达、数值模拟等方法仍需对比验证;大气边界层日变化、季节变化特征十分明显,海陆间边界层变化特征差异明显,戈壁、高原等地区的大气边界层特征较为特殊;大气边界层结构,尤其是风速风向、混合层高度对大气环境有明显的影响;大气污染对大气边界层的影响和区域大气边界层特征的研究较少,可作为今后的研究重点.【期刊名称】《中国环境管理干部学院学报》【年(卷),期】2017(027)002【总页数】4页(P22-25)【关键词】大气边界层;理论基础;确定方法;时空变化特征;大气边界层结构与大气污染的相互影响【作者】宁志远;刘厚凤【作者单位】山东师范大学地理与环境学院, 山东济南 250014;山东师范大学地理与环境学院, 山东济南 250014【正文语种】中文【中图分类】X51大气边界层(Atmospheric Boundary Layer,ABL)位于大气圈与地球表面交界区,是对流层下部直接受地面影响的部分,平均高度约为1~2 km,也是大气热量、动量和各种物质(水汽、污染物)上下输送的重要通道,能在一小时或更短时间内响应地面作用[1],影响因素包括地表摩擦、热量输送、污染物排放及地形扰动等,对某区域的大气环境质量有着至关重要的作用。
20世纪初,Prandtl、Ekman提出的边界层理论和Ekman螺线奠定了大气边界层理论基础[2];20世纪中期,随着Monin-Obukhov相似性理论和自由对流大气湍流理论的提出,经典湍流理论基本形成[3]。
20世纪60年代,Lorenz发现了新的湍流发生机制[4];70年代,Deardorff、Wyngaard和Dyer等人将相似性原理引入混合层和对流层的研究并逐渐完善,使其有了极大的应用价值[5]。
第63卷第3期有色金属(矿山部分)2011年5月欞欞欞欞欞欞欞欞欞欞欞欞欞欞欞欞欞欞欞欞欞欞欞欞欞欞欞欞欞欞欞欞欞欞欞欞欞欞欞欞欞欞欞欞欞欞欞DOI :10.3969/j.issn.1671-4172.2011.03.015大红山铜矿岩石物理力学性质试验研究陈超1,李争荣1,邱宇2(1.昆明理工大学,昆明650093;2.江西理工大学,江西赣州341000)摘要:对大红山铜矿435中段矿岩的单轴抗拉强度、抗压强度、抗剪强度、泊松比、弹性模量、内摩擦角以及内聚力进行了室内试验研究。
试验得出一系列岩石物理力学参数,为矿山下一步生产实践做好了准备。
关键词:岩石力学;抗压强度;抗拉强度;弹性模量;泊松比中图分类号:TD315文献标识码:A文章编号:1671-4172(2011)03-0058-04Experimental study on physical-mechanical properties of rocks in Dahongshan copper mineCHEN Chao 1,LI Zhengrong 1,QIU Yu 2(1.Kunming University of Science and Technology ,Kunming 650093,China ;2.Jiangxi University of Science and Technology ,Ganzhou Jiangxi 341000,China )Abstract :Through the study on uniaxial tensile strength ,compressive strength ,shear strength ,Poisson's ratio ,elastic moduls ,internal friction angle and cohesion of rock in the 435middle section of Dahongshan copper mine ,a series of phys-ical and mechanical parameters has been obtained in this paper ,which can provide preparation for the production of the next step.Key words :rock mechanics ;compressive strength ;tensile strength ;elastic modulus ;Poisson's ratio作者简介:陈超(1985-),男,硕士研究生,岩石力学专业。
床形结构对气固流化床流化质量和气体返混特性的影响张永民;卢春喜【摘要】用实验方法比较了一个二维床和一个大型三维床内FCC颗粒流化床在鼓泡域和湍动域内的流化质量和气体返混特性.实验结果表明,床形对A类颗粒气固流化床具有非常大的影响.二维床和三维床的流动和气固混合行为既具有相似性,如床膨胀随气速的变化趋势;也具有很大的差异性,既包括三维床流化质量差、轴向气体扩散系数大等量上的不同,又包括压力脉动、轴向气体扩散系数的变化趋势以及湾流模式等质上的不同.总之,在本研究中,二维床体现的是一种具有强烈壁效应的小型流化床的特征,而三维床则体现的是静床高度具有很大影响的大型流化床的特征.【期刊名称】《化工学报》【年(卷),期】2010(061)009【总页数】9页(P2296-2304)【关键词】床形;流化床;二维;三维;流化质量;返混【作者】张永民;卢春喜【作者单位】中国石油大学(北京)重质油国家重点实验室,北京,102249;中国石油大学(北京)重质油国家重点实验室,北京,102249【正文语种】中文【中图分类】O6-332Abstract:The fluidization quality and gas back-mixing property in a two-dimensional and a large-scale three dimensional gas-solids fluidized bedsof FCC particles were compared in the range containing both bubbling and turbulent flow regimes.The experimental results indicated bed shape’s sound effects on fluidized beds of Geldart A particles.The hydrodynamics and gas-solids mixing demonstrated both similar and different properties in the two-dimensional and three dimensional beds.The bed expansion with increasing superficial gas velocity showed similar trends in both beds.However,the fluidization quality and axial gas dispersion coefficient were much lower in the three-dimensional beds.Moreover,there were different trends of pressure fluctuation and axial gas dispersion coefficient with increasing superficial gas velocity and even different gulf streaming patterns in the two beds.In general,it can be concluded that the two-dimensional bed in this study represented a small-scale bed with strong wall effect,while the threedimensional bed represented a large-scale bed with strong effect from static bed height.Key words:bed shape;fluidized bed;two-dimensional;three-dimensional;fluidization quality;backmixing作为一种重要的两相接触方式,气固流态化已经广泛应用于石化、能源、化工等众多国民经济支柱产业中。
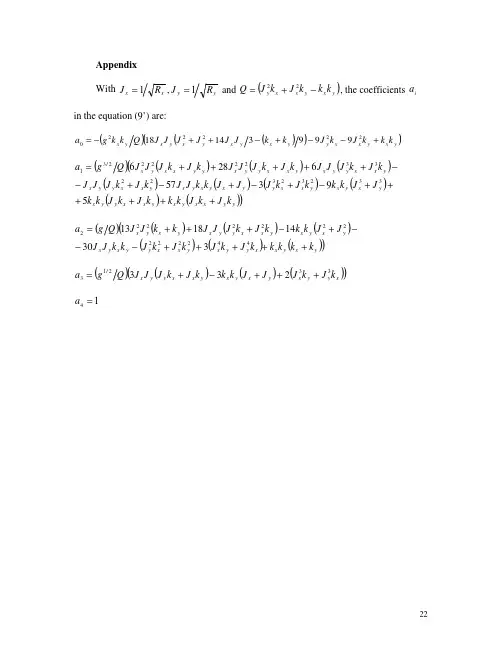
With y y x x R J R J 1,1== and ()y x y x x yk k k J k J Q −+=22, the coefficients i a in the equation (9’) are:()()()()y x y x x y y x y x y x y x y x k k k J k J k k J J J J J J Q k k g a +−−+−++−=2222209991418()()()()(()()()()()())y y x x y x y x x y y x y x y x y x x y y x y x y x y x x y y x y x x y y x y x x y y x y y x x y x k J k J k k k J k J k k J J k k k J k J J J k k J J k J k J J J k J k J J J k J k J J J k J k J J J Q g a ++++++−+−+−+−−+++++=593576286332323223322222/31()()()(()()()())y x y x x y y x y x x y y x y x y x y x y x x y y x y x y x k k k k k J k J k J k J k k J J J J k k k J k J J J k k J J Q g a +++++−−−+−+++=4422222222222330141813()()()()()x y y x y x y x y x x y y x k J k J J J k k k J k J J J Q g a 332/13233+++−+=14=a1. Lord Rayleigh, “Investigations of the character of the equilibrium of an incompressible heavy fluid of variable density” Proc.Lond.Math.Soc. 14, 170 (1883)2. R.M.Davies, G.I.Taylor, “The mechanics of large bubbles rising through extended liquids and through liquids in tubes” Proc.Roy.Soc. A200, 375 (1950)3. D.H.Sharp, “An overview of Rayleigh-Taylor instability” Physica D 12, 3 19844. S.Chandrasekhar, Hydrodynamic and hydromagnetic stability, 3d ed. (Dover Publications Inc., New York, 1981), pp.428-477; K.O.Mikaelian, “Effect of viscosity on Rayleigh-Taylor and Richtmeyer-Meshkov instabilities” Phys.Rev.E 47, 375 (1993)5. K.I.Read, “Experimental investigation of turbulent mixing by Rayleigh-Taylor instability” Physica D 12, 45 (1984); Yu.A.Kucherenko at al, “Experimental study into the asymptotic stage of separation of the turbulized mixtures in gravitationally stable mode” Laser Part. Beams 15, 17 (1997); Izv. Akad. Nauk SSSR, Mekh. Zhidk. Gaza 6, 157 (1978)6. G.Dimonte M.Schneider, “Density ratio dependence of Rayleigh-Taylor mixing for sustained and impulsive acceleration histories” Phys.Fluids 12, 304 (2000);M.Schneider, G.Dimonte, B.Remington, “Large and small scale structures in Rayleigh-Taylor mixing” Phys.Rev.Lett. 80, 3507 (1998)7. F.H.Harlow, J.E.Welch, “Numerical study of large-amplitude free-surface motion” Phys.Fluids 9,842 (1966); D.L.Youngs, “Numerical simulations of turbulent mixing by Rayleigh-Taylor instability” Physica D 12, 32, (1984); R.Menikoff, C.Zemach,“Rayleigh-Taylor instability and the use of conformal maps for ideal fluid flow”p.Phys. 51, 28 (1983); G.R.Baker, D.I.Meiron, S.A.Orszag, “Vortexsimulations of the Rayleigh-Taylor instability” Phys.Fluids 23, 1485 (1980); G.Gardner, J.Glimm, O.McBryan, R.Menikoff, D.H.Sharp, Q.Zhang, “The dynamics of bubble growth for Rayleigh-Taylor instability” Phys.Fluids 31, 447 (1988)8. X.L.Li, “Study of three-dimensional Rayleigh-Taylor instability” Phys.FluidsA5, 1904 (1993); X.L.Li, “A numerical study of three-dimensional bubble merger in the Rayleigh-Taylor instability” Phys.Fluids 8, 336 (1996)9. D.L.Youngs, “Three-dimensional numerical simulations of turbulent mixing by Rayleigh-Taylor instability” Phys.Fluids A 3, 1312 (1991)10. U.Alon, J.Hecht, D.Offer, D.Sharts, “Power-laws and similarity of Rayleigh-Taylor and Richtmyer-Meshkov mixing fronts at all density ratios” Phys.Rev.Lett.74, 534 (1995)11. S.I.Abarzhi, “Stable steady flows in Rayleigh-Taylor instability”Phys.Rev.Lett.89, 1332 (1998); “Non-linear three-dimensional Rayleigh-Taylor instability” Phys.Rev.E, 59, 1729 (1999)12. A.V.Shubnikov and V.A.Koptsik, Symmetry in science and art, Plenum New York, 197413. yzer, “On the instability of superposed fluids in a gravitational field”Astrophys.Jour. 122, 1 (1955); P.R.Garabedian, “On steady-state bubbles generated by Taylor instability” Proc.Roy.Soc. A241, 423 (1957)14. S.I.Abarzhi, “The stationary spatially periodic flows in Rayleigh-Taylor instability: solutions multitude and its dimension” Physica Scripta T66, 238 (1996);“Stationary solutions of the Rayleigh-Taylor instability for spatially periodic flows:questions of uniqueness, dimensionality and universality” Zh.Eksp.Teor.Fiz. 110,1841 (1996) (Sov.Phys.JETP 83, 1012)15. S.I.Abarzhi and N.A.Inogamov, “Stationary solutions in the Rayleigh-Taylor instability for spatially periodic flow” Zh.Eksp.Teor.Fiz. 107,245 (1995) (Sov.Phys.JETP 80,132 (1995)); N.A.Inogamov, “Stationary solutions in the theory of the hydrodynamic Rayleigh-Taylor instability” Pis’ma Zh.Eksp.Teor.Fiz. 55, 505 (1992) (Sov.Phys.JETP Lett. 55, 521 (1992))16. A.Oparin, “Numerical simulations of Rayleigh-Taylor instability using quasi-monotonic grid-characteristic approach” private communication, 1998; M.F.Ivanov,A.M.Oparin, V.G.Sultanov, V.E.Fortov, “Certain features of development of the Rayleigh-Taylor instability in 3D geometry” Doklady Physics 44, 491 (1999) (Doklady Akademii Nauk 367, 464 (1999))17. R.J.Taylor, J.P.Dahlburg, A.Iwase, J.J.Gardner, D.E.Fyfe O.Willi,“Measurement and Simulation of Laser Imprinting and Consequent Rayleigh-Taylor growth” Phys.Rev.Lett.76, 1643 (1996); M.M.Marinak, S.G.Gledinning, R.J.Wallace, B.A.Remington, et al, “Non-linear evolution of a three-dimensional multimode perturbation” Phy.Rev.Lett. 80, 4426 (1998);18. Dalziel SB, Linden PF, Youngs DL, “Self-similarity and internal structure of turbulence induced by Rayleigh-Taylor instability” Jour.Fluid Mechanics, 399, 1 (1999)19. V.E.Zakharov, “Stability of periodic waves of finite amplitude on deep fluid surface” Prikl.Mat.Teor.Fiz 2, 86 (1968) (Sov.Math. Appl. Math. and Theor. Phys. 2, 86 (1968)); E.Fermi and J.von Newman, “Taylor instability of an incompressible liquid”(1951) in book: E.Fermi, Collected papers, The University of Chicago Press, Chicago 1962, v.2, 81620. J.W.Jacobs and I.Catton, “Three-dimensional Rayleigh-Taylor instability. Part I. Weakly nonlinear theory” Jour. Fluid Mech. 187, 329 (1988)21. X.Y.He, R.Y.Zhang, S.Y.Chen, G.D.Doolen, “On three-dimensional Rayleigh-Taylor instability” Phys.Fluids 11, 1143 (1999)22. J.Hecht, U.Alon, D.Shvarts, "Potential flow models of Rayleigh-Taylor and Richtmeyer-Meshkov bubble fronts" Phys.Fluids 6, 4019 (1994)23. V.S.Arpachi, A.Asmaeeli, “On interface dynamics” Phys.Fluids 12, 1244 (2000)Figure captionsFIG.1. Bubbles generated by the Rayleigh-Taylor instability. Flow symmetry group is p2mm , λx,y are spatial periods in the plane (x, y ), rotation axis 2 and mirror planes m are perpendicular to the plane of translations. Black circle marks the positions of bubble top.FIG.2.(a). Plane of parameters R x,y of steady solutions family, finite values of aspect ratio x y k k . Physical region is bounded by the flattened bubbles (“solitary spikes”) ∞→y x R ,and by the edge solutions cr y x R ,. Dashing line relates to bubbles with circular contour ()()2x y y x k k R R=. Bubbles are y -elongated at ()()2x y y x k R R < and x -elongated at ()()2x y y x k k R R >.(b). Low-symmetric steady solutions under the dimensional crossover 0→x y k k : the solutions with ()2x y y x k k R R ≥ are restricted to region of flattened bubbles (“solitary spikes”), while solutions with ()2x y y x k k R R < become solutions of the 2D flow.FIG.3. The real parts of the Lyapunov exponents for low-symmetric steady solutions.(a). Aspect ratio 2/1=x y k k and the radius of curvature ∞≡y R .(b). Limiting case of “square flow” p4mm , 1=x y k k and x y R R =.FIG.4. Stability region for the low-symmetric bubbles in first approximation (dashing area). Finite values of aspect ratio x y k k , dashing line relates to the bubbles with circular contour, ()()2x y y x k k R R =.FIG.5. Stability of steady solutions under dimensional crossover 0→x y k k .Dashing lines are real parts of the Lyapunov exponents of the 2D flow, unstable mode D D w 23− is plotted at 1.0=x y k k and 001.0=δ. cr c R k R ≈=2. Black points are the Hopf bifurcations, which bound the region of stability of the 2D flow at N =2.FIG.6. Secondary instabilities of the low-symmetric bubbles under spatial modulations: merging and splitting.。
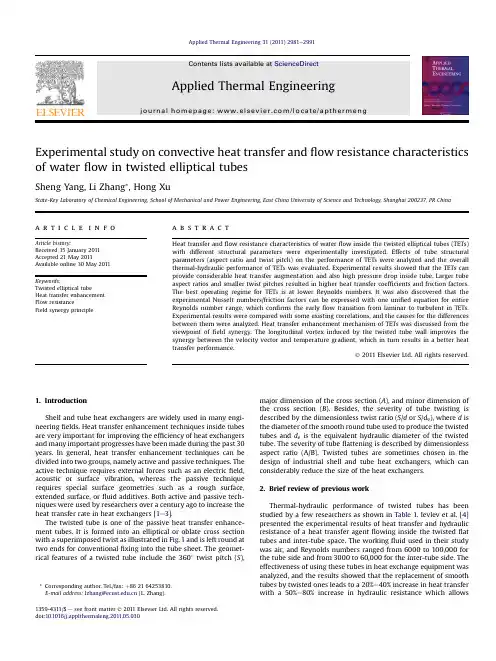
Experimental study on convective heat transfer and flow resistance characteristics of water flow in twisted elliptical tubesSheng Yang,Li Zhang *,Hong XuState-Key Laboratory of Chemical Engineering,School of Mechanical and Power Engineering,East China University of Science and Technology,Shanghai 200237,PR Chinaa r t i c l e i n f oArticle history:Received 15January 2011Accepted 21May 2011Available online 30May 2011Keywords:Twisted elliptical tubeHeat transfer enhancement Flow resistanceField synergy principlea b s t r a c tHeat transfer and flow resistance characteristics of water flow inside the twisted elliptical tubes (TETs)with different structural parameters were experimentally investigated.Effects of tube structural parameters (aspect ratio and twist pitch)on the performance of TETs were analyzed and the overall thermal-hydraulic performance of TETs was evaluated.Experimental results showed that the TETs can provide considerable heat transfer augmentation and also high pressure drop inside rger tube aspect ratios and smaller twist pitches resulted in higher heat transfer coef ficients and friction factors.The best operating regime for TETs is at lower Reynolds numbers.It was also discovered that the experimental Nusselt numbers/friction factors can be expressed with one uni fied equation for entire Reynolds number range,which con firms the early flow transition from laminar to turbulent in TETs.Experimental results were compared with some existing correlations,and the causes for the differences between them were analyzed.Heat transfer enhancement mechanism of TETs was discussed from the viewpoint of field synergy.The longitudinal vortex induced by the twisted tube wall improves the synergy between the velocity vector and temperature gradient,which in turn results in a better heat transfer performance.Ó2011Elsevier Ltd.All rights reserved.1.IntroductionShell and tube heat exchangers are widely used in many engi-neering fields.Heat transfer enhancement techniques inside tubes are very important for improving the ef ficiency of heat exchangers and many important progresses have been made during the past 30years.In general,heat transfer enhancement techniques can be divided into two groups,namely active and passive techniques.The active technique requires external forces such as an electric field,acoustic or surface vibration,whereas the passive technique requires special surface geometries such as a rough surface,extended surface,or fluid additives.Both active and passive tech-niques were used by researchers over a century ago to increase the heat transfer rate in heat exchangers [1e 3].The twisted tube is one of the passive heat transfer enhance-ment tubes.It is formed into an elliptical or oblate cross section with a superimposed twist as illustrated in Fig.1and is left round at two ends for conventional fixing into the tube sheet.The geomet-rical features of a twisted tube include the 360 twist pitch (S ),major dimension of the cross section (A ),and minor dimension of the cross section (B ).Besides,the severity of tube twisting is described by the dimensionless twist ratio (S /d or S /d e ),where d is the diameter of the smooth round tube used to produce the twisted tubes and d e is the equivalent hydraulic diameter of the twisted tube.The severity of tube flattening is described by dimensionless aspect ratio (A/B).Twisted tubes are sometimes chosen in the design of industrial shell and tube heat exchangers,which can considerably reduce the size of the heat exchangers.2.Brief review of previous workThermal-hydraulic performance of twisted tubes has been studied by a few researchers as shown in Table 1.Ievlev et al.[4]presented the experimental results of heat transfer and hydraulic resistance of a heat transfer agent flowing inside the twisted flat tubes and inter-tube space.The working fluid used in their study was air,and Reynolds numbers ranged from 6000to 100,000for the tube side and from 3000to 60,000for the inter-tube side.The effectiveness of using these tubes in heat exchange equipment was analyzed,and the results showed that the replacement of smooth tubes by twisted ones leads to a 20%e 40%increase in heat transfer with a 50%e 80%increase in hydraulic resistance which allows*Corresponding author.Tel./fax:þ862164253810.E-mail address:lzhang@ (L.Zhang).Contents lists available at ScienceDirectApplied Thermal Engineeringjournal ho mepage:www.elsevier.co m/locate/apthermeng1359-4311/$e see front matter Ó2011Elsevier Ltd.All rights reserved.doi:10.1016/j.applthermaleng.2011.05.030Applied Thermal Engineering 31(2011)2981e 2991a reduction in the heat exchanger volume of up to 30%.Thecorrelations for Nusselt number and friction factor were proposed.Asmantas et al.[5]experimentally studied the heat transfer and flow resistance characteristics of air flow inside twisted flat tubes over a range of S /d o from 6.2to 12.2,Reynolds number from 7000to 200,000.The heat transfer coef ficient for a twisted flat tube is larger than that for a smooth tube over the entire Reynolds number range.The heat transfer is augmented by as much as 40%and the hydraulic resistance also increases by a factor of 1.7on an average at S /d o ¼62.The correlations for the Nusselt numbers and friction factors were also presented.Dzyubenko and Yakimenko [6]also presented the formulas for calculating the Nusselt numbers and friction factors for flow inside twisted oval tubes and inter-tube space respectively.It was discovered that the heat transfer is enhanced obviously when the Reynolds number is smaller than 7000.By means of a method of effective parameters,it was discovered that the thermal-hydraulic ef ficiency of twisted tubes is higher than that of smooth round tubes and smooth tubes with annular knurling.Si et al.[7]experimentally studied the heat transfer and pres-sure drop characteristics of diesel oil flowing in twisted flat tubes.Three kinds of twisted flat tubes with different structural param-eters were tested.It was found that the tube side heat transfer coef ficient and friction factors for these tubes were higher than those for the smooth tube.The twisted tubes have better heat transfer performance at smaller Reynolds number from around 2000to 7000.And the smaller the twist pitch,the better the heat transfer performance.The flow resistance for the twisted tube has a greater increase at smaller Reynolds number from 2000to 7000compared with that of the smooth tube,and with the decrease of the twist pitch,the flow resistance increases.The author analyzed that the swirling flow in the twisted tube increase the fluid turbulence,which enhances the heat transfer while increasing the flow resistance.Zhang et al.[8]conducted an experimental investigation on the heat transfer and flow resistance of water flow inside different twisted tubes.The tests were conducted at Reynolds numbers ranging between 7900and 26,500.Both heat transfer coef ficients and friction factors increase with the decrease of twist pitch or with the increase of aspect ratio at the same Reynolds number.The thermal-hydraulic performance of the twisted tube is better when the Reynolds number is smaller than 10,000.Based on the exper-imental results,correlations for the Nusselt number and friction factor were also obtained.Gao et al.[9]experimentally investigated the heat transfer and flow resistance characteristics of water flow inside twisted tubes with large twist ratio in transition and turbulent flow regime.Nusselt numbers and friction factors for twisted tubes are 1.3e 2.5times and 1.2e 1.5times of those for the smooth tube,respectively.It was also discovered that the Nusselt numbers and friction factors increase with the decrease of twist pitch or with the increase of aspect ratio,which is in agreement with the findings in Ref.[8].Yang et al.[10]studied the heat transfer and flow resistance of fluid flowing inside a twisted elliptical tube in laminar flow regime using the CFD method.The major axis,minor axis and twist pitch of the tube are 23mm,14mm and 320mm,respectively.The Rey-nolds number ranges from 100to 500,and the Prandtl number is less than 200.Results showed that the twisted ellipticaltubeFig.1.Twisted tube section.S.Yang et al./Applied Thermal Engineering 31(2011)2981e 29912982provide a remarkable heat transfer enhancement performance,and the greater the Prandtl number,the better the heat transfer performance.Thefindings about effects of tube structural param-eters(S and A/B)on the heat transfer andflow resistance charac-teristics of the tube were the same with those in Refs.[8,9].Reason for heat transfer enhancement was concluded that the secondary flow induced by thefluid swirling directlyflushes some part of the inner tube wall,temperature gradient near the tube is higher,the distribution offluid velocity and temperature is more uniform, which enhances the heat transfer effectively.Bishara et al.[11]also used the CFD method to obtain the temperature and velocity distribution offluid in the cross section of a twisted elliptical tube with a twist ratio of6.0and an aspect ratio of1.43.According to the temperature and velocity plots,the paper indicates that the secondaryflows promote mixing in the plane normal to the bulkflow direction.This mixing works to maintain a high temperature gradient close to tube wall and then increase the Nusselt number.In the above literatures,heat transfer andflow resistance char-acteristics offluidflow inside the twisted tubes and the inter-tube space have been studied,and wherein tube side is the research emphasis.Experimental and CFD methods were employed,and the workingfluid covered air,diesel oil and water.Effects of tube structural parameters on heat transfer andflow resistance perfor-mance were analyzed,and correlations to predict Nusselt number and friction factor were presented.However,little experimental research was associated with the thermal-hydraulic performance of twisted tubes in laminarflow regime.Equations presented for calculating Nusselt numbers and friction factors had various forms and often there were significant differences among the predicted values for the same twisted tube under the same operational condition.Mechanism of heat transfer enhancement is explored from the traditional point of view,which can be summarized by increasingflow turbulence or decreasing thickness of the devel-oping thermal boundary layer.In view of this,the present work conducts an experimental research on the thermal-hydraulic performance offive twisted elliptical tubes with different struc-tural parameters.The workingfluid is water,and the Reynolds number ranges from around600to55,000,covering the laminar, transition and turbulentflow regime.Correlations for heat transfer andflow resistance are obtained and compared with those existing ones.In addition,temperaturefield and velocityfield of water in TETs are numerically investigated;and the heat transfer enhance-ment mechanism of TETs is further explored from the viewpoint of field synergy principle.3.Experimental apparatus and data reduction3.1.Experimental apparatusA schematic diagram of the experimental apparatus is shown in Fig.2.The experimental apparatus mainly consisted of a cold medium loop,a hot medium loop,a test section and a measure-ment system.The test section was a double tube exchanger.Each tested tube had an effective length of1.75m.The workingfluid on both tube side and shell side was deionized water.The hot water tank had a maximum heating power of20kW and a temperature control system was equipped for it to adjust the heating power to keep a constant water temperature at a givenflow rate,and the hot water temperature can range from30to95 C.Hot water was conveyed to the test section by a centrifugal pump and cooled in the tested tube via counterflow heat exchange with the cold waterTable1Investigations on the twisted tubes with various workingfluid and tube configurations.Sources Tube parameters Workingfluid Tube side correlationsd o(mm)S(mm)A i(mm)B i(mm)S/A oIevlev[4]e12.1e 6.2e16.7air Nu¼0:019Re0:8h1þ0:547=ðs=AÞ0:83if¼0:316h1þ3:27ðs=AÞÀ0:87iReÀ0:256Â103<Re<105Asmantas[5]e12.1e 6.2e12.2airNu¼0:021Re0:8Pr0:4h1þ2:1ðs=AÞÀ0:91i TwT f!nn¼À0:17À0:27Â10À5ðx=d eÞ1:37hðs=d eÞ2:1À109:6if¼0:82ðs=AÞÀ0:63ReÀ0:18 7Â103<Re<2Â105Si[7]19144,192,25021e 6.86,9.14,11.9dieselNu¼0:396Re0:544se!0:161s!À0:519Pr0:33 lg f¼a1þa2lgReþa3ðlgReÞ21000<Re<17,000Zhang[8]25160,200,25024,2614,9e waterNu¼1:50618Re0:51825PrÀ1:2446A ii !1:12252se!À0:32367f¼0:71497Re0:07777PrÀ1:03974A iB i!À0:76212sd e!À0:333937900<Re<26,500Gao[9]19200,300,40019.8,21.2,21.89.4,7.0,5.8e waterNu¼0:034Re0:784Pr0:333B iA i!À0:590sd e!À0:165f¼4:572ReÀ0:521B ii!À0:334se!À0:0825000<Re<20,000Yang[10]19e e e10e17e Nu¼3:66þ0:512Re0:477Pr0:9751ÀB iA i!1:532sB!À0:609100<Re<500S.Yang et al./Applied Thermal Engineering31(2011)2981e29912983flowing on shell side.The upstream tube section of the tested tubewas made long and straight in order to ensure a fully developed flow in tube.An inverted U-bend was mounted on the downstream side to ensure that the tested tube can always be flooded with fluid at any given flow rate.Cold water was pumped through shell side and a plate heat exchanger in a closed loop,heated outside the tested tube and then cooled in the plate heat exchanger by means of water from an independent external cooling tower.A thermo-static control valve adjusts the flow rate of the cooling water to control the inlet temperature of cold water to be constant.The cold water temperature ranged from 30 C to 60 C.Finally,to reduce the heat loss to the ambient,the whole apparatus was well insulated.The experimental apparatus was equipped with a data acquisi-tion system (DAS)based on an Agilent Data Acquisition Unit 34970A and a PC.Parameters required to be measured includes flow rates of hot/cold water,bulk temperatures of hot/cold water at the inlet/outlet of the tested tube/shell,and pressure drop across the tested tube.Two sheathed T-type thermocouples were utilized to measure the hot/cold water bulk temperatures.All thermocou-ples were calibrated in the same constant temperature bath with an accuracy of Æ0.1 C within the tested range.Two turbine flowme-ters were employed to measure the flow rates of hot/cold water,and the uncertainty was estimated as Æ0.2%.Pressure drop across the tested tube is measured using the differential pressure trans-ducer GE Druck PMP 4170with an accuracy of Æ0.04%.For each test run,the whole system was first stabilized for about 30min by continuously running the working fluid.Steady state conditions were assured by checking both temperature and differential pressure readings.The flow rates of hot water and cold water were set to certain values during each test run.The hot water tank was thermostatic with adjustable heating power,thus the hot water could be maintained at a desired temperature at the inlet of the tested tube.Cold water flowing on shell side was heated and then conveyed back to the cold water tank passing through a plate heat exchanger.By adjusting the control valve of the plate heat exchanger,constant temperature of water that flowed back to the cold water tank could be obtained,as well as a constant inlet temperature of the cold water.Besides,the differential pressure across the tested tube was monitored.If the fluctuation of watertemperature at the inlet/outlet of tube/shell side did not exceed Æ0.1 C within 2min,and the fluctuation of the differential pres-sure was less than Æ5%,a steady state for heat transfer and fluid flow was achieved,and then the data collection began.Experi-mental data were acquired by the DAS every 3s,and the average values over 2min were used for calculating both friction factor and heat transfer coef ficient.A smooth tube and five twisted tubes were tested,and all tubes were made from commercially pure copper.The mean outside diameter,wall thickness and length of the smooth tube are 19.02mm,1.01mm and 1880mm,respectively.The twisted tubes were manufactured from smooth tubes and have an elliptical cross section.Geometrical speci fications and pro file of the twisted elliptical tubes are shown in Table 2and Fig.3.3.2.Data reductionConvective heat transfer coef ficients of tube side are obtained by the method suggested by J.A.Meng [12].First,the exponential correlation of Nusselt numbers,Nu,for the outer surface of the tested tube is obtained by varying the flow rate of cold water outside tube and keeping the hot water flow rate inside the tube at its maximum value.Then set the cold water flow rate outside tube at its maximum value and measure the overall thermal resistance.The heat transfer coef ficients for hot water inside tube can be determined by subtracting the convection resistance outside the tube and the conduction resistance through tube wall from the overall thermal resistance.Following are the detailed procedure.Table 2Speci fications of the tested TETs.Tube No.Twist pitch,S (mm)Aspect ratio,A /B 1104 1.602152 1.903192 2.154192 1.7651921.49cooling waterhot water temperature measuring point measurement pressure measuring pointFig.2.Schematic diagram of the experimental apparatus.S.Yang et al./Applied Thermal Engineering 31(2011)2981e 29912984The first step is to obtain the correlation for calculation of theheat transfer coef ficients outside the tube.The logarithmic mean temperature difference,D T LMTD ,between the hot and cold fluid can be derived from Eq.(1)D T LMTD¼ÀT h ;in ÀT c ;out ÁÀÀT h ;out ÀT c ;in ÁlnT h ;in ÀT c ;out T h ;out ÀT c ;in(1)Where T h,in and T h,out are the temperatures of hot water at the inlet and outlet of the tested tube,respectively.T c,in and T c,out are the temperatures of cold water at the inlet and outlet of the shell side,respectively.This temperature difference is kept 10e 25 C in the experiments.Heat transfer rates of tube side and shell side,Q h and Q c are calculated by Eqs.(2)and (3),and their arithmetic mean value is considered as the heat transfer rate of the experiment.Q h ¼_mh c p ;h ÀT h ;in ÀT h ;out Á(2)Q c ¼_m c c p ;c ÀT c ;out ÀT c ;in Á(3)Q ¼Q h þQ c (4)Where _mh and _m c are the mass flow rates of hot and cold water,respectively.The overall heat transfer coef ficient is determined by Eq.(5)U ¼QF o D T LMTD(5)The hot water flow rate inside tube is fixed at its maximum value while the cold water flow rate outside tube is regulated.Fit the heat transfer correlation for the shell side with an exponential relation as the following form of Eq.(6):Nu o ¼c Re 0:8Pr 0:4(6)In the present work,the fouling resistance is neglected since all the tubes are cleaned before each experiment.Then,the overall thermal resistance can be expressed as the sum of the partial thermal resistances corresponding to the inner convection,the heat conduction through tube wall and the outer convection,according to Eq.(7)1U ¼1h o þd o 2k w ln d o d i þd oh i d i(7)Submitting Eq.(6)into Eq.(7),the overall thermal resistance can be written as:1U ¼1cd o k cRe À0:8Pr À0:4 þ d o 2k w ln d o d i þd od i h i (8)Where h i and h o are the heat transfer coef ficient for the tube side and shell side,respectively.d i and d o are the inner diameter and outer diameter of the tube,respectively.k c is the thermal conduc-tivity of the cold water,and k w is the thermal conductivity of tubematerial.dow ln d o iis the conductive thermal resistance across the tube wall.In the experiments,the flow rate of hot water inside the tested tube is fixed at its maximum value and the bulk temperature of the hot water is basically kept constant,therefore the heat transfer coef ficient for the tube side is almost constant.It could be seen from Eq.(8)that 1/U only varies with Re À0.8Pr À0.4linearly.Take X ¼d o =k c Re À0:8Pr À0:4as abscissa and Y ¼1/U as ordinate,one can obtain a linear relation between Y and X by changing the flow rate outside the tube.The constant c can be determined by a curve fitting method.Once c is obtained,the heat transfer coef ficient outside the tube can be calculated by Eq.(9)h o ¼c k coRe 0:8Pr 0:4(9)The internal heat transfer performance can be determined experimentally after the thermal resistance outside tube is known.In such experiments,the flow rate of the cold water outside tube is fixed at its maximum to reduce the external convection resistance while the flow rate of the hot water inside tube is regulated.The overall heat transfer coef ficient U can be decided by Eqs.(1)e (5).Then the heat transfer coef ficient for the tube side,h i ,can be obtained by Eq.(10)1h i¼d i d o 1U À1h o Àd o 2k w ln d od i(10)The Nusselt number inside the tube isNu ¼h i d i k h(11)The friction factor for the tube side is easy to be calculated according to Eq.(12):f ¼d i L $2D p r u 2(12)Where D p is the pressure drop of hot water across the tested tube;L is the tube length;u is the mean flow rate of water inside tube.The uncertainty is estimated with the method suggested by Moffat [13]and Kline [14].As mentioned above,the measurement error of temperature is 0.1 C,the turbine flow meter has a preci-sion of 0.2%,and the measurement accuracy of the differential pressure meter is 0.04%.In addition,the measurement uncer-tainties of tube diameter and tube length are about 0.6%and 0.08%,respectively.The relative error of each physical parameter (e.g.,density,speci fic heat of fluid)is about 0.5%.According to the uncertainty propagation equation,the maximum relative uncer-tainties for the experimental Nusselt number and friction factor are 11.4%and 8.2%,respectively.Fig.3.Photograph of tested TETs.S.Yang et al./Applied Thermal Engineering 31(2011)2981e 299129854.Experimental results4.1.Verification of smooth tubeIn order to validate the reliability of the experimental system, heat transfer andflow resistance characteristics of waterflowing inside a smooth tube werefirst investigated.The Nusselt numbers for laminar,transition and turbulentflow in a smooth tube obtained from the present experiments were compared with predictions of the Sieder e Tate correlation[15,16],Eq.(13),and Gnielinski corre-lation[11,17],Eq.(14),respectively.The experimental friction factors were compared with the Darcy friction factors(f¼64=Re)and predictions of the Petukhov correlation[18],Eq.(15).Nu¼1:86Re1=3Pr1=3fd iL1=3 mfm w0:14(13)Nu¼ðf=8Þ$ðReÀ1000Þ$Pr f1þ12:7ffiffiffiffiffiffiffiffif=8p$Pr2=3fÀ11þd iL2=3!Pr fPr w0:11ð14Þf¼ð1:82lgReÀ1:64ÞÀ2(15) Fig.4shows the comparison of experimental Nusselt numbers and friction factors with those from correlations of Eqs.(13)e(15). The experimental Nusselt numbers for laminarflow agree with the Sieder e Tate correlation with a deviation betweenÀ6.5%and11%, and the average deviation is 1.6%.The experimental Nusselt numbers for transition and turbulentflow agree with the Gnielinski correlation with a deviation betweenÀ6.1%and10.6%,and the average deviation isÀ2.6%.For the friction factors,the deviation is betweenÀ9.3%and3.5%,and the average deviation is1.8%.The results prove the reliability of the experimental system.4.2.Heat transfer performance of the TETsThe heat transfer performance of TETs is presented in the form of Nusselt number.Variation of Nusselt numbers with Reynolds numbers for the tested TETs and smooth tube are given in Fig.5. Reynolds numbers are from around600to55,000,which covers the threeflow patterns of laminarflow,transitionflow and turbulentflow.Referring to Fig.5,one can observe that the Nusselt numbers for all the tested tubes increase as the rise of Reynolds numbers.The increase in Nusselt number indicates an enhance-ment in heat transfer coefficient due to the increase of convection. All the tested TETs have a better heat transfer performance than the smooth tube.TET No.1has the best heat transfer performance amongst thefive TETs and followed successively by TET No.2,TET No.3,TET No.4and TET No.5.It should be noted that the Nusselt number for TET No.5is only slightly higher than that for the smooth tube especially when Reynolds numbers exceed around 10,paring the structural parameters of TET No.3,TET No.4 and TET No.5listed in Table1,one can discover that these three tubes have same twist pitch of192mm but different aspect ratios. The Nusselt numbers increase with the rise of tube aspect ratios.TET No.3has the largest aspect ratio of2.15among these three tubes and has the highest Nusselt number,or best heat transfer performance.Thisfinding about effect of tube aspect ratio on tube heat transfer performance is in agreement with the reports in literatures[8,9].Comparing with TET No.3,both TET No.1and TET No.2have smaller tube aspect ratio but better heat transfer performance,which is due to the smaller twist pitch of TET No.1 and TET No.2.The conventional view believes that the swirling flow,that is the secondaryflow induced by the twisted tube wall,intensifies the turbulence and promotes the radial mixing of the bulkflow.The mixing works to maintain a high temperature gradient close to the tube wall and in turn enhance the heat transfer.Both a larger tube aspect ratio and a smaller twist pitch can lead to a more intensive turbulence and effective mixing to obtain a better heat transfer performance.From the experimental results, one can also discover that the effect of the twist pitch on the heat transfer performance of a TET is more notable than that of the tube aspect ratio.Nu/[Pr1/3(µf/µw)1/3]ReNu/F(f,Pr)ReRefabcFig.4.Experimental results of heat transfer andflow resistance for smooth tube:(a), (b)Nusselt number;(c)friction factor.(a)Comparison of Nusselt numbers in laminar flow regime(b)Comparison of Nusselt numbers in transition and turbulentflow regime(c)Comparison of friction factors.S.Yang et al./Applied Thermal Engineering31(2011)2981e2991 2986The effectiveness of heat transfer enhancement for the TETs relative to the smooth tube was compared in Fig.6.The effective-ness is indexed by a ratio of the Nusselt number for the enhanced tube to that for the smooth tube,in terms ofNu e =Nu s.As shown inFig.6,the Nusselt number ratios for all the tested TETs tend to increase when Reynolds number increase from around 600to 2300,then to decrease with the rise of Reynolds number from around 2300to 10,000,and finally shows a slightly decrease for higher Reynolds numbers.This indicates that the heat transfer enhance-ment of the TETs is more signi ficant at lower fluid velocities cor-responding to the laminar and transition flow regime.The Nusselt number ratios for TET No.1that has the best heat transfer perfor-mance are around 3.9e 4.8for Reynolds numbers from 600to 2300and 2.8e 1.4for Reynolds number higher than 2300.The corre-sponding Nusselt number ratios are 3.6e 4.6,2.5e 1.3for TET No.2,3.4e 4.3,2.2e 1.2for TET No.3,2.8e 3.5,2.0e 1.1for TET No.4and 2.5e 3.0,1.5e 1.0for TET No.5.For the TETs,it is found that the experimental results for the Nusselt number can be correlated with an uni fied equation,which is a function of the Reynolds number (Re),Prandtl number (Pr),twist ratio (S /d e )and aspect ratio(A i /B i ),for Reynolds numbers from 600to 55,000as shown in Eq.(16):Nu ¼0:3496Re 0:615Pr 1=3 A iB i0:490 Sd e À0:394(16)4.3.Hydraulic performance of the TETsThe hydraulic performance of the TETs is presented in the form of friction factor.Variation of the friction factor with Reynolds numbers for the TETs and the smooth tube is presented in Fig.7.In the figure,it is apparent that the friction factors for all the TETs are greater than those for the smooth tube.Friction factors are higher at lower Reynolds number and tend to decrease with the rise of Reynolds numbers from around 600to 15,000,then show a slightly decrease for higher Reynolds numbers.The difference in friction factors for TET No.1to TET No.4are trivial,therefore a partial enlarged drawing was employed to show the details of difference.From the partial enlarged drawing,one can clearly discover that the TET No.3has the greatest friction factors and followed successively by the TET No.2,TET No.4,TET No.1and TET No.5,which is just in accordance with the order of the tube aspect ratios from large to small.This demonstrates that the TET with a larger tube aspect ratio has a larger friction factor,which is in agreement with the finding in previous literatures,Refs.[8,9].The increase of flow resistance in TET can be attributed to the swirling flow caused by the twist channel and the blocking effect of the special tube wall.Just as mentioned above,when fluid flows in the TET with larger tube aspect ratio,a more intensive turbulence is induced to increase the flow resistance.In theory,a smaller twist pitch can improve the blocking effect to cause a greater friction factor.However,the effect of twist pitch on the friction factor for the TETs is not obvious in the present experiment.The effect of tube aspectReN u e /N u sFig.6.Variation of Nusselt number ratio (Nu e /Nu s )with Reynolds number for the TETs.0.000.050.100.150.200.250.30RefSmooth tube Tube No.1Tube No.2Tube No.3Tube No.4Tube No.5Fig.7.Variation of friction factor with Reynolds number for the TETs.Ref e /f sFig.8.Variation of friction factor ratio (f e =f s )with Reynolds number for the TETs.ReN u /[P r 1/3(µf /µw )0.14]Fig.5.Variation of Nusselt number with Reynolds number for various tubes.S.Yang et al./Applied Thermal Engineering 31(2011)2981e 29912987。
摘要空腹桁架钢框架是在钢框架的基础上,通过取消框架中间的柱子来增大结构的使用空间,同时为了不增大各个构件的截面尺寸,在框架的隔层增设腹板柱形成空腹桁架与钢框架组合的结构体系。
由于在钢框架中增设腹板柱形成空腹桁架结构,进一步增强了结构的水平刚度和竖向刚度,同时提高了结构的整体工作性能,进而实现了结构的大跨度。
空腹桁架钢框架结构可以应用于交错桁架结构体系和转换层结构,工程应用比较广泛。
对其受力性能、极限承载力以及结构的破坏模式进行深入的研究具有重要的理论意义和工程应用价值。
本文通过大量的算例分析,探讨空腹桁架层的节间数、节间间距、腹板柱的刚度以及结构的跨度对整体结构的受力性能、极限承载力及破坏模式的影响,分析表明:通过合理的桁架层设计,可以有效的提高结构的竖向刚度和水平刚度,以及结构的极限承载力,并可以使结构的塑性变形首先出现在腹板柱上,这有利于结构内力的重分布,增加结构的延性性能,充分发挥构件的极限承载能力。
在算例分析的基础上,设计合理的实验模型,对其进行极限承载力试验研究,分析结构的荷载-位移曲线以及最终破坏形式。
…………………关键词:Frame and Experiment Study(Structural Engineering )Vierendeel truss-steel frame has wide technical application that can be applied to the staggered truss structure and transfer structure. It has important theory significance and value of technical application to research the behavior,the ultimate load-carrying capacity and structural destroy mode.········· Key Words: vierendeel truss-steel frame, load bearing behavior, elastoplasticanalysis, ultimate load-carrying capacity, experimental research目录摘要·IABSTRACT·II1章绪论空腹桁架钢框架的特点及研究意义·1空腹桁架钢框架的研究现状·3现有研究的不足及本文的研究内容·5第2章空腹桁架钢框架有限元建模及验证2.1 引言·82.2 弹塑性分析方法简介·122.3 ANSYS在空腹桁架钢框架弹塑性分析中的应用·18 2.4 ANSYS分析模型正确性检验·202.5 小结·21第3章空腹桁架钢框架受力性能有限元分析3.1 引言·233.2 空腹桁架钢框架与普通钢框架力学性能对比·26 3.3 影响空腹桁架钢框架力学性能的因素·29第4章空腹桁架钢框架极限承载力试验研究4.1 试验目的·304.2 模型设计依据·324.3 试验概况·354.4 试验过程描述·384.5 试验结果·454.6 小结·55第5章全文总结5.1 主要结论·625.2 有待进一步解决的问题·64参考文献·65后记·68攻读硕士学位期间论文发表及科研情况·6911.1 空腹桁架钢框架的特点及研究意义用空间,同时为了不增大各个构件的截面尺寸,在框架的隔层增设腹板柱形成空腹桁架与钢框架组合的新型钢结构,结构形式如图1.1。
受限空间内空心锥形喷雾-横流掺混规律张海滨;白博峰;刘利;孙慧娟【摘要】在自建的冷态横流-旋流喷雾两相掺混系统实验台上,采用PIV测量了掺混通道内气液两相掺混过程中液滴群的运动特性,获得了掺混流场中不同位置的液滴分布图像与流场结构特性.实验段结构为方腔(横截面尺寸为95 mm×95 mm),喷嘴采用空心锥形雾化喷嘴.对影响掺混效果的主要参数(横流速度、喷嘴雾化压力、喷嘴雾化粒径)进行了详细研究,绘出了最佳掺混效果下各参数关系曲线.掺混过程主要受不同尺度的旋涡结构影响,液滴多富集于旋涡边缘,稳定的大尺度涡不利于掺混.提高掺混效果的途径即是避免流场中出现稳定的大尺度旋涡结构,采用喷嘴前倾布置、增加喷嘴个数、确定合适的横流速度均是提高掺混效果的有效途径.分析方法与研究结果为工程实际应用中掺混室结构的设计及掺混性能的改进提供了依据和参考.%The dispersion and movement features of the hollow cone spray droplets in confined crossflow in a square duct were measured with PIV technology on a self-established cold mixing rig. The droplet dynamics and vortices structures induced in the confined mixing flow field were obtained. The droplet dispersion in the mixing process was mainly influenced by several large-scale vortex structures, such as the counter-rotating vortex pairs (CVPs). The CVPs had a greater centrifugal effect on droplet dispersion because of preferential concentration so the droplets tended to accumulate along the edges of vortex structures. The main parameters affecting the mixing, such as crossflow velocity, atomization pressure and size of spray droplets were discussed and the curves of relationship between them and the best mixing effect were established.The mixing for double nozzles was also investigated and the influences of different injection angles on the mixing were discussed. The results showed that the way to improve the mixing was to avoid the stable large-scale vortex structures which could lead to non-uniform droplet dispersion and concentrations in the mixing flow field by controlling local droplets' contribution and dispersion by convection. Mixing could be enhanced by turning the spray direction against the crossflow, increasing the nozzle number and choosing the appropriate crossflow velocity. The analytical approach and research findings have important practical significance for the mixing chamber design and performance improvement for relevant industrial applications.【期刊名称】《化工学报》【年(卷),期】2012(063)005【总页数】6页(P1354-1359)【关键词】掺混;液滴分布;旋涡结构;PIV【作者】张海滨;白博峰;刘利;孙慧娟【作者单位】西安交通大学动力工程多相流国家重点实验室,陕西西安710049;西安交通大学动力工程多相流国家重点实验室,陕西西安710049;西安交通大学动力工程多相流国家重点实验室,陕西西安710049;西安交通大学动力工程多相流国家重点实验室,陕西西安710049【正文语种】中文【中图分类】V211.1横流中的射流雾化广泛存在于各种工业应用中,如汽轮机液膜冷却、燃烧室燃料射流燃烧、核反应堆降压降温、雾化加湿、水冲压发动机中喷雾以及目前在重油工业中用于热量回收的高品质蒸气发生器等。
北冰洋Arctic Ocean 大西洋Atlantic Ocean南大洋Southern Ocean 太平洋Pacific Ocean洋ocean 印度洋Indian Ocean渤海Bohai Sea 東海East China Sea海sea 海洋marine海域sea areas 黃海Yellow Sea南海South China Sea 边缘海marginal sea潮间帶intertidal zone 潮上帶supratidal zone潮下帶subtidal zone 大陆边缘continental margin大陆架continental shelf 海滨seashore海峡channel 陆地岸线continental coastline 陆海inland sea 河口estuarine水准面geoid 高程起算面base sea level海表面sea surface layer 海平面sea level微表面sea tiny surface layer 平均海平面mean sea level 深度基准面datum for sounding reduction 海图基准面chart datum 岸礁shore reef 堡礁barrier reef岛弧island arc 岛屿islands and islets环礁atoll 珊瑚礁coral reef3 海洋科学工程海洋学marine engineering 海洋地理学marine geography海洋地质学marine geology 海洋地球物理学marine geophysics 海洋化学marine chemistry 海洋技术marine technology海洋经济学marine economics 海洋生态学marine ecology海洋科学marine sciences;ocean sciences海洋生物学marine biology 海洋物理学marine physics海洋学oceanography;oceanology 军事海洋学military oceanography 卫星海洋学satellite oceanography 物理海洋学physical oceanography 区域海洋学regional oceanography 海洋动力学marine dynamics动力海洋学dynamical oceanography 海洋气象学marine meteorology 海洋光学marine optics 海洋声学marine acoustics 水声学acoustics 古海洋学paleoceanography海洋沉积学marine sedimentology 海洋地层学oceanic stratigraphy 海水分析化学analytical chemistry of sea water海洋地球化学marine geochemistry 海洋生物化学marine biochemistry 海洋物理化学marine physical chemistry 河口化学estuarine chemistry 初级生产力primary productivity 海洋生态系(统)marine ecosystems 渔业海洋学fisheries oceanography 海洋生物学marine organism海岸带资源coastal zone resources 海底资源submarine resources 海底矿产【资源】submarine mineral [resources]海水化学资源marine chemistry resources海水【水】资源sea water resource 海洋可再生资源ocean reproducible resources海洋空间【资源】ocean space [resource] 海洋能marine energy resources 海洋生物资源marine biological resources海洋药物marine pharmaceuticals海洋资源marine resources海洋产业ocean industry 海洋经济marine economy 海洋开发marine exploitation 海洋旅游sea tourism海洋农牧化sea farming and ranching 海洋倾倒区dumping zone at sea 海洋渔业marine fishery 海洋资源保护marine resources protection 多金属结核polymetallic nodule, multimetal nodule多金属结壳polymetallic encrustation 多金属泥metalliferous mud 海底地壳热流sea-bottom hot flow 海底砂矿submarine placer海底热液矿床submarine hydrothermal deposits海底油田submarine oil field 反渗透reverse osmosis,RO电渗祈[脱盐] electrodialysis [desalination],ED 海水sea water海水淡化sea water desalination 海水直接利用direct use of seawater 苦咸水bitter and salty water膜[水处理]元件membrane[water treatment] element[水处理]膜[water treatment]membrane水处理设备the equipment for water treatment蒸馏[淡化]法distillation process for desalination海上人工岛marine artificial island海上养殖工程mariculture engineering海上油气开发工程exploitative engineering of offshore petroleumexploitative engineering of gas reservoir海洋工程ocean engineering 海洋工程地质marine engineering geology 海洋工程环境marine engineering environment大陆架公约convention on the continental shelf地理不利国geographically disadvantaged state防倾倒公约prevent dumping convention伦敦倾废公约London dumping convention 公海high seas公海公约convention on the high seas 海洋政策marine polity国际海洋法international law of the sea 海图sea chart海洋功能区划division of marine functional zonation海洋法law of the sea 海洋权right of the sea海域划界delimitation of boundaries on the sea海洋法公约UN Convention on the Law of the Sea领海territorial sea 领水territorial water领海基点territorial sea base point 领海基线baseline of territorial sea 领海宽度breadth of the territorial sea领海的司法管辖权judicial jurisdiction over territorial sea领海通过批准制度ratify regime on territorial sea through领海外部界限outer limit of the territorial sea 水internal waters领海主权sovereignty of the territorial sea 毗连区contiguous zone 群岛海道通过archipelagic sea lanes passage群岛基线archipelagic baseline 群岛水域archipelagic water群岛制度institution of archipelago 群岛原则regime of archipelago 定常基线normal baseline 直线基缝straight baseline专属经济区exclusive economic zone 专属渔区exclusive fishing zone 管理management 海岸带管理coastal zone management 海藉sea area use register 海藉管理management of sea area use register 海上倾倒dumping at sea 岛屿管理management of sea islands 海洋管理marine management海洋行业管理management by marine trades海洋环境管理marine environmental management海洋权益管理marine right and interests management海洋资源管理marine resources management海域使用法律制度legal regime for the sea area use海域使用管理management of the sea area use海域使用论证feasibility assessment of the sea area use海洋环境marine environment海洋环境保护marine environmental protection海洋环境评价marine environmental assessment海洋环境污染损害marine environmental pollution damage海洋环境影响评价marine environmental impact assessment海洋环境质量marine environmental quality海洋环境质量评价marine environmental quality assessment海洋[环境]自然保护区marine[environmental] nature reserve;marine protected area海洋污染控制marine pollution control 海洋污染物marine pollutant 海洋污染物背景值marine pollutant background潮流预报tidal current forecast 海冰预报sea ice forecast风暴潮预警报storm surge forecasting and warning海浪预报ocean wave forecast 海啸警报tsunami forecast海洋环境警报marine environmental alarm海洋环境预报marine environmental forecasting;marine environmental prediction海洋数值预报numerical forecast of marine海洋灾害评估disaster assessment of marine[海洋]地质勘探 geologic prospecting 大面观测sea area observation [海洋]调查oceanographic survey; oceanographic investigation海洋环境监测marine environment monitoring海洋环境监视marine monitoring 定点观测fixed point observation 标准断面调查standard selection investigation定时观测timed observation 断面观测sectional observation辅助观测opportune observation[海洋]常规监测continuous observation海洋连续观测continuous observation[海洋]遥感[观测] [marine]remote sensing[observation][海洋]走航观测[ocean]cruising observation海洋反演数据oceanographic inversion data海洋历史数据(信息、资料)oceanographic history data (information、material) 海洋实测数据oceanography observed data海洋实时数据oceanography timely data标准体系standards system 海洋标准marine standard海洋标准化oceanography standardization ; marine standardization技术法规technical regulation 海洋计量oceanographic metrology 国家法定计量单位national legal unit of measurement[海洋计量器具的]检定verification[of a oceanographic measuring instrument] 海洋[特殊]量marine quantity 海洋要素marine elements 海洋[特殊]量值marine value[of a marine quantity]参比性能特性reference performance characteristic附加误差additive error 海洋测量仪器oceanographic instrument [海洋测量仪器的]计量性能metrological characteristic [of a oceanographic instrument][海洋测量仪器的]准确度accuracy [of a oceanographic instrument [海洋测量仪器]响应时间response time [of a oceanographic instrument] [海洋测量仪器]响应特性response characteristic [of a oceanographic instrument][海洋测量仪器]影响量influence quantities [of a oceanographic instrument][海洋测量仪器]准确度等级accuracy class [of a oceanographic instrument]海洋仪器设备oceanographic instruments and equipments[海洋仪器设备]安全性safety [of a oceanographic instrument][海洋仪器设备]参考条件reference conditions [of a oceanographic instrument];reference conditions [of a marine instrument][海洋仪器设备]额定操作条件rated operating conditions [of a oceanographic instrument];rated operating conditions [of a marine instrument];[海洋仪器设备]极限条件limiting conditions [of a oceanographic instrument];limiting conditions [of a marine instrument];[海洋仪器设备]互换性interchangeability [of a oceanographic instrument];interchangeability [of a marine instrument];[海洋仪器设备]环境适应性environment applicability [of a oceanographic instrument];environment applicability [of a marine instrument];[海洋仪器设备]可靠度reliability [of a oceanographic instrument];reliability [of a marine instrument];[海洋仪器设备]可靠性reliability [of a oceanographic instrument];reliability performance[of a marine instrument];[海洋仪器设备]可信性creditability [of a oceanographic instrument];creditability [of a marine instrument];[海洋仪器设备]配套性suitability [ of a oceanographic instrument ]suitability [of a marine equipment][海洋仪器设备]通用要求general specifications[of a marine equipment] general specifications [ of a oceanographic instrument ] [海洋仪器设备]相容性compatibility [of a marine equipment] compatibility [ of a oceanographic instrument ][海洋仪器设备] 性能特性performance characteristic [ of a oceanographic instrument ]performance characteristic [of a marine equipment]基本误差intrinsic error有证参考物质certified reference material ,CRM(缩写)海水sea water 海面水温sea surface temperature(SST)现场温度insitu temperature 等温线isotherm温度深度图bathythermogram 暖水舌warm water tongue冷水舌cold water tongue 暖水圈warm water sphere冷水圈cold water sphere 盐度salinity1978实用盐标Practical Salinity Scale 1978(PSS 78)绝对盐度absolute salinity 实用盐度practical salinity等盐线isohaline 盐舌salinity tongue盐指salt finger 盐【水】楔salt water wedge热盐结构thermohaline structure 海水密度sea water density现场密度insitu density 密度超量density excess海水比容specific volume of sea water 现场比容insitu specific volume 比容偏差specific volume anomaly 热比容偏差thermosteric anomaly 铅直稳定度vertical stability 对流混合convective mixing涡动混合turbulent mixing 潮混合tidal mixing【混合】增密cabbeling,caballing 温跃层thermocline主【温】跃层main thermocline 季节性【温】跃层seasonal thermocline 盐跃层halocline 密度跃层pycnocline波internal wave 拟置层inversion layer均匀层homogeneous layer 混合层mixed layer ,mixing layer大洋对流层oceanic troposphere 层化海洋stratified ocean冷涡cold eddy 暖涡warm eddy水型water type 水团water mass水系water system 表层水surface water次表层水subsurface water 中层水intermediate water深层水deep water 底层水bottom water沿岸水coastal water 中央水central water南极绕极水团Antarctica Circumpolar Water Mass北极水Arctic water ; North Polar Water副热带模态水subtropical mode water黄海冷水团Huanghai(Yellow Wea)Cold Water Mass长江冲淡水Changjiang Diluted Water ; Changjiang River Plume 赤道辐合带Equatorial Convergence Zone 海洋锋oceanic front细结构finestructure 微结构microstructure 海面斑带slick 海洋湍流oceanic turbulence双扩散double diffusion 海水状态方程sea water state equation 海色sea colour 水色water colour海水透明度sea water transparency 海流ocean current总环流general circulation 大洋环流ocean circulation热盐环流thermohaline circulation 热盐对流thermohaline convection 深渊环流abyssal circulation 赤道流equatorial current漂流drift current 西风漂流west wind drift南极绕极流Antarctic Circumpolar Current西边界流western boundary current 风海流wind-driven current地转流geostrophic current 密度流density current坡度流slope current 信风海流trade wind current季风海流monsoon current 补偿流compensation current 逆流counter current赤道逆流Equatorial Counter current赤道潜流Equatorial Under current太平洋赤道潜流Pacific Equatorial Under current大西洋赤道潜流Atlantic Equatorial Under current印度洋赤道潜流Indian Equatorial Under current上升流:upwelling 下降流:downwelling沿岸流:coastal current 渤海沿岸流:Bohai Coastal Current 黄海沿岸流:Huanghai(Yellow Sea)Coastal Current东海沿岸流Donghai (East China Sea)Coastal Current南海沿岸流:Nanhai (South China Sea)Coastal Current顺岸流longshore current 表层流surface current次表层流subsurface current 深层流deep current底层流bottom current 暖流:warm current黄海暖流:Huanghai (Yellow Sea)Warm current暖流:Taiwan Warm current黑潮:Kuroshio南海暖流:Nanhai (South China Sea)Warm current对马海流:Tsushima Current 湾流:Gulf Stream寒流:cold current 亲潮:oyashio余流:residual current 流涡:gyre流环ring 体积运输volume transport动力方法:dynamic method 无运动面:level of no motion位势高度:potential height 风因子wind factor埃克曼漂流Ekman drift current 埃克曼深度Ekman depth埃克曼层Ekman layer 埃克曼螺旋Ekman spiral埃克曼输运Ekman transport 埃克曼抽吸Ekman pumping 底摩擦层bottom friction layer 斜压海洋baroclinic ocean正压海洋barotropic ocean 中尺度涡mesoscale eddy卷吸entrainment 波流wave-induced current(wave current)裂流rip current 海浪ocean wave风区fetch 风时wind duration最小风区minimum fetch 最小风时minimum duration等效风区equivalent fetch 等效风时equivalent duration波高wave height 有效波significant wave波周期wave period 波陡wave steepness波龄wave age 波候wave climate毛细波capillary wave 重力波gravitational wave孤立波solitary wave 边沿波edge wave陆架波shelf wave 潜水波shallow water wave 深水波deep water wave 浅水系数shoaling factor短峰波short—crested wave 长峰波long-crested wave规则波regular wave 不规则波irregular wave波浪爬高swash height 船行波ship wave余摆[线]波trochoidal wave 椭[圆]余[弦]波oidal wave椭[圆]余摆[线]波elliptic trochoidal wave 斯托克斯波stokes wave 俘获波trapped wave 碎波breaker , surf崩碎波(崩顶碎波)spilling breaker 激碎波(激散碎波)surging breaker 卷碎波(卷跃碎波)plunging breaker 碎波带surf zone风浪wind wave 白冠whitecap波群wave group 充分成长的风浪fully developed sea 波级wave scale 波峰线wave crest line海浪谱ocean wave spectrum 方向波谱directional wave spectrum 海浪反射ocean wave reflection 海浪折射ocean wave refraction 海浪绕射ocean wave diffraction 涌浪swell先行涌forerunner 潮汐tide 潮位tide level高潮high water (HW) 低潮low water (LW)潮差tidal range 涨潮flood 落潮ebb大潮spring tides 小潮neap tides 双高潮double flood 双低潮double ebb 平潮still tide 停朝water stand 潮升tidal rise 引潮力tide-generating force引潮势tidal potential 天文潮:astronomical tide 假想天体:fictitious body 平衡潮:equilibrium tide分潮:tidal component tidal constituent 半日潮:semi-diurnal tide全日潮:diurnal tide 太阴潮:lunar tide 太阳潮:solar tide 回归潮:tropic tide 分点潮:equinoctial tide 潮龄:tide age 分潮日:constituent day 分潮时:constituent hour太阴潮间隙:lunar tide interval 倍潮:overtide复合潮:compound tide 辐射潮:radiational tide混合潮:mixed tide 日不等【现象】:diurnal inequality潮流tidal current 旋转流rotary current往复流alternating current 转流turn of tidal current潮余流tide-induced residual current 潮流椭圆current ellipse潮波tidal wave 旋转潮波系统amphidromic system,amphidrome无潮点amphidromic point 潮internal tide 假潮seiche涌潮tidal bore 钱塘江涌潮qiantang reiver tidal bore同潮图cotidal chart 潮能tidal energy气象潮meteorological tide 风暴潮storm surge海啸tsunami 异常水位anomalous sea level平均海面mean sea level 海面sea level海图基准面datum of chart 潮汐基准面tidal datum半潮面half-tide level 潮汐调和分析harmonic analysis of tide 潮汐调和常数harmonic constants of tide潮汐非调和常数nonharmonic constant of tide 潮汐表tide tables 最高天文潮位highest astronomical tide(HAT)最低天文潮位lowest astronomical tide(LAT) 海冰sea ice陆源冰ice of land origin 固定冰fast ice 流冰pack ice浮冰floating ice 浮冰群floating ice massif 岸冰shore ice 冰脚ice foot 底座冰ground ice 锚冰anchor ice 初生冰new ice 冰壳ice rind 莲叶冰pancake ice 尼罗冰nilas ice 初期冰young ice 一年冰first-year ice 老年冰old ice 冰期ice cover 海冰密集度ice concentration 冰缘线ice edge 裸冰bare ice 雪盖冰snow covered ice平整冰level ice 变形冰deformed ice 重叠冰rafted ice堆积冰hummocked ice 冰丘hummock 冰脊ridge冰原ice field 碎冰brash ice 冰间水道lead,lane冰间湖polynya 冰架ice shelf 冰山iceberg冰岛ice island 水下冰脚ram海洋(性)气候maritime climate,marine climate海—气相互作用air-sea interaction南方涛动southern oscillation,SO 厄尔尼诺海—气边界过程air-sea boundary process海—气热交换ocean-atmosphere heat exchange海洋气团maritime air mass 海面反照率sea surface albedo海陆风land and sea breezes 海雾sea fog 海龙卷waterspout蜃景mirage 海洋生物学marine bio-acoustics海洋声速sound velocity in the sea 浅海传播shallow water propagation 深海传播deep sea propagation 传播损失transmission loss传播异常propagation anomaly 汇聚区convergence zone海水声吸收sound absorption in sea water 声道sound channel表层声道surface sound channel 深海声道deep sea sound channel 混合层声道mixed layer sound channel 海底声反射bottom reflection 掠射角grazing angle 海面混响surface reverberation 海底混响bottom reverberation 体积混响volume reverberation 海底散射bottom scattering 体积散射volume scattering 深海散射层deep scattering layer.DSL 海洋噪声sea noise海洋环境噪声ambient sea noise 海洋生物噪声marine biological noise 流体动力噪声hydrodynamic noise 风生噪声wind-generated noise 回声测距echo ranging 水声换能器underwater acoustic transducer 声呐sonar (sound navigation and ranging)声遥感acoustic remote sensing 水中对比度contrast in water海面向上辐射radiation from the sea surface海洋光学遥感oceanic optical remote sensing水中对比度传输contrast transmission in water水下“窗口” underwate r window 衰减长度attenuation length 海色指数sea color index 水中能见度visibility in water海洋辐射传递radiative transfer in ocean海水电导率conductivity of sea water海水磁导率permeability of .sea water海水离子迁移率ion mobility of sea water海洋电磁场marine electromagnetic field潮感电磁场tide-induced electromagnetic field浪感电磁场wave-induced electromagnetic field11 / 11。
管道内壁粗糙度对沿程阻力影响的FLUENT 数值模拟分析姚雪蕾;袁成清;付宜风;白秀琴【摘要】针对在海底管道的设计阶段准确获取沿程阻力的问题,采用FLUENT软件运用数值模拟的方法,分析粘性流体在管道中的摩阻损失与管道内壁粗糙度的关系,将计算结果与理论结果进行对比。
结果显示,除流态从水力光滑区到混合摩擦区间有一个过渡阶段存在误差外,其余都吻合良好,证实输油管道的内壁粗糙度只在混合摩擦区对摩阻有较大影响,改善管壁面粗糙度可以减小阻力。
若流态处于水力光滑区到混合摩擦区之间,计算摩阻系数仅靠经验公式是不合适的,应考虑采用数值模拟计算的方法。
%Aiming at the problem of obtaining accurately the on-way resistance of submarine pipeline at the design stage, numerical simulation method is adopted to analyze the relationship between loss of viscous fluid friction and wall roughness of the pipeline based on paring the calculated results with theoretical results and the actual situations, the results show there is a good agreement, except for the flow pattern transiting from the hydraulic smooth region to the mixed friction region.It is confirmed that the friction coefficient is strongly influenced by pipeline wall roughness only in the turbulent mixing friction re-gion.In this case, reducing the surface roughness of the wall can cut down the resistance.If the flow pattern transits from the hy-draulic smooth region to the mixed friction region, it is inappropriate to calculate friction coefficient only by the empirical formu-las, and numerical simulation is the method that should be considered.【期刊名称】《船海工程》【年(卷),期】2015(000)006【总页数】7页(P101-106,110)【关键词】输油管道;粗糙度;沿程阻力;FLUENT;数值模拟【作者】姚雪蕾;袁成清;付宜风;白秀琴【作者单位】武汉理工大学能源与动力工程学院可靠性工程研究所,武汉430063; 武汉理工大学船舶动力工程技术交通行业重点实验室,武汉430063;武汉理工大学能源与动力工程学院可靠性工程研究所,武汉430063; 武汉理工大学船舶动力工程技术交通行业重点实验室,武汉430063;武汉理工大学能源与动力工程学院可靠性工程研究所,武汉430063; 武汉理工大学船舶动力工程技术交通行业重点实验室,武汉430063;武汉理工大学能源与动力工程学院可靠性工程研究所,武汉430063; 武汉理工大学船舶动力工程技术交通行业重点实验室,武汉430063【正文语种】中文【中图分类】TE832;P756.2随着计算流体动力学的发展,利用FLUENT分析粘性流体在管道中的阻力特性已经得到了很多实用性的成果,如针对粗糙的管壁[1-4]或者是产生局部阻力损失的典型阀件(突扩管、三通管、弯管等)[5-6],通过数值模拟的方法可以模拟出常规实验无法得到的不同流场的各种信息。
(封皮)题目姓名2014年2月(书脊即封皮侧面需打印)题目北京理工大学中图分类号:UDC分类号:论文题目作者姓名姓名学院名称软件学院指导教师XXX答辩委员会主席XXX 教授申请学位工程硕士学科专业软件工程学位授予单位北京理工大学论文答辩日期2014年2月TitleCandidate Name:XXXSchool or Department: School of SoftwareFaculty Mentor: XXXChair, Thesis Committee:Prof. XXXDegree Applied: Master of Engineering Major:Software Engineering Degree by: Beijing Institute of Technology The Date of Defence:February,2014研究成果声明本人郑重声明:所提交的学位论文是我本人在指导教师的指导下进行的研究工作获得的研究成果。
尽我所知,文中除特别标注和致谢的地方外,学位论文中不包含其他人已经发表或撰写过的研究成果,也不包含为获得北京理工大学或其它教育机构的学位或证书所使用过的材料。
与我一同工作的合作者对此研究工作所做的任何贡献均已在学位论文中作了明确的说明并表示了谢意。
特此申明。
签名:日期:关于学位论文使用权的说明本人完全了解北京理工大学有关保管、使用学位论文的规定,其中包括:①学校有权保管、并向有关部门送交学位论文的原件与复印件;②学校可以采用影印、缩印或其它复制手段复制并保存学位论文;③学校可允许学位论文被查阅或借阅;④学校可以学术交流为目的,复制赠送和交换学位论文;⑤学校可以公布学位论文的全部或部分内容(保密学位论文在解密后遵守此规定)。
签名:日期:导师签名:日期:摘要摘要是一篇具有独立性和完整性的短文,应概括而扼要地反映出本论文的主要内容。
包括研究目的、研究方法、研究结果和结论等,特别要突出研究结果和结论。
硕士学位论文排版格式和装订要求一、论文编排格式要求1、封面①“分类号”(宋体,小4号):依据《中国图书馆分类法》标出论文的学科属性,宋体,小4号,加黑。
②“密级”(宋体,小4号):密级一般分为“无”、“秘密”、“机密”、“绝密”,请根据实际情况填写,我校绝大数硕士学位论文无密级。
宋体,小4号,加黑。
③“单位代码”(宋体,小4号):我校代码为10430。
Times New Roman体,小4号,加黑。
④“学号”(宋体,小4号):请根据研究生学生证号填写。
Times New Roman体,小4号,加黑。
⑤“论文题目”(黑体,小3号):控制在25字以内,宋体,小2号,加黑。
⑥“研究生姓名”(黑体,小4号):按研究生录取时省招考院信息库姓名填写。
宋体,小4号,加黑。
⑦“专业名称”(黑体,小4号):以国务院学位委员会批准的专业目录中的专业为准,一般为二级学科。
宋体,小4号,加黑。
⑧“指导教师姓名”(黑体,小4号):在导师姓名后空一格填写导师的职称。
宋体,小4号,加黑。
⑨“学院”、“入学日期”、“论文提交日期”(黑体,小4号):如实填写。
宋体,小4号,加黑(数字用Times New Roman体)。
⑩论文书脊部分中“论文题目”、“”字样,黑体,5号;论文题目,黑体,5号,加黑,居中。
2、扉页①页面设置:上下各为2.5cm,左右各为3cm,装订线0.5cm,页眉、页脚各为1.5cm.②“硕士学位论文题目”,黑体,4号,居中。
③论文题目,黑体,小2号,加黑,居中。
若该课题受到资助,论文题目下另起一行,注明“某某资助项目(项目号)”,楷体_GB2312,4号,居中。
④其余部分均为宋体,小4号。
3、声明①“原创性声明”和“学位论文使用授权声明”,黑体,小3号,居中。
②声明内容:楷体_GB2312,小4号,行距23磅。
③页面设置:上下各为2.5cm,左右各为3cm,装订线0.5cm,页眉、页脚各为1.5cm.④学位论文作者、导师签名及日期位置须用蓝、黑笔手写。
An experimental study on the effect of air bubble injection on the flow induced rotational hubN.M.Nouri,A.Sarreshtehdari *Applied Hydrodynamics Laboratory,Department of Mechanical Engineering,Iran University of Science and Technology,Farjam Street,Narmak 14464,Tehran,Irana r t i c l e i n f o Article history:Received 30April 2008Received in revised form 31August 2008Accepted 19September 2008Keywords:Skin friction reduction Turbulence modification Microbubble Rotary partsa b s t r a c tModification of shear stress due to air bubbles injection in a rotary device was investigated experimen-tally.Air bubbles inject to the water flow crosses the neighbor of the hub which can rotate just by water flow shear stresses,in this device.Increasing air void fraction leads to decrease of shear stresses exerted on the hub surface until in high void fractions,the hub motion stopped as observed.Amount of skin fric-tion decrease has been estimated by counting central hub rotations.Wall shear stress was decreased by bubble injection in all range of tested Reynolds number,changing from 50,378to 71,238,and also by increasing air void fraction from zero to 3.06%.Skin friction reduction more than 85%was achieved in this study as maximum measured volume of air fraction injected to fluid flow while bubbles are distinct and they do not make a gas layer.Significant skin friction reduction obtained in this special case indicate that using small amount of bubble injection causes large amount of skin friction reduction in some rotary parts in the liquid phases like as water.Ó2008Elsevier Inc.All rights reserved.1.IntroductionAir bubbles have been used in various fields such as purification of water quality,promoting the growth of shellfishes [1],improv-ing physiological activation and some physiochemical properties [2].In recent three decades,using bubbles especially in small sizes (microbubbles)to decrease skin friction has been increased.In a moving object in an incompressible field,like as water,especially in low Froude numbers more than 50%of drag components are re-lated to skin friction [3].So,making decrease in this drag compo-nent leads to save large amount of energy and decrease environmental pollution as a second result that is the obvious rea-son of the importance of micro bubble drag reduction (MBDR).However,some researchers achieved more drag reduction by com-bining this method by another,such as polymer drag reduction [4].Bubble drag reduction has been a topic of research for a long time.In 1973McCormick and Bhattacharyya [5]towed a 1.22m long,fully submerged hull in a towing tank.They created small bubbles around the hull using electrolysis and found that signifi-cant drag reduction can be obtained using this technique.Madavan et al.measured local skin friction reduction in a microbubble-modified,zero-pressure-gradient,turbulent bound-ary layer and observed integrated skin friction reduction of greater than 80%,also they found that drag reduction persist up to 60–70boundary layer thicknesses down stream of the injection region [6,7].Pal et al.presented an optical survey of micro bubble boundary layer to study bubble characteristics and their trajectories [8].Latorre et al.[9]injected micro bubbles to the vertical sides of a high speed model with a non-wetting coating and achieved overall drag reduction of 4–11%.Sanders et al.[10]performed experiments on a 12.9m long hydraulically smooth flat plate on which a near-zero-pressure-gra-dient flat plate turbulent boundary layer was generated.Their re-sults showed that liquid layer next to the surface limits the amount and persistence of bubble drag reduction,and this phe-nomenon may be active even when buoyancy pushes bubbles to-ward the test surface.They also showed that the amount of drag reduction strongly depends on the near-wall void fraction and the importance of bubble buoyancy.Chanson [11]investigated air injection in an open channel flows.The results exhibit smaller friction losses than non-aerated flows.It is shown that the drag reduction process is linked with the presence of an air concentration boundary layer next to the channel bottom.Fujiwara et al.[12]conducted an experimental study in vertical upward driven bubbly pipe flow with void fractions of 0.5%and 1.0%to elucidate the effect of dispersed bubble size on turbulence modification.The high concentration of bubbles in the vicinity of the wall induced a reduction of the fluctuation velocity intensity of the liquid.0894-1777/$-see front matter Ó2008Elsevier Inc.All rights reserved.doi:10.1016/j.expthermflusci.2008.09.008*Corresponding author.Tel.:+982173912982;fax:+982177240488.E-mail address:sarreshtedari@iust.ac.ir (A.Sarreshtehdari).Experimental Thermal and Fluid Science 33(2009)386–392Contents lists available at ScienceDirectExperimental Thermal and Fluid Sciencej o ur na l h om e pa ge :w w w.e ls e v ie r.c om /lo c at e/et fsMurai et al.[13]experimentally investigated bubble distribu-tions organized in a vertical Taylor–Couetteflow and demon-strated that the wall shear stress decreases as bubbles are injected in all the tested range of Re from600to4500.In2006,Ortiz-Villafuerte and Hassan[15]generated hydrogen and oxygen microbubbles by electrolysis and achieved Drag reduc-tions up to40%.Wu et al.[16]used porous medium to generate microbubbles and their experiments in pipe showed more drag reduction(26%) when they used1l m porous medium than while10l m porous medium was used at the sameflow speed(around23%).Recently,the bubble size dependency of the average skin fric-tion in the intermediate bubble size condition was observed by injecting bubbles with sizes range from2to90l m approximately to the boundary layer thickness in a horizontal turbulent channel flow[17].In these experiments,the local skin friction decreased drastically in the rear part of individual large bubbles,and rapidly increases after the bubble’s rear interface passes.Although some hypothesis have been presented about mecha-nisms playing a role in bubble injection drag reduction such as transport effects associated with mixture density,turbulence en-ergy extraction associated with breakup,diminished turbulence production and bubble deformation but none of them have been confirmed definitely yet[14].In order to clarify the mechanism of drag reduction caused by microbubbles,Kitagawa et al.[19]experimentally investigated the turbulence structure of a horizontal channelflow with micro-bubbles.They proposed a new system which simultaneously mea-sures the liquid phase and the dispersed bubbles,based on a combination of particle tracking velocimetry(PTV),laser-induced fluorescence(LIF)and the shadow image technique(SIT).Using this system,the turbulence characteristics of theflowfield includ-ing measurements for both phases,and the bubble effect on the turbulence were quantified.Modeling of microbubbles is a challenging task because of va-gue mechanism of MBDR,but many researchers have been en-gaged with it[18–21].Lu et al.[18]investigated the effect of a few relatively large bubbles injected near the walls on the wall drag in the‘‘minimum turbulent channel”by DNS and detected significant reduction of the wall drag by suppression of streamwise vorticity due to deformable bubbles.Ferrante and Elghobashi[20]used numerical simulations for a microbubble-laden spatially developing turbulent boundary layer (SDTBL)and compared the amount of skin friction reduction due to the presence of the bubbles for two Reynolds numbers.Their re-sults show that increasing the Reynolds number decreases the per-centage of drag reduction.Although DNS of microbubble turbulent boundary layer provide insight into the physical phenomena responsible for the drag reduction,it is not currently feasible to use it practical purposes,thus other computational methods have been used for bubble modeling.Kunz et al.[21]introduced a new model for MBDR based on an Eulerian two-fluid model.Emphasis is placed on the modeling strategies required to capture measured volume fraction,bubble size,and bubble velocity distribution,as well as skin friction drag reduction.Also,a two-dimensional single phase computationalfluid dynamics(CFD)model of microbubble-ladenflow over aflat plate was used to assess the role of mixture density variation in micro-bubble drag reduction[22].The study indicated that simple mix-ture density variation effect plays one of the major roles in the microbubble drag reduction phenomenon.In this paper,the effect of air bubble injection on skin friction has been investigated experimentally.Rotational behavior of cen-tral hub was obtained tofind operation of device in various void fractions for favorable designed regimes.In this device micro bub-bles with the size of smaller than300l m was generated[23].The variation of skin friction by bubbles injection in various void frac-tions was investigated on the rotational hub of aflow induced ro-tary device and rotational velocity of the hub was considered as an effective parameter related straightly to skin friction and changes inflowfield.According to the results,skin friction reduction more than85%was achieved.2.Experimental setupThe apparatus which used in these tests is a symmetric cylindri-cal device including a central rotational hub with132mm in diam-eter and an external shell with the height of160mm,diameter of 217mm and thickness of8.8mm.Fig.1illustrates a schematic sec-tion of the device.Inner cylinder(rotational hub)is observable in this device during tests.In this device,water enters it via six diagonal nozzles with diameter of10mm and angle of61;it mixes with air coming from 24vertical straight holes with diameter of2mm at the bottom of the device.Passing a rotational trace around central rotational hub, large air bubbles are broken up to tiny bubbles.In the other words, liquid and gas are injected between shell and hub through diagonal and vertical holes,respectively,and exit circumferentially through outlet.Bubbles are broken in three different stages in this device. Atfirst stage,they are broken due to the injection trough holes. During the second stage,rotationalflow makes bubbles to pass a longer path.In this stage,high velocityflow increases separation between bubbles,reducing coalescence and turbulentflow breaks them continuously.In the last stage,large shear stresses caused by narrow outlet break the bubbles for the last time.Angles of diagonal holes of water are selected so that the tan-gential velocity of inlet water is much more than radial velocity in order to make central hub rotate(Fig.2).NomenclatureC f skin friction coefficient(–)h height of hub(m)Qflow rate(m3/s)r radius(m)T integrated torque(Nm)RRV relative rotational velocity(–) SFR skin friction reduction(–)t time(s)u linear velocity(m/s)Greek symbolsa air void fractionb rotational velocitys shear stress(N/m2)l viscosity(N s/m2)Subscriptsa airw water0single phase state(water)N.M.Nouri,A.Sarreshtehdari/Experimental Thermal and Fluid Science33(2009)386–392387Fluidflow subjected to high centrifugal acceleration.Superficial calculated velocities up to6m/s are tested in this device so that the centrifugal Froude number covers a range around3.Therefore, centrifugal acceleration is much larger than the gravity.It leads to bubble movement to inner cylinder and drag reduction increased by more local void fractions.In high void fractions and large Froude number conditions,the substantial velocity of the gas phase that biases to the inner side of the device is slower than the total superficial velocity because the liquidflow is allowed to pass through the outer side and so resem-bles a radial stratifiedflow.In that case the drag reduction is not the action to the structure of boundary layer but is the effect of gas–liquid stratification.Two bearings have been used to support the central hub and promote the tendency of rotation.In single phaseflow and computer simulations integrated force can be computed using shear stress,(Eq.(1)),s¼l d ud tð1ÞThe force was obtained by integrating shear stress on the surface of hub as following,(Eq.(2)),F¼ZsÁd A¼2pZs rðhÞd hð2ÞHence effective torque yielded,(Eq.(3)),T¼2pZs r2ðhÞd hð3ÞIt is pointed out that only the component of the wall shear stress vector in planes perpendicular to the axis of the hub affects the rotational forces acting on the hub.The other component of the wall shear stress,the component with a vector lying in planes that ex-tend through the axis of the hub,does not directly affect the rota-tion of the hub.Therefore,as a consequence,the measured hub rotation rate can only be used to infer how this one component of the skin friction force was affected by gas injection.Fig.3shows the experimental setup.The device was installed at the bottom of a cylindrical tank with depth of1.5m and volume of 1.57m3.The tank has four transparent windows to set light and take images.Each window is in front of the other one and direction of each pair of windows is perpendicular to the others.Two win-dows have the height of1m and width of0.3m,these are set near the bottom of the tank.The second pairs of windows with the height of1.2m and width of0.3m are set0.5m upper than the bottom of the tank.Since the second two windows are cover the region located exactly after outlet of two windows are cover the re-gion located exactly after outlet of the apparatus,these ones were used forfilm-taking and photography.Water is entered thewater Fig.2.Straight and diagonal holes trough which air and water injected to thesystem.Fig.3.Experiment setup device(A,waterflowmeter;B,waterflow control valve;C,experiment tank;D,the device;E,membrane;P,pump;F,the rotameter;G,airflowcontrolvalve).Fig.1.Schematic of rotary device.388N.M.Nouri,A.Sarreshtehdari/Experimental Thermal and Fluid Science33(2009)386–392nozzles via a centrifugal pump(P).Flow rate is measured by aflow meter and is controlled using a valve(B).A compressor with max-imum pressure of500kPa is used to provide and to inject pressur-ized air,after passing through a pressure regulator and airflow meter,to straight air holes of device.Before air enters the device, itsflow rate is measured by a calibrated rotameter(F)and con-trolled by a valve(G).The pressure of injected air was adjusted to110±5kPa in all experiments.Some qualitative tests show that bubbles are located close en-ough to the hub to affect on skin friction in this device but they do not make a layer of gas because they are distinguish in all of ob-tained images.Bubbles leaving the apparatus gradually coalesced as they rose and made large bubbles.So,at the top of the tank,a membrane(E) was used to separate air from water in order that inlet water feed-ing to theflow meter and the pump was free of air bubbles,Fig.4.3.Test proceduresMaximum roughness of central hub,with an effective diameter of132mm,was estimated to0.003.Hence,tangential component of shear stress between waterflow and hub external surface was the only excitation force to hub rotation.Shen et al.[14]showed that water impurities,like as salt and other surfactant solution can affect on micro bubble size distribu-tion and skin friction changes consequently,therefore in these tests purity of water is constant in all of test steps.To investigate bubble injection effect on skin friction,two series of test was conducted.Atfirst,air injection or airflow rates were fixed and waterflow rate was decreased in eight steps.Then,at the second series,the last waterflow rates werefixed and airflow rate increased in each step.In each step,the hub wasfilm-taken by a digital CCD camera, Sony DSC W30,with ability of30fps,movie resolution of 640Â480pixels and with sensitivity of ISO1000.Since the maxi-mum rotational velocity of hub was under200rpm,using this camera seems logical.Duration time of eachfilm-taking took be-tween30s and60s depending on the rotational velocity of the hub.The time was longer for the tests in which the rotational velocity was less than the others.In addition,there was a gap time about60s.between each two consequent test in order that all parameters,such as airflow rate and waterflow rate,were stable and constant.Also rotational velocity achieves to constant rotary speed,in this time,as observed in various cases.A reflector on the hub allowed the rotational speed to be mea-sured from the camera data,see Electronic Annex1in the online version of this article.Duringfilm-taking,flow rates of water and air were recorded in order to calculate average void factions of each test.The rotational velocity was determined easily by recorded time between each two observations of the reflector in each experiment. In these experiments,relative error of rotational velocity is less than0.01.4.Results and discussionAll the tests were carried out in turbulentflow with a volumet-ric waterflow rates changing from0.0039to0.0056(m3/s),to achieve various Reynolds numbers.The apparatus adjustments confined waterflow rates in above range.The data of the Reynolds numbers changing from50,378to71,238calculated based on diameter of the pipe feeding the apparatus,the bulk velocity esti-mated by ventury meter and the viscosity of water.Also,the rate of air injected toflow was changed from0to0.00015(m3/s)in order tofind out the effect of void fraction variations on skin friction.The void fraction inside the apparatus gap was not controlled but the gasflow rate was measured by a gasflow meter.The aver-age void fraction in the test section is estimated by,(Eq.(4)),a¼Q aQ wþQ að4Þwhere Q a and Q w are airflow rate and waterflow rate,respectively. The uncertainty of airflow rate is0.001according to airflow meter, and that of waterflow rate is0.01in relative error.Therefore,the measurement uncertainty of the average void fraction is10À2.Compressed air with back pressure of approximately110kPa which entered to the bottom of the apparatus leaded to create bub-bles by small sizes while waterflow circulates in the setup.Above water and airflow rates were controlled by two valves afterflow meters and make void fraction changed from0%to 3.06%.Small bubbles,with predominant size of smaller than or about 300micron in diameter,were produced either in minimum or maximum airflow rates as shown in Fig.5and Fig.6.Bubbles’sizes were determined using image processing method.To accurately determine the bubble size a canny edge detector algorithm was implemented tofind the boundaries of the captured bubbles in each image.Overlapped bubbles and bubbles without clearly de-fined edges were not included in the bubble size analysis.In this method,the measured bubble size is accurate to±1pixel,i.e. 20l m to determine the bubble size distribution,700,bubbles were counted from each set of drag reduction images.Obtained re-sults are presented in Table1for minimum and maximum tested voidfractions.Fig.4.Membrane which was used to separate water frombubbles.Fig.5.Sample of generated microbubbles(numbers scale unit:cm).N.M.Nouri,A.Sarreshtehdari/Experimental Thermal and Fluid Science33(2009)386–392389Increasing void fraction more than about 4%caused two prob-lems preventing high void fractions in experiments in this setup.First,the volume of the produced bubble was increased so that it hided the reflection signs behind the bulky bubble clouds and dis-allowed surface of the hub to be observed and photographed.Hence,the rotational velocity of hub was not able to be calculated by image processing.Secondly,in this special setup and in void fractions of lower than 10%,the hub stopped completely.This sub-ject was investigated by increasing void fractions more than 4%in each test and reducing it suddenly.Stationary hub was observed in all repeated tests as above procedure for the void fractions chang-ing from 4%to 10%.Fig.7illustrates hub rotational velocity based on water flow rates changes,in various air injection rates.This figure illustrates that by increasing water flow rates,in each air injection rate,the rotational velocity rise up and vise versa.In this figure,the approx-imately parallel lines,in constant air flow rate,indicates the similar rotational behavior in single and two phase flow,although it is important to consider that the slope of each line changes and de-creases by increasing the air flow rates.In the other word,not only hub rotational velocity but also its variation versus water flow rate is decreased by increasing air flow rate.A linear trend line based on least square method among experimental data gives an absolute slope bond changing from 2.41to 1.10for single phase flow and air injection of 0.1494l/s,respectively.Fig.8presents the results of hub rotational velocity changes in the constant water flow rates by increasing air flow injection rates.As shown in this figure,rotational velocity is obviously decreased by increasing air injection or void fraction.By dividing rotational velocity of each water flow rate to its maximum value in single phase condition,relative rotational velocity (RRV)was extracted which is one of the operating charac-teristics of this apparatus,(Eq.(5)),RRV ¼x x 0ð5ÞA series of repetitive tests were conducted to investigate RRV changes in constant void fractions.The results of these tests indi-cate a normal distribution with mean values and standard devia-tions shown in Table 2.Fig.9indicates relative rotational velocity versus void fraction.In this figure,mean values of RRVs were extracted from Table 2and the errors bars show deviations of mean values.By considering this amount based on Student T -test,all of data with the probability of more than 95%will coincide with mentioned bound.The amount of RRV is decreased by increasing void fraction as shown in Fig.9.Since number of rotations of hub is a significant parameter for the apparatus operation,this figure can be usedasFig.6.Percentage of lower and near upper limits of void fraction.Table 1Statistic of generated bubbles’size Void fraction Min.size (l m)Max.size (l m)Predominant size (l m)Low 61670171High116725227390N.M.Nouri,A.Sarreshtehdari /Experimental Thermal and Fluid Science 33(2009)386–392an anticipator of rotational velocity of hub shown as a trend line by a polynomial of second order.The amount of C f and C f0can be obtained easily if shear stress is assumed to change by rotational velocity linearly.Dry tests,of ro-tary device,confirm direct relation between torque(shear stress effect)on rotary cylinder and rotational velocity.So,the percent-age of skin friction reduction(SFR)was determined via following equation,(Eq.(6)),SFR¼1ÀC fC f0ð6ÞTable3presents the percentage of skin friction reduction in each Reynolds number.Each row includes the relative skin friction reductions in comparison with single phase condition of the same Re number.Results in this case,indicate small percentage of air void fraction,less than5%,maybe cause strong effect onflow induced motion resulted by skin friction.In this case,this table indicates small percentage of air void fraction,less than5%,maybe cause strong effect onflow induced motion resulted by skin friction.The physical mechanisms and the fundamental theory of MBDR was not yet clarified completely,but several mechanisms have been suggested as playing a role in the observed drag reduction, including transport effects associated with mixture density,which Reynolds stress being diminished in the turbulent boundary layer, and turbulence energy extraction associated with vortex breakup, which diminished turbulence production associated with dilata-tion caused by local gradients of bubble concentration in the vicin-ity of the quasi streamwise vortical structures.In similar studies,experiment studies,drag reduction observed by shear stress changes or changes of near wall velocity profile in the other words.Also this phenomenon can be monitored by changes of total imposed force to a constant body in the neighbor offlow with existence of constant relative velocity.In this work imposed shear stress on rotary hub decreased by bubble injection which leads to decreasing constant rotational velocity.5.ConclusionExperimental study on a rotational hub was conducted to inves-tigate the effect of air bubble injection on the skin friction reduc-tion and device operation consequently.In experimental setup waterflow tangential jets prepare rotational motion of hub due to skin friction offluidflow imposed on external surface of rota-tional hub.In this study,rotational velocity of central apparatus’hub was considered as a sign of skin friction,based on known behavior of device,and its changes were investigated.The follow-ing results have been obtained in these tests:The tangential water jets cause skin friction on the external sur-face of hub and rotate it by constant velocity.So,waterflow rate increasing,in each void fraction,leads to rotational velocity increasing and vise versa.The same behavior of rotational velocity was obtained either by increasing waterflow rates in constant air flow injections or by decreasing airflow injection in constant water flow rates.Moreover airflow rate alters,not only affect on hub rotation but also change its variation,versus waterflow rates.This variation,slope,decrease by increasing airflow rate.Small values of void fraction significantly influence on skin fric-tion which creates rotational velocity.Obtained results indicated that void fractions less than4%caused around90%decrease of skin friction in this special setup.This method,micro bubble drag reduction(MBDR),can be used to avoid skin friction resistant forces,affecting on rotating parts of machines.Bubbles size and distribution,of gas injection and background flow properties are so vital parameters in skin friction reduction that have been proposed for next steps of this study.AcknowledgmentsThe Research has beenfinanced by Applied Hydrodynamics Laboratory of Mechanical Engineering Department,Iran University of Science and Technology.The authors would like to thank Ap-plied Hydrodynamics Laboratory for facilities and fund and also ex-press their appreciation to Ms.Maghsoudi,Mr.Maleki Mehrabadi, Mr.Arabshahi and Mr.Allahyari for experimental assistance. Appendix A.Supplementary dataSupplementary data associated with this article can be found,in the online version,at doi:10.1016/j.expthermflusci.2008.09.008. References[1]H.Ohnari,Fisheries experiments of cultivated shells using microbubblestechnique,J.Heat Trans.Soc.Jpn.40(160)(2001)2–7.[2]A.Serizawa,T.Inui,T.Yahiro,Z.Kawara,2003,Laminarization of micro-bubblecontaining milky bubblyflow in a pipe,in:Proceeding of3rd European–Japanese Two-Phase Flow Group Meeting,Certosa di Pontignano,pp.21–27.[3]Y.Tahara,F.Stern,A large-domain approach for calculating ship boundarylayers and wakes for nonzero Froude number,put.Phys.127(1996) 398–411.[4]S.Deutsch, A.A.Fontaine,M.J.Money,H.L.Petrie,Combined polymer andmicrobubble drag reduction on a largeflat plate,J.Fluid Mech.556(2006) 309–327.[5]M.E.McCormick,R.Bhattacharyya,Drag reduction of a submersible hull byelectrolysis,Naval Eng.J.85(1973)11–16.Table2Test results normal distributionVoid fractions0% 1.23% 1.88% 2.92% 3.06%Mean values10.460.300.130.11Standard deviations00.0250.0150.0160.025Table3Skin friction reduction(%)Reynolds number Void fraction(%)0 1.22 1.86 2.89 3.0650,378–52.0068.0084.0088.0060,595–54.0869.3986.7390.8265,932–55.1070.4187.7690.8271,238–53.6869.4787.3791.58Average–53.7269.3286.4690.30N.M.Nouri,A.Sarreshtehdari/Experimental Thermal and Fluid Science33(2009)386–392391。
Experimental study on turbulent mixing of spray droplets in crossflowBo-Feng Bai *,Hai-Bin Zhang,Li Liu,Hui-Juan SunState Key Laboratory of Multiphase Flow in Power Engineering,Xi’an Jiaotong University,Xi’an 710049,Chinaa r t i c l e i n f o Article history:Received 5December 2008Received in revised form 12May 2009Accepted 14May 2009Keywords:Spray CrossflowInjection angle Mixing degreea b s t r a c tCentrifugal spray injected at various angles in gas crossflow has been studied experimentally using PIV visualization system and image-processing techniques.Experiments were carried out inside a rectangular duct (95mm Â95mm in cross-section)at ambient temperature and pressure,with different gas Rey-nolds numbers (vary from 12,900to 45,000)and three injection angles (60°,90°and 120°).The spray angle of the centrifugal nozzle is 80°,with D 32of 80l m.The instantaneous images of droplets distribu-tion and the values of the line-averaged D 32at different positions on the cross-sections along the flow field for each condition were obtained,and their flow field configurations were achieved.Quantitative assessments of mixing degree between two phases for different injection angles were determined using a spatial unmixedness parameter.It is found that the addition of droplets into the gas crossflow enhanced the turbulence intensity of the gas crossflow and caused different-scale vortices.The flow field structure,to a great extent,is dependent on the injection angle.The entrainment and centrifugal force of large vor-tex lead to uneven droplet distribution and moreover influence the mixing of droplets and gas crossflow.A better mixing result can be obtained with the injection angle of nozzles of 60°.Ó2009Elsevier Inc.All rights reserved.1.IntroductionWater sprays are extensively applied in engineerings such as dust control,fire fighting,nuclear reactor core cooling,spray dry-ing,air scrubbing and evaporative cooling.In a typical spray,pres-surized water is injected into nozzles from which it emerges as a thin bell-shaped hollow cone which disintegrates into polydisperse drops moving at different velocities.This droplet motion in air causes heat and mass transfer through evaporation and cooling.Much research effect has been devoted to the crossflow problem.Therefore,an understanding of the dynamics of drop–air interac-tion is crucial for optimizing this process.The break-up and dispersion of the liquid jet in subsonic flow have been studied by Heister et al.[1]and Li and Karagozian [2].Fuller et al.[3–6]studied the flow character of liquid jet in sub-sonic crossflow.The flow fields for different injection angles,jet velocities and Mach number of airflow were obtained.It was agreed that the injection angle has influences on flow characteristics.By using laser measurement technology such as laser-Doppler velocimeter (LDV),Planar Laser Induced Fluorescence (PLIF)and particle imaging velocimetry (PIV),detailed microscopic features including velocity field,turbulent energy distribution,vorticesstructure,etc.were obtained by Ajersch et al.[7–12].The tech-niques for the improvement of the mixing effect between the jet and the crossflow were suggested.An airblast-atomized spray jet into a crossflow has been well re-searched and documented.A systematical discussion was found in Ref.[13]which interpreted the atomization and transportation processes which determined the dispersion of an airblast-atomized spray jet into a subsonic crossflow of air,and proposed the mech-anism of these processes and their effect on the penetration and dispersion.Another similar spray mode,aerated liquid jet,has also been studied quite extensively.The spray structures and spray penetration heights in the crossflow at various angles were inten-sively discussed,experimentally and theoretically [14–17].However,for centrifugal nozzle,the liquid first emerges through which is in the form of a sheet which quickly disintegrates into droplets due to aerodynamic instabilities in the ‘break up re-gion’which interact strongly with the atmosphere.Just down-stream in the ‘spray region’,the liquid is only in the form of droplets.Considerable effort has been directed towards the inves-tigation of the break-up region and just beyond [18–22].On the other hand analyses of the behavior of droplets further away are relatively scarce,especially in a crossflow.Ghosh et al.[23]have developed a analytical models for all the practical ranges of the ra-tio of the jet speed to the crossflow speed to study the fundamental problem in fluid mechanics that how fluid jets were deflected and deformed.Kachhwaha et al.[24,25]studied the movement and evaporation behavior of the spray droplets in both parallel and counter-flow configurations.They proposed a two-dimensional0894-1777/$-see front matter Ó2009Elsevier Inc.All rights reserved.doi:10.1016/j.expthermflusci.2009.05.002*Corresponding author.Address:State Key Laboratory of Multiphase Flow in Power Engineering,Xi’an Jiaotong University,No.28,Xianning West Road,Xi’an 710049,China.Tel.:+862982668260;fax:+862982669033.E-mail address:bfbai@ (B.-F.Bai).Experimental Thermal and Fluid Science 33(2009)1012–1020Contents lists available at ScienceDirectExperimental Thermal and Fluid Sciencejournal homepage:www.else v i e r.c o m /l o c a t e /e t fsmodel which agreed well with the experimental results.Sureshku-mar et al.[26,27]conducted a more precise experiment and simu-lation,and concluded the relationship between the arrangement of nozzles of different size,pressures and cooling.By using DPDA and PIV system Wang et al.[28]studied the two-phaseflow in the counter-flow spray saturator for HAT cycle,and presented the sim-ulation of the moving distance of water droplets in the counter-flow air.They measured the transient velocityfields and obtained the spatial change of the droplet size spectrum in theflowfield to correlate droplet size–velocity correlation.Porcheron et al.[29] investigated the heat and mass transfer between the spray and the upward hot gasflow in the cooling tower using PIV equipment. They measured the detailed characterization of the two-phaseflow and analyzed the mixing effects between the spray droplets and the gas owing to the spray activation.It is commonly agreed that all of these previous research efforts are conducive to the under-standing of the interaction between the crossflow and the spray droplets.Still many researchers studied the macro-characteristics of the interaction between the spray and the crossflow,for example the heat transfer between two phases and the velocityfield along the crossflow direction.In their researches,the mixing space was large enough to allow of the negligibility of the effect of wall.However, in practice,there are also many applications that the two-phase mixing process is conducted in limited space.Unfortunately, according to investigations,no previous detailed studies have been conducted on vortex dynamic mechanisms of two-phase mixing, droplets distribution on cross-section and features offlowfield, which are crucial for the knowledge of the mechanism of two-phase interaction.When the nozzle is injected into the confined crossflow at certain angles,the asymmetric structure and the influ-ence of the wall will make the mixing more complex,which will definitely highlight the significance of the research efforts in this field.2.Experimental system and method2.1.Experimental systemThe experimental system,as shown in Fig.1,consists of a gas loop,a water loop,a test section,an adjustable-coordinate experi-ment device(Fig.2)and a water tank.The air from the compressor flows through the regulator valve and then into the test section and the branch gas channel,respectively.Wire mesh and honey-comb are located at the inlet of the tunnel for the ensurement of a uniform velocity profile throughout the test section.The dis-charged water from the pump passes via theflowmeter with the uncertainty of1%,and thenflows through the regulating valves and into the nozzle.The mixing between the spray droplets and the crossflow is thus achieved in the test section.The test section is0.095Â0.095m in the cross-section with a length of1.0m,and is made of the transparent polymethyl meth-acrylate,as shown in Fig.3.The demountable nozzles are installed on the top and bottom(see Fig.1).Based on the comparison of the atomization effect by various types of centrifugal nozzles,commercially available nozzle(made in H.Ikeuchi&Co.,Ltd.(1/4MK B80100S303-RW))which has a desirable atomization effect is adopted here.The volumefluxis Fig.1.Schematic diagram of the experimentalsetup.Fig.2.The adjustable-coordinate experimental device.B.-F.Bai et al./Experimental Thermal and Fluid Science33(2009)1012–102010130.0226m 3/h at the pressure of 0.7MPa,with D 32(the Sauter Mean Diameter (SMD ))of 80l m and the spray angle of 80°(see Fig.4).The needle valve is located before the nozzle to control the water flow rate precisely and ensure the stability of the water pressure.The injection angle of the nozzle is shown in Fig.5.The nozzle ped-estals are available for different injection angles (60°,90°and 120°).The nozzles are installed at 0.5m downstream from the inlet of the test section.2.2.Measurement systemThe instantaneous velocities of water droplets are determined by the FLOWMASTER PIV system,which has the function of pro-cessing digital images to get the fluid velocity vector field,YAG la-ser (200mJ,8ns pulse)and CCD camera (Nikon ImagerPro4M,15Hz,2048Â2048pixels,cross-correlation).A laser sheet,approximately 1mm thickness,is arranged to illuminate particle distribution on the center plane,along the x -axial.The CCD camera is installed perpendicularly to the illuminated region.To obtain the velocity field and the droplets distribution and the size of the spray droplets on the cross-sections of the turbulentmixing flow field.Problems as follows need to be resolved.(1)The occurrence of the liquid film on the wall disturbs the produc-tion of clear images.(2)The mixture of gas and droplets effects the work of the CCD which is positioned at the rear of the outlet of the experimental section.(3)The transparent duck wall weakens the laser intensity.(4)The adjustment of the light sheet decreases the stability of the system.The solutions to these possible prob-lems are as follows:(1)17slots,as shown in Fig.3,are devised on the side of the experimental section to remove the liquid film.The width of the slot is 2mm,and the interval of the adjacent slots is 20mm.When one section is measured other slots are sealed.(2)A branch gas channel is installed to change the outlet flow direc-tion for the prevention of the CCD lens from being polluted,as shown in Figs.1and 2.(3)Matt black paint is applied on the inner wall of the test section for the enhancement of the laser intensity.(4)An adjustable-coordinate experimental device is designed to make the adjustment of the experimental system easily which avoided the adverse influence owing to the frequent adjustment of the PIV system and the Malvern instrument.The mean gas flow rate is measured by vortex shedding flow-meter with a variation of less than 2%.Mass flow of water is mea-sured using an electromagnetic flowmeter.Keller pressure sensors are applied to control the pressure of spray at a fixed value of 0.7MPa.ADLINK data acquisition card is used to record and store the experimental data.2.3.Experimental methodThe droplets and crossflow have a fierce interaction in the test section.A laser sheet is derived from the second harmonic of a Nd–YAG pulsed laser (532nm).The spray,developing along the axial direction of the test section,is lightened by the laser sheet along the measured cross-sections successively.The scat-tered light is collected at a vertical angle by the synchronized CCD camera located at the rear of the crossflow.An injector/la-ser/CCD electronic control configuration allows collecting images in different intervals from the Start of Injection (SOI).In our exper-iments,40instantaneous images are acquired for each cross-sec-tion at five frames per second.Image-processing software (MATLAB Ò)is employed to obtain time-averaged profiles.Digital image post-processing allows extraction of the droplets distribu-tion and vectors of mixing flow field versus injection angles,Re of gas.Experiments are carried out at the ambient temperature of 20°C,with the Reynolds numbers (gas crossflow)varying from 12,900to 45,000(the corresponding gas flow rate vary from 65to 227m 3/h)with the injection angles of 60°,90°and 120°from the negative direction to the crossflow.The temperature of water is 20°C.The experimental conditions are shown in Table 1.2.4.Image-processing methodThe spatial distribution of droplets can be used to describe the mixing effect between the droplets and the crossflow.An unmixed-ness parameter U that quantifies the temporal unmixedness was first defined by Danckwertz [30],then a modified version U susedFig.3.Measurement cross-sectionschematic.Fig.4.Spray angle of nozzleschematic.Fig.5.Injection angle of nozzles schematic.Table 1Experimental conditions.Number of nozzle Injection angle (°)Re (gas)19012,90025,700–45,00026025,70032,10045,00090–25,70032,10045,000120–25,70032,10045,0001014 B.-F.Bai et al./Experimental Thermal and Fluid Science 33(2009)1012–1020to quantify concentration mixing in a planar image was employed by Liscinsky et al.[31].Vranos et al.[32]validated the use of U s by showing that the value of U calculated across a planar image from an ensemble of instantaneous intensity levels at each pixel pro-duced a value that was nearly identical to the spatial variance of an image of time-averaged intensities.Leong et al.[13]put forward a more logical parameter of spray quality (SQ)for liquid jet inject into a crossflow,and examined the influence of the mean (D 32)value which indicate the atomization quality (D 32,avg /D 32,max )in a spray,the extent of area (EA),which represents spray coverage across a certain area.They calculated the spatial unmixedness on different conditions and obtained a reasonable mixing characteristic.In addition,the mixing character-istic were not changed obviously after they considered the influ-ence of the size of spray droplets measured by using the Planar Laser Induced Fluorescence (PLIF)and the Phase Doppler Interfer-ometry (PDI),which were could not be adopted in our experiment owing to the restricted mixing space.So in this paper,the spatial unmixedness,which can indicate the mixing effect to a large ex-tent,is used.The spatial unmixedness of an m Ân image with a plane-aver-aged intensity of I avg is defined as formulas (1)and (2).U s ¼I varI avg ð1ÀI avg Þð1ÞI var¼1m Ân Xm i ¼1X n j ¼1ðI ði ;j ÞÀI avg Þ2!ð2ÞHere,I (i ,j )is the intensity in a zone.Further details about these questions can be obtained in [13].In this paper,the division of the cross-sections is shown in Fig.6.The zone number is 676(26Â26).3.Results and discussionTime-averaged images of the cross-section along the flow field on different experimental conditions are obtained (see Fig.7for an example).In these images,the shape of two-phase distribution is distinct and symmetrical,which proves that the influence of slots on the flow field is small enough and our experimental meth-ods are soundly justified.Through a set of images,the whole devel-oping process of mixing flow can be clearly read.More detailed analysis about the mixing of spray droplets in the crossflow is available in the following sections.3.1.Study of mixing process for a =90°When a cross-stream of air is introduced to the liquid jet sys-tem,the counter-rotating vortex pair (CVP)is produced owing to the interaction between the crossflow and the jet flow [13].Similar phenomenon occurs in the crossflow-centrifugal spray system,where the CVP on the cross-section of the flow field exist on ac-count of the spray-crossflow interaction,as shown in Figs.8–10.With the development of the mixing,the CVP becomes bigger along the crossflow,which causes the air to be entrained,mean-while the small droplets are sucked into the entrained air and dis-persed further into the cross-section.In the case of single nozzle (see Fig.9),the big droplets with large initial velocity will hit the both sides of the wall owing to the limited space of the rectangular duct,the air disturbed by these droplets will generate the vortex in the corner,as shown in Fig.9(Re =12,900,x =0m).When the crossflow velocity is low,the vortices in the corners will disappear in a short distance.As the velocity increases,the initial position of the vortices will move backward and the sustained distance will be greater.At the same time,more droplets will enrich in the middle of the bottom owing to the entrainment of the vortices (see Fig.9(Re =25,700)).However,as the velocity of the crossflow increases further,the vortices are less likely to occur because the droplets cannot afford to carry the airflow to generate large vortex (see Fig.9(Re =45,000)).In the case of double nozzles (see Fig.10),ow-ing to the opposite directions of the air caused by the droplets from different nozzles,the two current meet in the middle sectionandFig.6.Schematic diagram of imagesegmentation.Fig.7.Time-averaged images in every measured cross-section for a =90°(doublenozzles).Fig.8.Single centrifugal nozzle spray in crossflow.B.-F.Bai et al./Experimental Thermal and Fluid Science 33(2009)1012–10201015unlike the case of single nozzle the big vortices cannot be formed in the corners.So there only two apparent CVPs occurs on the crossflow of the flow field.With the development of the mixing,the droplets on the cross-section first distribute in the shape of ‘‘”and then in the shape of ‘‘”owing to the effect of the wall and the CVPs.Furthermore,with the velocity of crossflow increase,the development of CVPs become slowly along the flow field and correspondingly the distance required for a desirable mixing be-tween the two phases increases.The vortices exert direct influences on the distribution of drop-lets.The particles trapped in the center of vortices are less dense than that in the edge,because the centrifugal effect propels the particles to move towards the edge [33].On one hand,vortexes help carry the droplets.On the other hand,strong vortexes lead to a non-uniform distribution.The vector and streamline diagram of typical cross-sections on different conditions are shown in paring Figs.9and 10,the relationship between the vor-tices and the droplets distribution can be seen clearly.The development characters of the vorticity along the flow field on different velocities conditions are shown in Fig.12.The vorticity decrease quickly in the region close to the nozzles where the inter-action between the droplets and the crossflow is very strong and then keep invariable in a long distance which means a stable mix-ing flow field is achieved.As the velocity of the crossflow increase,the vorticity increase in the initial mixing stage but the difference is small in the stable stage.3.2.A comparison between different injected angles (double nozzles)Ensemble-averaged images for a =60°and 120°are shown in Figs.13and 14,respectively.The CVPs also occur on the cross-sec-tions of the flow field on the two conditions.Along the flow field,the CVPs development with its size increase and become unstable faster compared with that of the conditions of a =90°.When a =60°,the sustained distance of the CVPs is shorter,and the atten-uation of vortex is faster,meanwhile on the cross-sections thepar-Fig.9.Time-averaged images at different cross-sections for a =90°(singlenozzle).Fig.10.Time-averaged images at different cross-sections for a =90°(double nozzles).1016 B.-F.Bai et al./Experimental Thermal and Fluid Science 33(2009)1012–1020ticle achieves uniformity in its distribution quickly.When a =120°,the locations of the two CVPs move upward and downward,respectively (see Fig.11c–f)to the wall and more droplets concen-trate in both sides and the middle of the cross-section but the droplets near the wall (up and down)decrease.With the velocity of the crossflow increase,the CVPs decrease in its size and develop-ment slowly.When a =60°,the water contrastream injection makes the ini-tial mixing between the gas and the droplets in advance.The inter-action between two phases is enhanced and the entrainment for more air into droplets is intensified which leads to a promoted mixing and a more uniform distribution for droplets on the cross-sections.So the optimum mixing effect occurs when a =60°.In contrast,when a =120°,the mixing effect is less.It is worth noting that the most stable structure of the flow field and the greatest sustained distance for CVPs can be find when a =90°.3.3.Mixing degree diagramThe mixing degrees for the three injection angles (double noz-zles)are plotted in Figs.15and 16.According to these figures,we can see that the mixing effect get optimized along the flow field.When a =60°,the spatial unmixedness (U s )is less than that of a =90°and 120°,which means that a better mixing between two phases is accessible when a =60°.The same conclusioncanFig.11.Vector and streamline diagram:(a)and (b)for a =90°(single nozzle);(c)and (d)for a =90°(double nozzles);(e)and (f)for a =120°(double nozzles).(a)Re =25,700,x =0.06m;(b)Re =45,000,x =0.14m;(c)Re =25,700,x =0.1m;(d)Re =32,100,x =0.22m;(e)Re =25,700,x =0.1m and;(f)Re =32,100,x =0.12m.Fig.12.Vorticity profile for different gas velocities (a =90°,doublenozzles).Fig.13.Time-averaged images at different cross-sections for a =60°.B.-F.Bai et al./Experimental Thermal and Fluid Science 33(2009)1012–10201017be drawn by observing the droplets distribution images on differ-ent conditions.Therefore,it can be conducted that nozzles inject at a =60°en-trains the gas crossflow fluid more efficiently,leading to a more ra-pid and compact mixing.This phenomenon bear an analogy to that of the jet flow,Donghee et al.[34]researched the flow field of tur-bulent jets injected at various inclinations into a uniform crossflow using flow visualization and image-processing techniques,and found that a jet with negative injection angle (in the present paper a <90°)entrains the crossflow fluid more efficiently.It is suspected that the optimum mixing effects will occur when nozzle injects at a proper acute angle,and the optimum injection angle will be fur-ther studied in our subsequent work.3.4.Mean D 32comparisonThe line-averaged D 32at different positions on the cross-sec-tions along the flow field for three injection angles (double nozzles)have been measured by using the Malvern (2604LC)instrument.The test positions on the cross-section were shown in Fig.17.The evolution of the line-averaged D 32is shown in Fig.18.A fairly constant mean D 32along the direction of the flow field is ob-tained when a =60°,which means that the mixing flow field be-comes relatively stable in a short distance after the nozzles.When a =90°and 120°,a stable mixing stage is achieved further than that of a =60°,as can be deduced from the curves which exhibiting a decreasing trend of the mean D 32in the first and then becoming stable in Fig.18a andb.Fig.14.Time-averaged images at different cross-sections for a =120°.Fig.15.Spatial unmixedness for Re =32,100.Fig.16.Spatial unmixedness for Re =45,000.Fig.17.Schematic diagram of the test positions on the cross-section.1018 B.-F.Bai et al./Experimental Thermal and Fluid Science 33(2009)1012–1020Owing to the influence of the wall,little droplets are rebound by the airflow near the wall rger droplets move toward the walls owing to the large inertia.These features result in a phenom-enon that many large droplets are concentrated near the wall and small droplets are located far away from the wall,as shown in Fig.18.When a =120°,compared with other injection angles,the values of mean D 32at the bottom of the cross-section are smaller owing to the collision and the bonding between substantial large droplets and the wall.4.ConclusionsAn experimental system for the mixing of spray droplets in a gas crossflow is established.Several techniques are proposed to solve the two-phase flow measurement problems emerged from which the PIV system is used to obtain the mixing structure of the flow field.Quantitative assessments of mixing degree between two phases for different conditions were determined.The conclu-sions about the mixing characteristics are as follows:1.The CVP is produced by the introduction of a gas crossflow into a liquid centrifugal spray system.The CVP causes air to be entrained and the small droplets following the entrained air are pushed further into the cross-section.Along the flow field,the CVP increases in size and become unstable gradually and the mixing effect becomes better.With the velocity of the cross-flow increase,the size of the CVP decreases and the stability are enhanced;meanwhile the sustained distance becomes greater.2.In the case of double nozzles,the injection angle imposes greater influences on the mixing between the two phases than the crossflow velocity in our experimental parameters.When a <90°(see a =60°),the interaction between the gas and the droplets is enhanced and the mixing is promoted.Correspond-ingly,the optimum mixing effect can be achieved when a =60°among three injection angles.In addition,it is worth noting that,the most stable of the flow field structure and the greatest sustained distance of the CVPs can be found when a =90°.3.The entraining effect and centrifugal force of the vortices lead to the inhomogeneous distribution of the droplets,i.e.more drop-lets at the margin of the vortex and fewer droplets in the center.The uniform mixing is obtained after the disappearance of the CVPs.Therefore,it is suspected that a more desirable mixing can be achieved by preventing the development of the vortices (CVPs).4.Many large droplets are concentrated near the wall and small droplets are located in the center of the cross-sections of the flow field.Since the heat transfer between the two phases in high temper-ature environment,such as droplet evaporation,will complicate the mixing characters between spray droplets and gas crossflow,the experimental work will be further studied to understand the deep mechanism of two-phase interaction in more practical conditions.AcknowledgmentThis work was financially supported by the National Nature Sci-ence Foundation of China for Creative Research Groups under the Contract No.50821604.References[1]S.D.Heister,T.T.Nguyen,A.R.Karagozian,Modeling of liquid jets injectedtransversely into a supersonic crossflow,J.AIAA 27(1989)1727–1734.[2]H.S.Li,A.R.Karagozian,Breakup of a liquid jet in supersonic crossflow,J.AIAA30(1992)1919–1921.[3]R.P.Fuller,P.K.Wu,Effects of injection angle on atomization of liquid jets intransverse airflow,J.AIAA 38(1)(2000)64–72.[4]T.Inamura,N.Nagai,Spray characteristics of liquid jet traversing subsonicairstreams,J.Propul.Power 13(2)(1997)250–256.[5]P.K.Wu,K.A.Kirkendall,Spray structures of liquid jets atomized in subsoniccrossflow,J.Propul.Power 14(2)(1998)173–181.[6]P.K.Wu,K.A.Kirkendall,Breakup processes of liquid jets in subsonic crossflow,J.Propul.Power 13(1)(1997)64–73.[7]P.Ajersch,J.M.Zhou,S.Ketler,M.Salcudean,I.S.Gartshore,Multiple jets in acrossflow:detailed measurements and numerical simulations,ASME J.Turbomachinery 119(4)(1997)330–342.[8]T.F.Fric,A.Roshko,Vortical structure in the wake of a transverse jet,J.FluidMech.279(1994)1–47.[9]B.A.Haven,M.Kurosake,Kidney and anti-kidney vortices in crossflow jets,J.Fluid Mech.352(1997)27–64.[10]D.Han,V.Orozco,Gross-entrainment behavior of turbulent jets injectedobliquely into a uniform crossflow,J.AIAA 38(9)(2000)1643–1649.[11]S.H.Smith,M.G.Mungal,Mixing structure and scaling of the jet in crossflow,J.Fluid Mech.357(1998)83–122.[12]H.Johari,Penetration and mixing of fully modulated turbulent jets incrossflow,J.AIAA 37(7)(1999)842–850.[13]M.Y.Leong,V.G.McDonell,G.S.Samuelsen,Mixing of an airblast-atomized fuelspray injected into a crossflow of air,NASA/CR-2000-210467.[14]K.C.Lin,P.J.Kennedy,Spray penetration heights of angled-injected aerated-liquid jets in supersonic crossflows,ASME J.AIAA 194(2000)10–13.parison of the mean D 32for the different injection angles at various downstream (M:middle,B:bottom).(a)a =60°,(b)a =90°and ,(c)a =120°.B.-F.Bai et al./Experimental Thermal and Fluid Science 33(2009)1012–10201019。