7890A -Agilent气相色谱仪标准操作培训
- 格式:ppt
- 大小:3.60 MB
- 文档页数:72
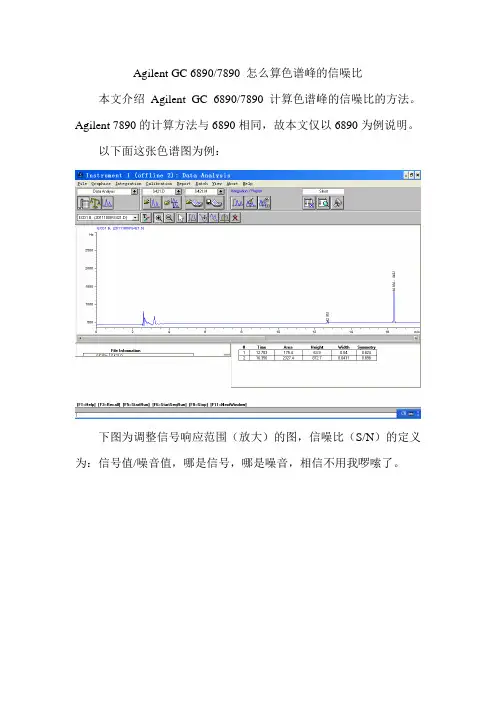
Agilent GC 6890/7890 怎么算色谱峰的信噪比本文介绍Agilent GC 6890/7890计算色谱峰的信噪比的方法。
Agilent 7890的计算方法与6890相同,故本文仅以6890为例说明。
以下面这张色谱图为例:
下图为调整信号响应范围(放大)的图,信噪比(S/N)的定义为:信号值/噪音值,哪是信号,哪是噪音,相信不用我啰嗦了。
下面介绍如何算信噪比了。
在菜单栏选择“Report”项,弹出子菜单,再选择“Systen Suitability”,
弹出子子菜单,再选择“Edit Noise Ranges…”。
如下图:
此时弹出一个编辑框,如下图。
在框内输入噪音范围对应的保留时间。
点“OK”按钮。
选择“Report”-“Specify Report”,弹出对话框如下:
在“Report Seyle”下拉条中选择“Performance + Noise”,再点“OK”
按钮,关闭对话框。
现在打印报告看看:
“Signal/Noise”栏即为信噪比(S/N)。
除信噪比外,还可以查看对称因子(Symm),塔板数(Plates)和分离度(Resolution)等信息。
Three Channel, Five ValvesFast Refinery Gas AnalyzerSpecials and Solutions GroupReference: 7890-0322General informationThis GC is configured to analyze refinery gas within 7 minutes. The system has five valves and three detectors. The FID channel is configured to analyze the hydrocarbons from C1 to C5, while C6/C6+ components are backflushed and measured as one peak at the beginning of the analysis. The first TCD channel (reference gas He) is configured to analyze fixed gases, which may include CO2, CO, O2, and N2. Last, the second TCD channel (third detector, on the side, with reference gas N2) is dedicated to analyze hydrogen only. The sample must contain NO water or hydrocarbons above C9.A typical plumbing diagram is shown below.The columns used in this analyzer are as follows. All packed columns are 1/8 inch stainless steel.Column#1 0.5M Haysep Q 80/100 meshColumn#2 6 Ft Hayesep Q 80/100 meshColumn#3 6 Ft Molecular Sieve 5A 60/80 meshColumn#4 3 Ft Hayesep Q 80/100 meshColumn#5 8 Ft Molecular Sieve 5A 60/80 meshColumn#6 123-1015(cut) 2m x 0.32mm x 5um DB-1Column#7 19091P-S12 25m x 0.32mm x 8um HP-AL/SThe plumbing diagram shows a capillary inlet and two PCM units acting as flow sources. Both the capillary inlet and the PCM identified as B in the diagram utilize Helium as carrier gas in main and secondary intakes. The last PCM identified as C in the diagram, must use N2 as carrier gas in main and secondary intakes. Valves #1 and #5 are 10 port gas sampling with sequence reversal and backflush of the pre-column to vent, Valve #2 is a 6 port with column isolation. Valve #3 is a 6 port column sequence reversal with backflush of the pre-column. Last, Valve #4 is a 6 port gas sampling upstream to the capillary inlet. Each valve fulfills a specific task into the analysis as this manual will show thereafter.Analysis SequencePermanent and Light Gases ChannelThis part of the analyzer is related to valve # 1 (10 port gas sampling valve with precolumn backflush to vent) and valve # 2 (6 port column isolation valve). The diagrams below show the sequence of the analysis for these components.1.Injection time (V1 ON, V2 OFF)Backflush time (V1 OFF, V2 OFF)2.Hydrogen and Oxygen elution and pre-isolation valve time (V2 OFF)3.The hydrogen and oxygen are light enough to be separated from the rest of the permanent gases and even exit the mol sieve column before the rest of the permanent gases are isolated on it. The hydrogen peak will be seen as a negative signal and is not quantitated in this channel, but the oxygen, if present in the injection mixture, will come out before the V2 ON time and before the CO2 in the elution order.Isolation valve time (V2 ON)4.5. Isolation valve time contd (V2 ON)6.Light gases elution time (V2 OFF)Hydrocarbons ChannelThis part of the analyzer is related to valve # 3 (6 port sequence reversal with backflush to detector) and valve # 4 (6 port gas sampling valve upstream to the capillary inlet). The diagrams below show the sequence of the analysis for these components. 1. Injection time (V4 ON, V3 OFF).FID25 m HP-Al/S 2 m DB-1 Note that the sample is first injected into the short (4 m) DB-1 column. 2.First 30 seconds of the run (V4 OFF, V3 OFF).FID25 m HP-Al/S 2 m DB-1 The sample has distributed between the short DB-1 and the long (25 m) HP-Al/S columns. 3.Just before backflush time (V3 OFF).FID25 m HP-Al/S 2 m DB-1 4. Backflush time (V3 ON)FID25 m HP-Al/S2 m DB-1This backflush and reverse flow of the 2 m DB-1 ensures that C6 and higher compounds come out early in the chromatogram as one peak into the detector.5. Elution of the C6 and Higher compounds into the FID and redistribution of samplecomponents between the two capillary columns.FID25 m HP-Al/S 2 m DB-1 6.Elution of the rest of the sample components into the FID.FID25 m HP-Al/S 2 m DB-1 7. Reset of the backflush valve to initial position (V3 OFF).FID25 m HP-Al/S 2 m DB-1Hydrogen ChannelThis part of the analyzer is related to valve # 5 (10 port gas sampling valve with precolumnbackflush to vent). The diagrams below show the sequence of the analysis for this component.1. Injection time (V5 ON).TCDHayeSep QMol Sieve 5A2. First seconds of the run (V5 ON).TCDHayeSep QMol Sieve 5A3. Backflush time (V5 OFF).TCDHayeSep QMol Sieve 5AAll compounds heavier than hydrogen (with the possible exception of helium and argon if present) are backflushed to vent from the pre-column, while the hydrogen (and other low retained gases, if present) continues their migration (and separation, given the case) across the mol sieve packed column.4. Elution of hydrogen to the TCD (V5 OFF).TCDHayeSep QMol Sieve 5AInstallationConnect all gases to the GC. Be careful on discerning which flow source and TCD intake connection requires Helium and which requires Nitrogen as supply gas. Then power up the GC. If an Agilent ChemStation is being used - bring it up and load the method FASTRGA.M included into the CD-ROM.Verify the following conditions=====================================================================Agilent 7890 GC=====================================================================OvenOven OnEquilibration Time 3.0 minOven Program60 degrees C for 1 minthen 20 °C/min to 80 degrees C for 0 minthen 30 °C/min to 190 degrees C for 1.3333 minPost Run Temperature 50 degrees CFront InjectorFront Inlet SSHeater On 250 °CPressure On 13.787 psiTotal Flow On 230.61 mL/minSeptum Purge Flow On 3 mL/minMode SplitGas Saver OffSplit Ratio 80 :1Split Flow 224.8 mL/minInjection Pulse Pressure 10 psi Until 0.75 minFront Aux HeaterHeater OnTemperature Program150 degrees C for 0 minBack Aux HeaterHeater OnTemperature Program150 degrees C for 0 minColumn #1Agilent RGA : 200 °C: 29 m x 320 m x 7.5 mDB-1 2 m + Al PLOT S 25 m: 126.61967In: Front SS Inlet HeOut: Front DetectorColumn #2Supelco Packed 1: 275 °C: Packed0.5 m Hayesep Q 80/100: 127.54591In: PCM B-2 HeColumn #3Supelco Packed 2: 275 °C: Packed6 ft Hayesep Q 80/100: 127.54712In: PCM B-1 HeColumn #4Supelco Packed 4: 275 °C: Packed3 ft Hayesep Q 80/100: 127.55227In: PCM C-2 N2Column #5Supelco Packed 5: 350 °C: Packed8 ft Molesieve 5A: 127.55280In: PCM C-1 N2Column #6450 °C: 25 m x 320 m x 0 mFront Detector FIDHeater On 250 °CH2 Flow On 30 mL/min Air Flow On 350 mL/min Makeup Flow On 27 mL/min Const Col + Makeup OffFlame OnElectrometer OnBack Detector TCDHeater On 250 °C Reference Flow On 45 mL/min Makeup Flow On 2 mL/min Const Col + Makeup OffNegative Polarity OffFilament OnAux Detector TCDHeater On 250 °C Reference Flow On 45 mL/min Makeup Flow On 2 mL/min Const Col + Makeup OffNegative Polarity OnFilament OnValve 1Other OffValve 2Other OffValve 3Other OffValve 4Other OffValve 5Other OffValve 6Valve 7Valve 8PCM B-1Carrier Gas HePressure Program29 psi for 0 minPCM B-2Carrier Gas HeChannel B Control Mode Forward PressurePressure Program8.1 psi for 0 minPCM C-1Carrier Gas N2Pressure Program20.5 psi for 0 minPCM C-2Carrier Gas N2Channel B Control Mode Forward PressurePressure Program10.45 psi for 0 minCyclic ValveDefault State OffOn Period 250Off Period 60000Start Delay 60000ValveBox Test ReportSignalsFront Signal Save OnBack Signal Save OnAux Signal Save OnTest Plot Save OffRun Time EventsTime (min) Event Position Setpoint 0.1 Valve Valve 1 On0.1 Valve Valve 4 On0.1 Valve Valve 5 On0.6 Valve Valve 5 Off0.75 Valve Valve 3 On0.9 Valve Valve 1 Off1.0 Valve Valve 4 Off2.1 Valve Valve 2 On3.13 Valve Valve 2 Off7.0 Valve Valve 3 OffCheckout procedureLoad the FASTRGA.M method into the online ChemStation and allow the instrument to get ready. Inject a suitable RGA standard into the GC making sure that the pressure of the gas inside the sample loops is equal to the atmospheric pressure or is otherwise controlled andreproducible. The resulting chromatograms should look as shown in fig 2.Fig. 2Procedure for a New SetupThis procedure will have to be carried out on a new GC or if new columns are installed or the present columns are re-conditioned. It is recommended to follow this process in the same order given in this manual. If new columns are being installed, or present columns need to be conditioned, proceed as indicated in the Appendix APermanent and Light Gases ChannelSet up of needle valves and columns flow1. Load the parameters into the GC according to the attached method or by loading thesupplied FASTRGA.M from the ChemStation. Let the system stabilize from half to one hour after reaching the ready condition.2. Ensure that you have the following conditions set up:Aux PCM B-1 Pressure 29 psiAux PCM B-2 Pressure 8.1 psi Forward Pres. ModeValve #1 OFFValve #2 OFF3. Turn off the back detector filament and make up gas. Wait until the TCD flows drop tozero.4. Connect a suitable flow meter to the back TCD exit and monitor the flow from columns#2 and #3. Take note of this value. It should be 22.0 ml/min +/- 1.0 ml/min. If not, adjust Aux PCM B-1 pressure using the GC keyboard so the flow is within range.5. Turn Valve 2 ON using the keyboard while observing the flow into the flow meter.6. Adjust the needle valve associated with Valve 2 to give the same column flow noted instep 4.7. Connect the flow meter to the Valve 1 vent at the left side of the GC and check thepresence of backflush flow for column #1. The value should be around 22 ml/min. If not, adjust Aux PCM B-2 pressure using the GC keyboard so the flow is within range.8. Turn valve 2 OFF and turn on the back TCD filament and makeup flow using the rightcommands on the keyboard.9. Upload the GC method from the ChemStation so the latest changes are incorporatedinto the FASTRGA.M method. Save this method with the appropriate command. Setting the backflush time for Valve 1The object is to set the backflush time of Valve 1 so that any heavier compounds are backflushed out to vent after the carbon dioxide has eluted to the detector. A RGA standard containing CO2, CO, CH4 and N2 must be used to set up the valve timing.1. Load the method called FASTRGA.M into the Online ChemStation session. Renamethis method Times.m using the command Save Method As. Clear the run table and then enter the following into the run table.Valve 1 ON Time 0.10Valve 2 ON Time 0.10Valve 1 OFF Time 0.802. Flush the sample loop with the standard, and press START on the GC. Allow it to run forthe full run time. Monitor the signal corresponding to the TCD. You should get achromatogram similar to that shown in Fig. 3 below.Fig. 3It is important to check that the carbon dioxide peak is present and that there is no other peak coming out later in the run. If the backflush time is set too late, you will see that heavier compounds come out later in the run when sample is injected.3. Once you have achieved this, the optimum backflush time must be found. Modify thefollowing event onto the run table as first approach.Valve 1 OFF Time 0.70Make sure you return both valve 1 and 2 to OFF before starting the next run.4. Inject the standard again, let the run to finish and observe the results for the permanentgases channel. If the backflush time was set too early you will see that carbon dioxide peak is partially or totally missing. This situation is shown in Fig 4, where a backflush time of 0.70 min was used and is compared with the run with backflush at 0.8 min.Fig. 4: Backflush too earlyNote that the dotted line trace shows a decrease in the size of the carbon dioxide signal for time 0.70 min when compared with the result for time 0.80 min using the same graphic scale for both. Also, the results of the area counts for both integrated peaks will show a difference. This means that some of the carbon dioxide is being lost with the new backflush time at 0.70 min. However, you must prove that your original time is not backflushing the carbon dioxide too.5. Once you have evaluated the result obtained in the previous step, repeat the analysiswith a new backflush time. This time should be bigger than the first one used in step 1 to evaluate if the CO2 peak increases its area. Modify the valve event as follows.Valve 1 OFF Time 0.90Make sure you return both valve 1 and 2 to OFF before starting the next run.6. Inject the standard for the third time, let the run to finish and observe the results for thepermanent gases channel. Two things may happen:a) The carbon dioxide peak shows an increase of size (mainly area counts on theintegration results) compared with the peak obtained in the first step of this procedure. Then the time selected in that step 1 was also leading to the carbon dioxide peak being partially backflushed through the valve vent, and therefore the Valve 1 OFF time must be increased in 0.1 min steps to allow all the carbon dioxide to elute out of the pre-column until the peak remains constant in the next time increase.b) The carbon dioxide peak remains the same size (mainly area counts on theintegration results) compared with the peak obtained in the first step of this procedure. Then the time selected on that step 1 was a good starting point and neither time (this or the first one) was allowing the carbon dioxide to be backflushed out through the valve vent. Therefore, this new increased time should be kept as the Valve 1 OFF time for the analysis. This particular situation for case b) is shown in Fig 5, where a backflush time of 0.90 min was used and is compared with the initial run with backflush at 0.8 min.Fig. 5: Backflush time appropriateIf the carbon dioxide peak remains constant in terms of area and height from after increasing the backflush time for valve 1, set this time as the Valve 1 OFF time.Add this time value as Valve 1 OFF time event into the Times.m method. This time was found to be 0.90 min in the test instrument.7. After the optimum backflush time has been obtained and the carbon dioxide peakremains unchanged, as shown in Fig. 5, the next step will be using the molecular sieve column to further separate the light gases. For that it is necessary to put the Valve 2 to work so the molecular sieve column takes part on the analysis. Observe the graphic on Fig. 6.Fig. 6: Valve 2 timingIdentify the times from this chromatogram as follows:Time T1 = Beginning of carbon dioxide peak - 0.15 minTime T2 = End of carbon dioxide peak + 0.5 minMake sure that the Valve 2 is in the OFF position and enter the following into the Run Table:Valve 2 ON Time T1Valve 2 OFF Time T2The addition of these commands to the run table will allow the hydrogen, air, methane and carbon monoxide to be transferred into the molecular sieve 5A column (# 3 in the valve diagram) before the carbon dioxide elutes from the 6 ft. Hayesep Q column (# 2 in diagram). This molecular sieve column will separate and let pass the hydrogen (negative peak not quantitated) and oxygen (if present), and separate nitrogen, methane and carbon monoxide, while isolating itself from the carbon dioxide and heavier compounds. The chromatogram should look similar to Fig 7.Fig. 7: Final chromatogramOpen an Offline ChemStation session for the same instrument and load the FASTRGA.M method.Enter or modify into the run time tableValve 1 ON Time 0.10Valve 1 OFF Time 0.90Valve 2 ON Time T1Valve 2 OFF Time T2Save the modified FASTRGA.M method and close the Offline ChemStation session. Hydrocarbons ChannelSet up of columns flow1. Load the method called FASTRGA.M into the Online ChemStation session. Ensurethat you have the following conditions set up:Front Inlet 250ºC, split ratio: 80:1Column 1: Agilent RGA: 27m x 0.320 umDB-1, 2m, + HP-AL/S, 25mColumn flow (He) 2.5 ml/min, constant flow mode.2. Turn off the front detector flame, electrometer and make up gas. Wait until the FID flowsdrop to zero3. Connect a suitable flow meter to the front FID exit and monitor the flow from columns #6and #7. Take note of this value. It should be 2.5 ml/min +/- 0.1 ml/min. If not, adjust the Front Inlet pressure using the GC keyboard so the flow is within range.4. Turn back on the FID and makeup flow using the right commands on the keyboard.5. Upload the GC method from the ChemStation so the latest changes are incorporatedinto the FASTRGA.M method. Save this method with the appropriate command.6. Save again the FASTRGA.M method with the name Times.M using the Save ascommand on the ChemStation.Setting the backflush time for Valve 3The object is to set the backflush time of Valve 3 so that n-hexane and any heavier compounds are backflushed to detector. A RGA standard containing hydrocarbons must be used to set up the valve timing.1. Load the method called Times.M into the Online ChemStation session. Rememberthat this method should have been re-created in the previous section of this set of instructions. Clear the run table and then enter the following into the run table.Valve 4 ON Time 0.10Valve 4 OFF Time 1.00Valve 3 ON Time 0.75Valve 3 OFF Time 7.002. Flush the sample loop with the standard, and press START on the GC. Allow the GC torun for the full 7.0 minutes. Monitor the signal corresponding to the FID. You should geta chromatogram similar to that shown in Fig. 8 below.Fig. 83. Observe the presence of the initial C6+ peak backflush and the group of four C5 olefins,being the last one cis-2-pentene (fig. 8). In a similar fashion as the light and permanent gases channel backflush time optimization steps, it is necessary to modify the Valve 3 ON value forward or backwards in time in order to make sure that it is the optimumbackflush time. For example: if the Valve 3 ON time is set too early, as this example was at 0.4 min, the resulting chromatogram will look similar to the one in figure 9 below.Fig. 9: Backflush too early4. In the other hand, if the Valve 3 ON time is set too late, the presence of C 6 hydrocarbonsat the end of the run will become evident as shown in fig. 10 below.Fig. 10: Backflush too late Once the right timing has been found, Open an Offline ChemStation session for the same instrument and load the FASTRGA.M method.Enter or modify into the run time tableValve 4 ON Time 0.10Valve 4 OFF Time 1.00Valve 3 ON Time x.xxValve 3 OFF Time 7.00Being x.xx the optimum backflush time for Valve 3, which was found to be 0.75 min in the test unit used to create this document.5. Save the modified FASTRGA.M method and close the Offline ChemStation session Hydrogen ChannelSet up of columns flow1. Ensure that you have the following conditions set up:Aux PCM C-1 Pressure20.5 psi Aux PCM C-2 Pressure10.45 psi Valve #5 OFF2. Turn off the aux detector filament and make up gas. Wait until the aux TCD flows drop to zero.3. Connect a suitable flow meter to the aux TCD exit (located in the left side of the oven) and monitor the flow from column #5. Take note of this value. It should be 26.0 ml/min+/- 1.0 ml/min. If not, adjust Aux PCM C-1 pressure using the GC keyboard so the flow is within range.4. Connect the flow meter to the Valve 5 vent at the left side of the GC and check thepresence of backflush flow for column #4. The value should be around 24 ml/min. If not, adjust Aux PCM C-2 pressure using the GC keyboard so the flow is within range.5. Turn on the aux TCD filament and makeup flow using the right commands on thekeyboard.6. Upload the GC method from the ChemStation so the latest changes are incorporatedinto the FASTRGA.M method. Save this method with the appropriate command.7. Save again the FASTRGA.M method with the name Times.M using the Save ascommand on the ChemStation.Setting the backflush time for Valve 5The object is to set the backflush time of Valve 5 so that any compound heavier than hydrogen gets backflushed to detector. A RGA standard containing hydrogen must be used to set up the valve timing.1. Load the method called Times.M into the Online ChemStation session. Rememberthat this method should have been created in the previous section of this set of instructions. Clear the run table and then enter the following into the run table.Valve 5 ON Time 0.10Valve 5 OFF Time 0.602. Flush the sample loop with the standard, and press START on the GC. Allow to run forthe full 7.0 minutes. Monitor the signal corresponding to the Aux TCD. You should get a chromatogram similar to that shown in Fig. 11 below. If helium is also present in the standard, it should appear before the hydrogen. Make sure that the standardcomposition is reliable.Fig. 113. Since the hydrogen transit time across the MolSieve column is very short compared toother light gases, generally speaking, the time gap between the elution of this element and the next gas in the mixture should be ample enough to allow a rather wide backflush time range for Valve 5. It is recommended to verify the validity of this value making the appropriate time adjustments and checkout injections.4. Once the right timing has been found, Open an Offline ChemStation session for thesame instrument and load the FASTRGA.M method. Enter or modify into the run time tableValve 5 ON Time 0.10Valve 5 OFF Time y.yy Being y.yy the optimum backflush time for Valve 5, which was found to be 0.60 min in the test unit used to create this document.5. Save the modified FASTRGA.M method and close the Offline ChemStation session.The final run table should look similar to the one shown below.Run Time EventsTime (min) Event Position Setpoint0.1 Valve Valve 1 On0.1 Valve Valve 4 On0.1 Valve Valve 5 On0.6 Valve Valve 5 Off0.75 Valve Valve 3 On0.9 Valve Valve 1 Off1.0 Valve Valve 4 Off2.1 Valve Valve 2 On3.13 Valve Valve 2 Off7.0 Valve Valve 3 OffCalibrationTo calibrate the method, connect up the calibration gas to the GC. Purge the sample loops, stop the flow of calibration gas and inject after the pressure has equilibrated with the atmospheric. Calibrate the method at the end of the run.Appendix AConditioning the columns.Molecular Sieve 5A columnThese columns should be removed from the GC and installed into a similar GC oven that does not have valves installed on the top and does not have any other columns installed in the oven. Condition the columns at 350°C over night with either helium or nitrogen as appropriate and a gas flow of 20-25ml/min leaving the column exit open into the GC oven. If a second GC oven is not available, remove all other columns from the oven, remove the valve box top so that the valves are exposed to ambient temperature and turn off the heat to the zones that heat the valves. Condition the columns at 230°C for 16 h with helium or nitrogen as appropriate and a gas flow of 20-25 ml/min leaving the column exit open into the GC oven.HayeSep QThese columns can be conditioned in this GC.Condition the columns at 225°C for 4 hours with either helium or nitrogen as appropriate and a gas flow of 20-25 ml/min leaving the column exit open into the GC oven.DB-1You will need to remove the other capillary column, but this can be conditioned in this GC. Condition at 200°C for 8 hours with helium gas at 3-5 ml/min leaving the column exit open into the GC oven.HP-Alumina PLOT/SYou will need to remove the other capillary column, but this can be conditioned in this GC. Place this column in the column #6 IN position inside the oven.Condition at 200°C for 8 hours with helium gas at 3-5 ml/min leaving the column exit open into the GC oven.IMPORTANT NOTE:To condition the columns in this instrument, all the valves should remain in OFF position during the whole process. Make sure that the event time table is empty if you are programming a run to condition the columns.。


Agilent 7890A/5975 GCMSD 基本操作培训教材(中文版工作站E.01.00)安捷伦科技有限公司生命科学与化学分析事业部客户服务中心免费热线: 800-820-3278手机用户免费热线: 400-820-3278/chem/cnGCMSD开机操作过程:1. 开气: 打开载气(He)钢瓶的总阀开关,调整输出气压为约0.5M Pa2. 开电脑: 检查网络HUB是否通电,启动电脑,进入Windows 系统后。
3. 检查气密: 检查MSD正前方的Vent Valve是否已经Close关闭紧,检查柱箱内的质谱接口是否安装好色谱柱或者用死堵头密封。
4.开质谱: 翻开质谱仪的上盖,向右按住MSD侧板(注意:只能按住侧板上的RF发生器部位,即在中间方型的铝合金部位),打开质谱仪前左下方的电源开关,首先外部的机械泵会开始抽初级真空,大约过了1分钟,机械泵响声变小,MSD显示Pump down,并响“嘟”的一声,分子涡沦泵已经启动开始抽真空。
5. 开气相: 打开气相色谱仪前左下方的电源开关,GC进入自检后, 完成启动。
6. 联机: 双击电脑桌面的图标,进入MSD化学工作站。
7. 操作: 调用或者编辑相应的操作方法。
(至少要抽真空2小时以上才能工作。
)GCMSD关机操作过程:1.放空: 从MSD化学工作站中视图 菜单中转到调谐和真空控制再从菜单的真空Vacuum中按放空Vent命令,系统提示开始放空。
放空操作的作用是: (1).把GC OVEN设为30℃(2). 把MSD的分子涡沦泵的转速降下来(3). 把离子源及四极杆的温度降下来(<100℃)。
2. 降温: 把GC AUX2(质谱接口)温度off,把GC的前进样口(Front inlet)的温度OFF3. 关机: 约等1小时后,放空完成,退出MSD化学工作站,关掉GC和MSD的电源。
3. 关电脑: 退出电脑Windows系统,关掉电脑电源。
安捷伦7890A气相色谱仪操作维护规程一、操作步骤1.检查仪器和气路是否正常,并查看钢瓶中的气体是否足够。
2.打开载气(高纯氮气纯度99.999%),调整载气输出气压为0.5Mpa。
3.打开气相色谱仪前左下方的电源开关,GC进入自检后启动完成提示Power onSuccessful。
4.启动电脑进入Windows系统后,双击电脑桌面的“仪器1联机”图标进入GC化学工作站,点击“仪器”后,进行相应的操作。
5.仪器各项参数达到设定值后,进行点火,点着火后,等仪器运行稳定后可进行进样操作了。
6.关机。
先把仪器的Flame(点火)OFF,再把进样器和检测器的温度OFF,并设置柱温为40℃,等进样器和检测器温度降到室温左右时,把柱温(OVEN)OFF,先退出GC化学工作站软件再关掉GC电源。
退出电脑系统并关电源,最后关掉气源。
二、注意事项1.室内环境温度应在5~35℃范围内,湿度小于等于70%(相对湿度)。
2.更换气体钢瓶及色谱柱后,要对气路用肥皂水进行检漏。
3.安装拆卸色谱柱必须在常温下进行。
4.老化色谱柱时,不要把色谱柱与检测器相连。
并且老化温度不能超过色谱柱的最高温度。
5.开机。
应先开载气,再开仪器电源,然后进行各项参数设置。
待各项条件达到设定值时进行点火。
关机,应先灭火,然后进行降温,待温度降到室温,关仪器,最后关载气。
三、维护保养1.每月开机一次,防止检测器受潮,从而影响仪器点火,并检查仪器是否能正常运行。
2.每二个月查看空气发生器中的硅胶是否变色,如变色更换硅胶。
7890 气相色谱操作现场培训手册数 据 处 理2007年12月点击下面菜单进入数据处理界面; 或者点击左下方的数据处理。
一、 调用要处理的数据文件选择下面菜单调用文件,如果是为了建立校准表,则调用标准品的谱图,先调用最低浓度的。
选择文件名称二、 优化谱图选择下面菜单进入信号选项在右图中,选择范围中的三个选项之一。
建议多使用自动量程。
如果选择自定义量程,则需要输入时间范围和响应范围,可能需要反复多次才能得到满意的结果。
而且对所有的图谱均使用该量程。
优化后得到满意的图谱,即可进入积分参数设定界面。
三、积分参数的设定选择下面菜单进入积分参数设定界面。
一般需要修改的参数为斜率灵敏度、最小峰面积、最小峰高。
每次改动积分参数后,点击该图标重新积分;或选择积分菜单中的积分选项。
可以用鼠标点击该三个图标,选择谱图放大、缩小和选定的功能,然后再谱图中拉放进行放大、缩小功能。
所有的参数设定好以后,点击该图标进行参数的保存并退出积分参数设定界面。
否则无法进行下一步工作。
四、建立校正表图中:级别1表示为第一个浓度的标样。
不需要在该图中做任何改动,按确定进入下一步。
在图中可以用鼠标选定要定量的峰,在下面的表格中会用黑色显示该峰的信息。
在该行的化合物栏中输入名称,在含量栏中输入该组份的浓度。
输入名称和浓度后,点击其他行后可以在右边看到校正曲线。
依次将所有要定量的组份信息输入表中:全部输入后确认没有错误输入,点击确定。
点击是,删除含量为零的行----表示该组份不需要定量A 如果只有一个浓度的标样,则直接进入到B 如果有几个浓度,则调入第二个浓度的标样谱图。
选择文件名称从第二个浓度的谱图开始,只能优化谱图,不能再修改积分参数。
选择下面菜单,可以输入第二个浓度的组份信息。
级别2表示第二个浓度。
在对应的组份第二个级别的含量栏中输入浓度。
点击确定。
如果还有第三、第四……浓度的标样,则返回到12页的B开始循环,直到所有浓度的标样信息输入完毕,进入下一步。
7890A气相色谱仪操作规程1 环境要求1.1电源电压220V±10%1.2环境温度5~40℃,湿度5~80%1.3仪器应避免直接风吹或日光照射,且通风良好,无振动,与墙壁间的距离应大于30CM1.4电源线必须使用包括地线的三芯电缆供电。
1.5氮气纯度≥99.99%。
2 操作规程2.1开启主机,进入联机状态。
2.1.1将氮气瓶总阀打开,然后开启二次减压阀,使压力为0.4Mpa。
2.1.2打开7890A主机电源开关,打开电脑。
2.1.3待主机自检通过,连接Agilent Chemstation之仪器2(联机)。
2.2编辑整个方法。
2.2.1从菜单中选择“方法和运行控制“画面。
2.2.2打开“方法”菜单,选择“编辑完整方法”,选择各参数,单击确定。
2.2.3编辑方法信息,根据仪器实际配置选择鉴定器类型及进样口位置和进样方式。
2.2.4进入仪器控制参数编辑画面,依据画面设定相应参数值:配制柱子,设置炉温参数,进样口参数,检测器参数。
每设定完一种参数,单击“应运”。
最后单击确定。
2.2.5编辑好仪器控制参数后即进入信号和积分参数设定画面,单击确定跳过这两种参数的设定。
2.2.6编辑完后进入报告设置画面,按要求设定报告。
2.2.7编辑运行时间对照表。
2.2.8保存方法。
打开方法菜单,选择保存方法为,输入方法名。
2.3样品分析2.3.1调出在线窗口。
2.3.2从运行控制中选择样品信息,编辑样品信息后单击确定。
2.3.3待基线平坦后,编辑序列表,单击Start运行序列。
运行停止后打出报告。
2.3.4实验结束后,在仪器控制参数中关闭检测器,将各功能块降温至设定温度后退出化学工作站,关闭GC电源,计算机电源,并关闭所有气源。
3 操作过程中异常情况处理3.1如检测过程中停电,按仪器操作规程依次关闭电源,电源恢复正常后再开机。
未测完样品测定无效,待组分完全流出后重新测定。
3.2检测仪器设备损坏或出现异常,应立即停止检测工作,通报主管部门(或人员),待查清原因后进行维修,直至仪器恢复正常方可进行检测工作,并将损坏及维修情况填写仪器设备档案。
Jiangsu Sinography Testing Co., Ltd.Standard Operating Procedure forOperation and Maintenance of Agilent GC7890A-MSD5975C安捷伦GC7890A-MSD5975C操作指导及维护Name Title/Department Function Signature and DateLucy Zhou Study Personnel AuthorIvy Yuan Quality Assurance Unit ReviewerRobin Xiao Test Facility Management ApproverDate of issue 2012-09-27 Effective date 2012-09-28 Next review date 2014-09-27 Purpose :To establish an operating procedure and maintenance of Agilent 7890/5975CGC/MSD.目的:建立安捷伦GC7890A-MSD5975C操作指导及维护Responsibility :Study Director;Study Personnel职责:项目负责人;专题人员Abbreviations :JSST–Jiangsu Sinography Testing Co., Ltd.;SOP – Standard OperatingProcedure; GLP – Good Laboratory Practice; GC – Gas Chromatography; MS–Mass Spectrometer; RSD –Relative Standard Deviation; EI –ElectronIonization; S/N –Signal/Noise ratio; He –Helium; TIC –Total IonChromatogram; EPC –Electronic Pressure Control简写:JSST –江苏中谱检测有限公司;SOP –标准操作程序;GLP –良好实验室规范;GC –气相色谱仪;MS-质谱仪;RSD –相对标准偏差;EI–电子电离源;S/N –信噪比;He –氦气;TIC-总离子色谱图;EPC-电子压力控制Procedure :步骤:Ⅰ-Introduction简介This standard operating procedure shows the instrument performance, using and maintenance of Agilent GC7890A/MSD5975C, in order to ensure that the hardware operation, the parameters setting of instrument, the elementary operation of data acquisition and analysis will be known.本标准操作程序说明了Agilent GC7890A/MSD5975C的仪器性能、使用方法和维护规程,以保证使用者基本了解其硬件操作,掌握仪器的参数设定,学会数据采集,数据分析的基本操作。


Agilent 7890A G C(中文版B03.01C )现场培训教材安捷伦科技有限公司化学分析与生命科学事业部一、培训目的:?基本了解7890A 硬件操作。
?掌握化学工作站的开机,关机,参数设定, 学会数据采集,数据分析的基本操作。
二、培训准备:1、仪器设备:Agilent7890A GC?进样口: 填充柱进样口(PP);毛细柱进样口(S/SL); 冷柱头进样口(COC); PTV 进样口。
?检测器:FID;TCD;u ECD; NPD;FPD。
?色谱柱:P/N 19091J-433, HP-5 毛细柱:30m,ⅹ320μχ0.25μ?注射器:自动液体进样器(ALS)用10ul 注射器或手动进样用10ul 注射器。
?进样体积: 1 ul。
2、气体准备:?FID,NPD,FPD :高纯H2 (99.999%),干燥无油压缩空气。
?uECD:高纯N2 (99.999%)?载气, 高纯N2 (99.999%)或高纯He (99.999%)。
7890A/GC 化学工作站基本操作步骤:(一)、开机:1、打开气源(按相应的所需气体)。
2、打开计算机,进入中文Windows XP 画面。
3、打开7890A GC 电源开关。
(7890A 的IP 地址已通过其键盘提前输入进7890A)4、双击桌面的“仪器 1 联机”图标;(或点击屏幕左下角“开始”,选择“程序”,选择“安捷伦化学工作站”,选择“仪器 1 联机”,则化学工作站自动与7890A 通讯,进入的工作站界面如下图:(通讯成功后,7890A 的遥控灯亮)5、从“视图”菜单中选择“方法和运行控制”画面,点击“化学工作站状态”,使其命令前有“√”标志,点击“全部菜单”,使之显示为“短菜单”来调用所需的界面。
(二)7890A 配置编辑:1、点击“仪器”菜单,选择“GC 配置…”进入如图所示画面。
在“连接”画面下,输入GC 名称:如“GC 7890”;可在“注释”处输入7890A 的配置,如“7890GC with FID FPD”。
1.开机2.关机3.7890A配置4.自动调谐及查看真空5.编辑完整的方法6.建立序列及运行序列7.添加图库8.查看图库及定性9.建立标准曲线10.计算及打印报告11.GCMS原理12.仪器日常维护1.打开载气(He)瓶,并把减压阀出口压力调到0.5MPa2.打开电脑电源,并进入windows操作系统.3.打开GC电源.再打开MS电源(第一次开机或已放空的情况下,要在推压侧板况态下打开MS电源) 如果是MS部分不漏气的话,分子涡轮泵的速度会很快升上去的.不然就说明是漏气.要关MS再重新再开.4.双击电脑桌面上的图标.打开GCMS工作站.5.调出用户户建立的方法:6. 方法调出后,仪器会进入用户方法所设定的参数状态.待仪器稳定后就可以建立序列,并进行样品检测.1.首先回到工作站主介面:2.“视图”--->“调谐和真空控制”--->“真空”--->“放空”此时仪器将会把MS中的分子涡轮泵速度降下来.并把所有的加热源停止加热.令其温度降下来.当分子涡轮泵速度<50% ,所有加热部分温度<100度时.就说明仪器达到关机状态。
3.先关闭电脑中的仪器工作站软件。
4.关闭MS电源,关闭GC电源。
7890A配置我们要对仪器进行正确的配置。
因为仪器是不可能正确识别我们用的气是什么气体,还有就是毛细管柱里的气体流量和气压是通过计算得出来的。
如果不正确的配置会令到仪器得不到正确的参数,以致于仪器会认为仪器自已有问题。
毛细管的配置:我们要正确配置毛细管柱的参数。
毛细管柱里是没有流量计和压力计的,它里面的压力和流量半不是测出来的,而是通过进样口中其它的几个参数计算出毛细管柱中的压力和流量的。
所以毛细管柱的参数必须要正确设置。
自动调谐查看真空编辑完整的方法建立序列运行序列添加图库1.设定PBM图库2.选择谱库3.选择结构库查看谱图及定性快捷定性建立标准曲线1.首先调出数据采集的方法。
2.将原数据采集的方法另存为另一不同文件名的方法3.调出标线的数据文件4.对数据积分并设置定量选取峰图的特征离子添加第二点校正点把标准曲线存入方法计算及打印报告GCMS原理衬管的作用•保护色谱柱:不挥发组分滞留在衬管内。
Agile nt 7890 A/ 5975C 气相色谱质谱联用仪操作规程1.开机1)打开载气钢瓶控制阀,设置分压阀压力至0.5Mpa 2)打开计算机,登录进入Windows XP系统,初次开机时使用5975C的小键盘LCP输入IP地址和子网掩码,并使用新地址重起,否则安装并运行Bootp Service 。
3)依次打开7890AGC 5975MS电源(若MS真空腔内已无负压则应在打开MS电源的同时用手向右侧推真空腔的侧板直至侧面板被紧固地吸牢),等待仪器自检完毕。
4)桌面双击GC-M图标,进入MS化学工作站5)在上图仪器控制界面下,单击视图菜单,选择调谐及真空控制进入调谐与真空控制界面,在真空菜单中选择真空状态,观察真空泵运行状态,此仪器真空泵配置为分子涡轮泵,状态显示涡轮泵转速涡轮泵转速应很快达到100 %否则,说明系统有漏气,应检查侧板是否压正、放空阀是否拧紧、柱子是否接好。
2.调谐调谐应在仪器至少开机2个小时后方可进行,若仪器长时间未开机为得到好的调谐结果将时间延长至4小时。
1)首先确认打印机已连好并处于联机状态。
2)在操作系统桌面双击GC-M图标进入工作站系统。
3)在上图仪器控制界面下,单击视图菜单,选择调谐及真空控制进入调谐与真空控制界面。
4)单击调谐菜单,选择自动调谐调谐MSD进行自动调谐,调谐结果自动打印。
5)如果要手动保存或另存调谐参数,将调谐文件保存到atune.uxx。
6)然后点击视图然后选择仪器控制返回到仪器控制界面。
自动调谐文件名为ATUNE.U 标准谱图调谐文件名为STUNE.U 其余调谐方式有各自的文件名.3.样品测定3.1方法建立1)7890A配置编辑点击仪器菜单,选择编辑GC配置进入画面。
在连接画面下,输入GCName:GC7890A;可在Notes 处输入7890A的配置,写7890A GCwith 5975C MSD 点击获得G(配置按钮获取7890A勺配置。
安捷伦7890型气相色谱仪操作规程
操作步骤
1、检查气路是否漏气,然后用载气稳流阀将载气调至所需气流。
2、按主机“启动”开关,接通电源。
3 、打开“气焰温控”把电子捕获检测器调到适当温度。
4 、打开“进样器温控”把进样器调到适当温度。
5 、打开“柱槽控温”把层柱恒温槽调到适当温度。
6 、打开微电流放大器“电源”开光。
7 、开机“”放大器A”或“放大器B”开光,把灵敏度选择调到适当
位置,电子捕获检测器使用时,高阻开关(灵敏度选择)使用范围在106—108,把“衰减”调到设当位置,“基补”—“调零”开关放在“基补”位置上。
8、打开“脉冲电源”开关,把“us选择”调到适当位置(一般用50us)
9 、打开记录仪“电源”开关,放下笔头。
10 、“基流补偿”“粗”“细”电位器,把记录笔调到0.8—0.95位置处。
11、检查基流,待各恒温器稳定后,进行分析。
12 、分析完毕后将载气流量调高10—30ml/min,检测器,柱箱温度提高10—30℃,半小时后方可开机。
13 、待仪器冷却后(≤50℃)关掉载气。
14 、套上仪器罩,做好使用记录。
安捷伦气相色谱7890a安捷伦气相色谱7890A是一款用于化学分析的仪器。
它采用了先进的气相色谱技术,为科学家和研究人员提供了一种可靠、准确的分析方法。
本文将介绍安捷伦气相色谱7890A的基本原理、应用领域以及其在分析实验中的优势。
一、基本原理安捷伦气相色谱7890A基于气相色谱技术,通过对待测样本进行气相分离和定量测定。
其基本的工作原理是将样品注入色谱柱并与载气一起通入柱内,不同组分在柱内发生相互作用,根据其在柱内的保留时间和峰形来进行分析和定量。
安捷伦气相色谱7890A的色谱柱采用高负荷能力的填料,以提高样品分离效果。
同时,该仪器配备了高灵敏度的检测器,能够准确测定样品中微量组分的含量。
二、应用领域安捷伦气相色谱7890A在各个领域中都得到了广泛应用。
以下是几个主要的应用领域:1. 环境监测:气相色谱7890A可以对大气、水和土壤中的有机物、无机物进行快速、准确的测定。
它可以用于检测环境中的污染物和有害物质,为环境保护和生态研究提供支持。
2. 食品安全:气相色谱7890A可以检测食品中的农药残留、重金属、有机污染物等有害物质。
这对于确保食品安全、保护人民的健康至关重要。
3. 药物分析:气相色谱7890A在药物研究和制药过程中发挥着重要的作用。
它可以准确分析药物成分、药代动力学等参数,为药物研发和质量控制提供支持。
4. 石油化工:气相色谱7890A可以分析石油和化工产品中的杂质、成分及残留物。
这对于产品质量控制和工艺优化具有重要意义。
三、分析实验中的优势安捷伦气相色谱7890A在分析实验中具有以下几个优势:1. 准确性:安捷伦气相色谱7890A采用先进的技术和精确的仪器,能够提供高准确性和可靠性的分析结果。
这对于科学研究和实验数据的可靠性至关重要。
2. 灵敏度:安捷伦气相色谱7890A配备了高灵敏度的检测器,可以检测到样品中微量的组分。
这使得它在分析低浓度样品或痕量成分时非常有用。
3. 快速性:安捷伦气相色谱7890A具有快速分析的优势,它可以在短时间内完成样品的分离和分析,提高实验效率。