地图符号设计指导书
- 格式:doc
- 大小:497.00 KB
- 文档页数:3
实习二地图符号的设计与使用一、实习目的学会在常用的制图软件中地图符号的设计制作方法。
二、实验知识准备符号:以图形方式对地图中的地理要素、标注和注记进行描述、分类或排列,以找出并显示定性关系和定量关系。
根据符号绘制的几何类型,可将其分为四类:标记、线、填充和文本。
样式:是一种容器,用于对地图上出现的可重复使用的事物进行存放;可通过样式来存储、组织和共享符号及其他地图组成部分。
创建符号并直接将其应用于要素和图形,可将多种符号组合到一起进行存储、管理和共享,这些组合到一起的符号统称为样式。
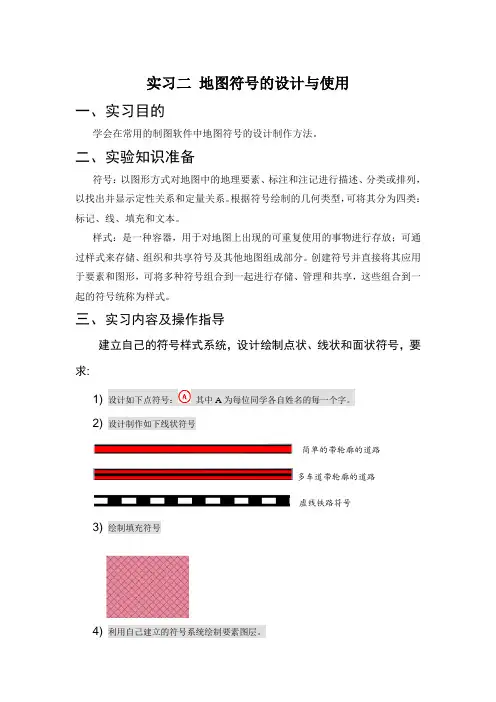
三、实习内容及操作指导建立自己的符号样式系统,设计绘制点状、线状和面状符号,要求:1) 设计如下点符号:其中A为每位同学各自姓名的每一个字。
2) 设计制作如下线状符号简单的带轮廓的道路多车道带轮廓的道路虚线铁路符号3) 绘制填充符号4) 利用自己建立的符号系统绘制要素图层。
操作指导:1、浏览点、线、面符号样式:打开ArcMap,单击菜单栏中自定义->样式管理器,如下图1-1弹出样式管理器,点击左侧的样式目录,即可查看相应的样式。
图1-12、创建样式3.1在符号选择器对话框中单击样式引用按钮(图3-1),或者在样式管理器对话框中单击样式按钮,打开样式引用对话框。
3.2在样式引用对话框中,单击创建新样式(图3-2)。
3.3导航到所需目录。
3.4输入要创建的新样式的名称。
3.5单击保存。
3.6单击确定。
样式引用3-1图Array图3-23、创建新的符号符号可以在符号选择器中创建,也可以在样式管理器中创建,下面分别进行讲述。
3.1符号选择器中创建新符号单击内容列表中的图层的符号,弹出符号选择器(图4-1),在符号选择器中可以修改这些符号的颜色、大小等基本属性。
单击编辑符号按钮打开符号属性编辑器(图4-2)即可编辑自定义的符号。
步骤:a.从符号选择器对话框中选择一个符号作为初始符号。
b.使用当前符号框中的控件在符号选择器对话框中直接更改大小、颜色等基本符号属性。


地图学实验五地图符号设计测绘⼯程专业地图学实习报告实习内容:地图符号制作班级: 2012级(2)班学号: 631201040228 姓名:党莹指导⽼师:李华蓉时间: 2014年10⽉30号⽬录⼀、实验名称 (1)⼆、实验⽬的 (1)三、实验内容 (1)四、实验步骤 (1)4.1创建shapefile (1)4.2点状符号的制作 (2)4.3线状符号的制作 (4)4.4⾯状符号的制作 (4)4.5⾃⼰设计并制作的符号 (5)4.5.1孔⼦学院 (5)4.5.2轻轨站 (5)4.5.3遛狗场所 (6)五、实验过程中的思考与优化 (6)5.1给ArcGIS中的对象添加标注 (6)5.1.1添加name字段 (7)5.1.2编辑标注属性 (8)5.1.3显⽰标注 (8)5.2线符号制作时对不同类型线条区别的探究 (9)5.2.1制图线符号 (9)5.2.2标记线符号 (10)5.2.3混列线符号 (10)六、实验⼩结 (11)⼀、实验名称地图符号制作⼆、实验⽬的1、熟悉地图符号的构成要素;2、熟悉并掌握ArcMap的基本操作;三、实验内容1、总结视觉变量对地图符号表达效果的影响2、不同类型地图符号的设计思路3、地图符号制作及成果展⽰根据1:500地形图图式制作的符号:点状符号:埋⽯图根控制点、⽔磨房、路灯线状符号:标准轨铁路、坝顶宽不依⽐例尺的堤、轻轨⾯状符号:旱地、沙泥地4、⾃⼰设计并制作的符号:孔⼦学院、轻轨站、遛狗场所(⾯)四、实验步骤4.1创建shapefile在⽬录树下右击要保存到的⽂件夹,选择“新建”→“Shapefile”(图4-1-1),在弹出的对话框中选择点、线或者⾯,名称为要创建符号的名称,单击“确定”便得到了⼀个符号的shape⽂件,系统⾃动将其添加到图层中,就可以开始编辑了。
依次⽤此⽅法创建出多个图层(图4-1-2)。
图4-1-1 创建shapefile4.2点状符号的制作1、可以看到图层中“图根控制点”的点样式为默认点,双击此默认点弹出符号选择器(图4-2-1);2、在符号选择器中单击“编辑符号”,弹出符号属性编辑器,在“类型”选择“字符标记符号”,分别⽤简单符号,通过简单的平移、旋转、压盖等的变换,得到图根控制点。


实验1利用ArcGIS进行符号设计1实验1 利用ArcGIS进行地图符号设计一、实验目的1. 通过本实验理解地图符号设计的原则和方法2. 掌握利用ArcGIS软件进行地图符号设计的过程二、实验课时共计4个学时三、实验指导内容1. 学习在ArcGIS中制作各种类型地图符号的方法2. 自己制作一个简单的符号库3. 调用符号库中的符号显示地图四、实验环境安装有ArcGIS软件的PC机。
五、实验操作与步骤A. 基本操作创建新样式1. 单击Tools,指向Styles,单击Style Manager。
2. 单击Styles,并单击Create New。
3. 找到样式文件夹。
在缺省状态下,样式文件夹在ArcGIS\ Styles 文件夹。
4. 输入新创建样式名。
5. 单击Save。
导出当前地图样式创建一个新的样式1. 单击Tools,指向Styles,单击Export Map Style。
2. 找到保存新样式的位置。
在缺省状态下,通常设置成Style目录位置。
3. 输入样式的名字。
4. 单击Save。
在样式管理器中创建一个新的符号1. 在样式目录树中,单击要创建符号的符号文件夹。
2. 右键单击符号内容窗口的空白部分,指向New,并单击某个样式类型。
3. 使用Symbol Property Editor对话框的属性创建想要的符号,单击OK。
4. 命名新符号。
为新的符号创建一个地理类1. 单击Tools,指向Styles,单击Style Manager。
2. 打开其中任意的符号。
3. 在右边的面板中的点击Category列,并为其填写相应的分类名如:“水系附属设施”等。
用Symbol Properties Editor定义符号1. 设置符号类型。
2. 设置测量单位。
3. 单击选项卡设置符号其它属性。
选项卡是随着符号类型不同而变化的。
4. 用户可以预览符号。
5. 用户可以在预览的时候放大和缩小。
6. 单击每一图层进行预览。
2Map designIn this chapter, you’ll learn all the steps necessary to symbolize common types of maps. Most analytical maps convey information with polygons or points using either qualitative or numeric attributes. Sometimes, but less often, lines are the primary interest. For polygons, symbolization mostly uses color fill and bound-ary lines. For points, it’s the size, shape, color fill, and boundary lines of point markers. For lines, it’s the type of line (for example, solid or dashed), width, and color. Symbolization is easy to implement because ArcMap uses attribute values to automate drawing; for example, it can draw all food pantry facilities in a city with a black square point marker of a certain size and all soup kitchen facilities with a black circle of a certain size by using an attribute with a type of facility code values.Learning objectives• Symbolize maps using qualitative attributes• Symbolize maps using quantitative attributes• Create custom numeric classes• Create normalized and density maps• Create dot density maps• Create fishnet maps• Create group layersGIS TUTORIAL FOR ARCGIS DESKTOP 10.8 5212 3 4 5 6 7 8 9 10 11 12TUTORIAL 2-1Creating point and polygon maps using qualitative attributesPlacing objects of all kinds into meaningful classes or categories is a major goal of science.Classification in tabular data is accomplished using attributes with codes that have mutually exclusive and exhaustive qualitative values. For example, a code for size could have the values low, medium, and high. Any instance of the features with this code is displayed in only one of the classes (the values are mutually exclusive) and there are no more size classes (the values are exhaustive). In this tutorial, you learn how to symbolize mapped features—points, lines, and polygons—by class membership as available in code attributes.Start ArcMap and open a map document1 On the taskbar, click Start > ArcGIS > ArcMap 10.8.x.2 Open Tutorial2-1.mxd from the Maps folder. ArcMap opens a map with no layers added. Youadd the needed layers next.3 Save the map document to the Chapter2 folder of MyExercises.Add and display polygons using a single symbolThe first layer of your map is an outline of New York City neighborhoods used as a reference layer.1 Click the Add Data button, browse through the Data folder to nYC.gdb, and clickneighborhoods > Add. ArcMap draws the neighborhoods for New York City as filled polygons.2 In the Table Of Contents window, click the polygon symbol and select hollow symbol, typean outline width of 1.15, and select an outline color of Black. Click OK.3 In the Table Of Contents window, right-click the neighborhoods layer, click Properties, andclick the Labels tab.4 Click the Label features in this layer check box. For Label Field, select name, and select 10as the Text Symbol size.Next, you add a white halo to the label to make the labels stand out and be more legible.5 Click the Symbol button > Edit Symbol button > Mask tab > halo option button.<alt>Layer Properties with selections made on the Labels tab.</alt>Click Bookmarks > Lower Manhattan. ArcMap zooms to this neighborhood and a fewneighborhoods in the surrounding boroughs.<alt>Map zoomed to the Lower Manhattan bookmark.</alt>Note: The font size 10 labels for neighborhoods may appear larger or smaller than those shown on the book’s map. If you’d like to change the size of labels for your window, use the steps in this section. Likewise, you can change the font size for labels in the Your Turn assignment, which is next.GIS TUTORIAL FOR ARCGIS DESKTOP 10.8 541 2 3 4 5 6 7 8 9 10 11 12YOUR TURnAdd the Water feature class from NYC.gdb with a blue symbol and no outline. Label the layerusing the field LANDNAME with Times New Roman, Bold, and Italic font of size 12. Drag thislayer below Neighborhoods. The two layers you added are from different sources, so theboundaries do not match perfectly. Note: When labeling the Water feature class, you’ll seethat some labels are repeated. You can get just one label to appear by clicking the PlacementProperties button at the lower left of the Labels tab and selecting Remove duplicate labels.Add and display polygons using unique symbolsThe next layer you add has zoning polygons with various classes of land use. Zoning restricts land use to approved kinds; for example, areas zoned as residential cannot have businesses located within them.1 Click the Add Data button, browse through the Data folder to nYC.gdb, and clickZoningLandUse > Add.2 After adding the ZoningLandUse layer, drag it below the neighborhoods layer in the tableof contents.3 In the Table Of Contents window, right-click the ZoningLandUse layer and click Properties> Symbology tab.4 In the Show panel, click Categories > Unique Values.5 Under Value Field, click LAnDUSE and click Add All Values.ArcMap assigns colors unique to each land use. Next, you’ll assign colors that are commonly used in zoning maps.<alt>Add All Values button on the Symbology tab.</alt>Double-click the symbol next to Battery Park City, click Fill Color, and choose Apple Dust (column 6, row 7 of the color palette) for the color and Gray 30% as the outline color. Click OK.<alt>Apple Dust color selected in the color palette.</alt>Assign a Gray 30% outline to the remaining symbols using the following colors (with column number, row number of the color palette included in parentheses).<alt>Zoning details are labeled on the map.</alt>YOUR TURnArcMap has predefined symbols for some zoning and land-use features. To view these, double-click the Park symbol > Style References > Civic > OK. Scroll through the Civicpolygon symbols and choose Park & Open Space. When finished, deselect Civic under Style References.<alt>Park & Open Space selected in the Symbol Selector window.</alt>Add points and create a definition queryOften a map layer has more classes of features than you want to display. In this case, you can use<alt>Query Builder with completed query.</alt>10 Click OK > OK to execute your query and close the Layer Properties window. Display points using unique symbolsNext you symbolize food facilities using unique symbols.In the Table Of Contents window, right-click the Facilities layer and click Properties > Symbology tab.In the Show panel, click Categories > Unique Values.Click Factype__1 as the Value field and click Add All Values.ArcMap assigns random unique symbols for each food facility type. Next, you assign three<alt>Symbology tab with selections made for food facility types.</alt>。
实验四地图符号的制作1 实验目的与要求1.1 实验目的(1)熟悉地图符号的构成要素;(2)熟悉并掌握Arcmap的基本操作利用Arcmap对文件的打开与存储,图形符号的绘制及编辑(3)通过在软件中改变地图符号的视觉变量来感受其对地图符号的表达效果的影响1.2 实验要求利用Arcmap设计并制作典型的点、线、面地图符号。
2 符号设计的基本步骤在我们制作以上几种符号之前,首先要单独创建一个自己的样式库即符号库,具体的做法是:启动ArcMap,点击Tools/styles/ style manager菜单项。
接着在弹出的style manager 对话框中点击style 的下拉按钮,在弹出的列表菜单中点击create new菜单项,最后在弹出的save对话框中选择符号库要保存的路径,敲入符号库文件名即可。
创建成功后可在style manager 对话框左边的树状列表中看到新建的符号库路径及名称(如图1)。
图1下面我们就开始具体介绍如何制作不同类型的地图符号。
(一)点状符号点状符号常用来表示在当前的比例尺和表示方式下,呈点状分布的地理实体和现象,不论符号大小,实际上以点的概念定位,而符号的面积不具有实地的面积意义。
这时,符号的大小与地图比例尺无关且具有定位特征。
它在图中的位置由一个点来确定,即符号的定位点,通常为符号的几何中心点或符号底部的中心点。
例如,控制点、居民点、及其他独立地物点等符号。
在ArcMap中所有做好的点符号均存放在符号库下属的marker symbols符号文件夹中。
ArcMap9.3的符号样式管理(style manage)中提供了四种类型点状符号的制作方法,它们分别是arrow marker symbol、character marker symbol、picture marker symbol和simple marker symbol。
(1)启动ArcMap,如果未创建符号库,需要创建符号库;如果已经创建符号库,需要添加符号库。
实验一地图符号的设计
一、实验目的:
1、学会Mapinfo和CorelDraw中地图符号的设计方法;
2、学会点、线、面符号的使用。
二、实验步骤提要:
在MapInfo软件中设计和使用地图符号
1、打开MapInfo
2、浏览点、线、面符号样式:
选项》线样式/区域样式/符号样式
3、设计位图格式的点状符号:
(1)创建自定义符号并将其保存为位图(可在WINDOWS画图窗口中完成)。
(2)将该位图文件置于目录MapInfo\Professional\CUSTSYMB。
(3)重新启动MapInfo(若正在运行的话)。
(4)打开工作空间“中国.wor”,选择地图》图层控制。
“图层控制”对话框出现。
(5)使希望放置符号的图层可编辑。
(6)选择选项》符号样式,“符号样式”对话框出现。
(7)单击“字体”下拉菜单从中选择“自定义符号(Custom Symbols)”。
(8)选择所创建的自定义符号,选择确定按钮。
(9)用符号工具在地图上单击以显示自定义符号。
4、设计矢量格式的点状符号:
(1)打开工具>工具管理器(如下图),在弹出的窗口中“符号”栏后面的方框选中。
(2)打开工具>符号>创建新符号
(3)在符号编辑器窗口中用直线、折线、多边形等工具绘制需要的符号(点、弧段、文本等不能用于符号制作)。
(4)如果需要在使用自定义符号时符号颜色可改变,选择打开工具>符号>颜色,在弹出的窗口中选中线(区域)对象颜色将在运行时可改变。
(5)保存创建的符号:工具>符号>保存,所创建的符号被保存练习1:设计如下点符号: 其中A 为每位同学各自姓名的每一个字。
用该符号绘制点
A
到符号库“MapInfo3.0 compatible”中。
(6)选项>符号样式,查看并利用自定义的符号绘制点状符号在CorelDRAW软件中设计和使用地图符号
1、设计一个点状符号
2、铁路符号
3、居民地符号。