【北师大心理统计学课件】7 多质多法
- 格式:ppt
- 大小:722.50 KB
- 文档页数:37
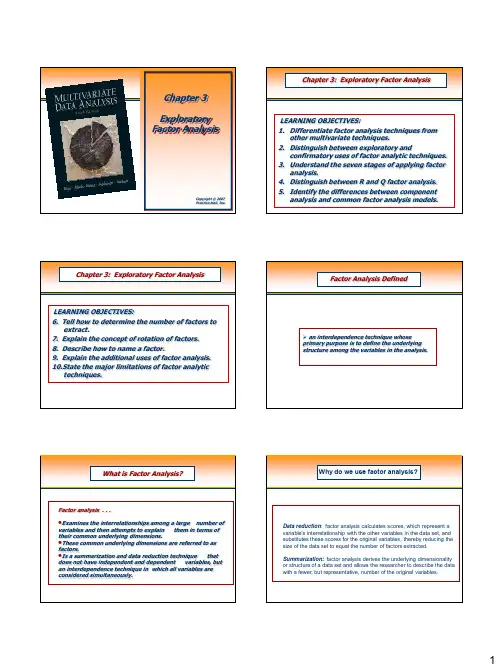
Chapter 3Exploratory Factor AnalysisCopyright © 2007Prentice-Hall, Inc.LEARNING OBJECTIVES:1.Differentiate factor analysis techniques fromother multivariate techniques.2.Distinguish between exploratory andconfirmatory uses of factor analytic techniques.3.Understand the seven stages of applying factoranalysis.4.Distinguish between R and Q factor analysis.5.Identify the differences between componentanalysis and common factor analysis models.Chapter 3: Exploratory Factor AnalysisLEARNING OBJECTIVES:6. Tell how to determine the number of factors toextract.7. Explain the concept of rotation of factors.8. Describe how to name a factor.9. Explain the additional uses of factor analysis.10.State the major limitations of factor analytictechniques.Chapter 3: Exploratory Factor Analysisan interdependence technique whoseprimary purpose is to define the underlying structure among the variables in the analysis.Factor Analysis DefinedFactor analysis . . .•Examines the interrelationships among a large number ofvariables and then attempts to explain them in terms of their common underlying dimensions.•These common underlying dimensions are referred to as factors.•Is a summarization and data reduction technique that does not have independent and dependent variables, but an interdependence technique in which all variables are considered simultaneously.What is Factor Analysis?Why do we use factor analysis?Data reduction : factor analysis calculates scores, which represent a variable's interrelationship with the other variables in the data set, and substitutes these scores for the original variables, thereby reducing the size of the data set to equal the number of factors extracted.Summarization:factor analysis derives the underlying dimensionality or structure of a data set and allows the researcher to describe the data with a fewer, but representative, number of the original variables.When do you use factor analysis?the analyst wishes to examine the underlying structure of a data matrixwhen analysts wish to understand the structure of the interrelationships among the variables in a data set, factor analysis is the appropriate analysis technique.How do you use factor analysis?Factor Analysis Decision ProcessStage 1: Objectives of Factor AnalysisStage 2: Designing a Factor AnalysisStage 3: Assumptions in Factor AnalysisStage 4: Deriving Factors and Assessing Overall Fit Stage 5: Interpreting the FactorsStage 6: Validation of Factor AnalysisStage 7: Additional uses of Factor Analysis ResultsStage 1: Objectives of Factor Analysis●Specify the unit of analysis.R factor analysis(variables)Q factor analysis(respondents)●Data summarization and/or reduction?●Variable selection●Using Factor analysis with other multivariatetechniques.Factor Analysis Outcomes1.Data summarization = derives underlyingdimensions that, when interpreted andunderstood, describe the data in a much smaller number of concepts than the original individual variables.2.Data reduction = extends the process of datasummarization by deriving an empirical value(factor score) for each dimension (factor) andthen substituting this value for the originalvalues.Stage 2: Designing a Factor AnalysisThree Basic Decisions:(1)Calculation of input data –R vs. Q analysis.R analysisQ analysis ≠cluster analysisStage 2: Designing a Factor AnalysisThree Basic Decisions:(2)Design of study in terms of number of variables,measurement properties of variables, and the type ofvariables.Minimize the number of variables included but still maintain a reasonable number of variables per factorIf a study is being designed to reveal factor structure,strive to have at least five variables for each proposedfactor.most often only on metric variables.A small number of ―dummy variables‖ can be included in aset of metric variables that are factor analyzed.Stage 2: Designing a Factor AnalysisThree Basic Decisions:(3)Sample size necessaryThe sample size should be 100 or larger.Sample sizes between 50 and 100 may beanalyzed but with extreme caution.The ratio of observations to variables should be at least 5 to 1in order to provide the most stableresults, the more acceptable sample size wouldhave a 10:1 ratio.Stage 3: Assumptions in Factor Analysis Conceptual issuesSome underlying structure does exit in the set of selected variables.Sample is homogeneous with respect to the underlying factor structureStatistical Assumptions •Multicollinearity.a substantial number of correlations greater than .30 areneeded.anti-image correlation matrix of partial correlationsthe Bartlett test of sphericity. A statistically significant Barlett test of sphericity(sig<0.5) indicates that sufficient correlations exist among the variables to proceed.Measure of sampling adequacy(MSA)Statistical Assumptions •Multicollinearity.▪Assessed using MSA (measure of sampling adequacy).The MSA is measured by the Kaiser-Meyer-Olkin(KMO) statistics. As a measure of sampling adequacy, the KMOpredicts if data are likely to factor well based on correlationand partial correlation. KMO can be used to identify whichvariables to drop from the factor analysis because they lackmulticollinearity.There is a KMO statistic for each individual variable, and their sum is the KMO overall statistic. KMO varies from 0 to1.0. Overall KMO should be .50 or higher to proceed withfactor analysis. If it is not, remove the variable with the lowestindividual KMO statistic value one at a time until KMO overallrises above .50, and each individual variable KMO is above .50.Rules of Thumb 3–2Testing Assumptions of Factor Analysis∙There must be a strong conceptual foundation to support the assumption that a structure does exist before the factoranalysis is performed.∙ A statistically significant Bartlett’s test of sphericity(sig. < .05) indicates that sufficient correlations exist among the variables to proceed.∙Measure of Sampling Adequacy (MSA) values must exceed .50 for both the overall test and each individual variable. Variables with values less than .50 should be omitted from the factoranalysis one at a time, with the smallest one being omittedeach time.Stage 4: Deriving Factors and AssessingOverall Fit•Selecting the factor extraction method –common vs. component analysis.•Determining the number of factors to represent the data.Extraction Decisions:•Which method?o Principal Components Analysis.o Common Factor Analysis.Principal Components vs. Common?Two Criteria:•Objectives of the factor analysis.•Amount of prior knowledge about the variance in the variables.Principal Components vs. Common?Total variance can be divided into three parts:•Common variance •Specific variance •Error varianceExtraction Method Determines theTypes of Variance Carried into the Factor MatrixDiagonal Value VarianceUnity (1)CommunalityTotal VarianceCommonSpecific and ErrorVariance extracted Variance not usedExtraction Decisions:●Principal components factor analysisMost appropriate when the concern is with deriving a minimum number of factors to explain a maximum portion of variance in the original variables, and the researcher knows the specific and error variances are small.(data reduction)●Common factor analysisMost appropriate when there is a desire to reveal latent dimensions of the original variables and the researcher does not know about the nature of specific and error variance.(well-theoretical application)Number of Factors?• A Priori Criterion.•Latent Root Criterion.•Percentage of Variance.•Scree Test Criterion•Heterogeneity of the respondentsEigenvalue Plot for Scree Test Criterion Rules of Thumb 3–3•Any decision on the number of factors to be retained should bebased on several considerations:✓use of several stopping criteria to determine the initial numberof factors to retain.✓A pre-determined number of factors based on researchobjectives and/or prior research.✓Enough factors to meet a specified percentage of varianceexplained, usually 60% or higher.✓Factors With Eigenvalues greater than 1.0.✓Factors shown by the scree test to have substantial amounts ofcommon variance (i.e., factors before inflection point).✓More factors when there is heterogeneity among samplesubgroups.•Consideration of several alternative solutions (one more and oneless factor than the initial solution) to ensure the best structure isidentified.Stage 5: Interpreting the FactorsProcesses of Factor Interpretation•Estimate the Factor Matrix.•Factor Rotation.•Factor Interpretation.•Respecification of factor model, if needed, mayinvolve:o Deletion of variables from analysis.o Desire to use a different rotational approach.o Need to extract a different number of factors.o Desire to change method of extraction.Rotation of Factors•Factor rotationunrotated factor solutions extract factors based on howmuch variance they account for, with each subsequentfactor accounting for less variance,the ultimate effect of rotating the factor matrix is toredistribute the variance from earlier factors to later onesto achieve a simpler, theoretically more meaningfulfactor pattern.Two Rotational Approaches:1.Orthogonal = axes are maintained at 90 degrees.2.Oblique = axes are not maintained at 90 degrees.Orthogonal Factor RotationUnrotated Factor IIUnrotated Factor IRotated Factor IRotated Factor II-1.0-.50+.50+1.0-.50-1.0+1.0+.50V 1V 2V 3V 4V 5Unrotated Factor IIUnrotated Factor IOblique Rotation:Factor IOrthogonalRotation: Factor II-1.0-.50+.50+1.0-.50-1.0+1.0+.50V 1V 2V 3V 4V 5Orthogonal Rotation: Factor IOblique Rotation:Factor IIOblique Factor RotationOrthogonal Rotation Methods:•Quartimax (simplify rows).•Varimax (simplify columns).•Equimax (combination).Oblique Rotation Methods:•OBLIMIN (SPSS).•PROMAX & ORTHOBLIQUE (SAS).Rules of Thumb 3–4Choosing Factor Rotation Methods∙Orthogonal rotation methods:o are the most widely used rotational methods.o are The preferred method when the research goal isdata reduction to either a smaller number of variables ora set of uncorrelated measures for subsequent use inother multivariate techniques.∙Oblique rotation methods:o best suited to the goal of obtaining several theoretically meaningful factors or constructs because, realistically,very few constructs in the “real world” are uncorrelated.Which Factor Loadings Are Significant?•Customary Criteria = Practical SignificanceGreater than +.30—minimum consideration level.+.40 —more important+.50 —practically significant (the factor accounts for 25% of variance in the variable).Which Factor Loadings Are Significant?•Sample Size & Statistical Significance.Given the sample size, the researcher may determine the level of factor loadings necessary to be significant at a predetermined level of power. For example, in a sample of 100 at an 80%power level, factor loadings of .55 and above are significant.Increases in the sample size; decreases the level necessary to consider a loading significant.Guidelines for Identifying SignificantFactor Loadings Based on Sample SizeFactor Loading Sample Size Neededfor Significance*.30350.35250.40200.45150.50120.55100.6085.6570.7060.7550*Significance is based on a .05 significance level (a), a power level of 80 percent, and standard errors assumed to be twice those of conventional correlation coefficients.Which Factor Loadings Are Significant?•Number of Factors ( = >) and/or Variables ( = <) Increases in the number of variables; decreases the level forsignificance.Increases in the number of factors extracted; increases the level necessary to consider a loading significant.Interpreting a Factor Matrix:1.Examine the factor matrix of loadings.2.Identify the highest loading across allfactors for each variable.3.Assess communalities of the variables.4.Respecify the Factor Model if neededbel the factors.Rules of Thumb 3–6Interpreting The Factors∙An optimal structure exists when all variables have high loadings only on a single factor.∙Variables that cross-load (load highly on two or more factors) are usually deleted unless theoretically justified or the objective isstrictly data reduction.∙Variables should generally have communalities of greater than .50 to be retained in the analysis.∙Respecification of a factor analysis can include options such as: o deleting a variable(s),o changing rotation methods, and/oro increasing or decreasing the number of factors.Label the factors●Naming the factor is based on an interpretation of the factor loadings.Significant loadings:The variables that most significantly load on each factor should be used in naming the factors. The variables' magnitude and strength provide meaning to the factors.Impact of the Rotation:The selection of a rotation method affects the interpretation of the loadings.Orthogonal rotation—each variable's loading on each factor isindependent of its loading on another factor.Oblique rotation—independence of the loadings is not preservedand interpretation then becomes more complex.An Example Of Factor InterpretationStep1&2 :Examine the factor loading matrixand identify significant loadingsAn Example Of Factor InterpretationStep1 &2:Examine the factor loading matrixand identify significant loadingsStep3:Assess communalitiesAn Example Of Factor InterpretationStep4:Respecify the factor model if neededAn Example Of Factor InterpretationStep5:Lable the factorsStage 6: Validation of Factor Analysis•Confirmatory Perspective.•Assessing Factor Structure Stability.Stability is highly dependent on sample size and the number ofobservations per variable.•Detecting Influential Observations.outliers should be determined by running the factor model with and without the influential observations.Stage 7: Additional Uses of Factor AnalysisResults•Selecting Surrogate Variables.•Creating Summated Scales.•Computing Factor Scores.Stage 7: Additional Uses of Factor AnalysisResults•The single surrogate variableA surrogate variable that is representative of the factormay be selected as the variable with the highestloading.✓Advantages: simple to administer and interpret.✓Disadvantages:1)does not represent all ―facets‖ of a factor2)prone to measurement error.Summated ScalesConceptual Definitionthe starting point for creating a scaleThe scale must appropriately measure what it purports to measure to assure content or face validity.Summated Scales •Dimensionalitymeaning that all items are strongly associated with each other and represent a single concept assessing its unidimensionality with exploratory or confirmatory factor analysisSummated ScalesReliabilityTest-retest reliabilityinternal consistency✓item-to-total correlation, inter-item correlation✓Cronbach’s alpha:o should exceed a threshold of .70, although a .60 level can be used in exploratory research.o the threshold should be raised as the number of items increases, especially as the number of items approaches 10 or more.Summated ScalesValidityConvergent validity ——scale correlates with other like scales Discriminant validity ——scale is sufficiently different from other related scalesNomological validity ——scale “predict” as theoreticallysuggestedRules of Thumb 3–8 Continued . . .•Summated scales:✓Advantages:1)compromise between the surrogate variable and factor score options.2)reduces measurement error.3)represents multiple facets of a concept.4)easily replicated across studies.✓Disadvantages:1)includes only the variables that load highly on the factor and excludes those having little or marginal impact.2)not necessarily orthogonal.3)Require extensive analysis of reliability and validity issues.Factor scores Factor scores, computed using all variables loading on a factor, may also be used as a compositereplacement for the original variable.Factor scores✓Advantages:1)represents all variables loading on the factor,2)best method for complete data reduction.3)Are by default orthogonal and can avoid complications caused by multicollinearity.✓Disadvantages:1)interpretation more difficult since all variables contribute through loadings2)Difficult to replicate across studies.DATA :HBAT.SAV (X 6-X 18)An illustrative exampleVariable DescriptionVariable Type Data Warehouse Classification Variables X1Customer Type nonmetricX2Industry Type nonmetric X3Firm Size nonmetric X4Region nonmetric X5Distribution System nonmetric Performance Perceptions Variables X6Product Quality metric X7E-Commerce Activities/Website metric X8Technical Support metric X9Complaint Resolution metric X10Advertising metric X11Product Line metric X12Salesforce Image metric X13Competitive Pricing metric X14Warranty & Claims metric X15New Products metric X16Ordering & Billing metric X17Price Flexibility metric X18Delivery Speedmetric Outcome/Relationship Measures X19Satisfaction metric X20Likelihood of Recommendation metric X21Likelihood of Future Purchase metric X22Current Purchase/Usage Level metric X23Consider Strategic Alliance/Partnership in FuturenonmetricDescription of HBAT Primary Database VariablesStage1 objectives of factor analysis✓Understand whether these perceptions canbe“grouped ”✓Reduce the 13 variables to a small numberStage2 Designing a factor analysis ✓R type factor analysis and a correlation matrix between variables✓all the variables are metric and constitute a homogeneousset of perceptions✓8:1 ratio of observations to observations to variables✓The sample size of 100 provides an adequate basis for thecalculation of the correlations between vatiablesStage3 Assumption in factor analysisStage3 Assumption in factor analysis Stage3 Assumption in factor analysisStage3 Assumption in factor analysis Component factor analysis:Stage4——deriving factors and assessing overall fitScree Test for HBAT Component Analysis Component factor analysis:Stage5——interpreting the factorsStep1:Examine the factor Matrix of loadings forthe Unrotated factor matrixStep2:identify the significant loadings in theUnrotated factor matrixStep3:assess the communalities of thevariables in the Unrotated factor matrixComponent factor analysis:Stage5——interpreting the factors Component factor analysis:Stage5——interpreting the factorsOrthogonal (VARIMAX) RotationAsses the significant Factor loadings and communalities of the Rotated Factor MatrixComponent factor analysis:Stage5——interpreting the factors Component factor analysis:Stage5——interpreting the factorsComponent factor analysis:Stage5——interpreting the factors Step 4 : Respecify the Factor if needed Step 5: Naming the factorsComponent factor analysis:Stage5——interpreting the factorsApplying an oblique RotationComponent factor analysis:Stage5——interpreting the factors Component factor analysis:Stage6——Validation of factor analysisIn this examplesplit the sample into two equal samples of 50respondents and reestimate the factor models to test for comparabilityComponent factor analysis:Stage6——Validation of factor analysis Component factor analysis:Stage6——Validation of factor analysisComponent factor analysis:Stage7——additional uses of the factor analysis resultsComponent factor analysis:Stage7——additional uses of the factor analysis resultsCommon factor analysis:Stage4Common factor analysis:Stage4Common factor analysis:Stage5Common factor analysis:Stage5Common factor analysis:Stage5Summary1.Differentiate factor analysis techniques fromother multivariate techniques2.Distinguish EFA & CFA3.Understand the seven stages of applyingfactor analysis4.Distinguish between R&Q factor analysis5.Identify the differences between componentanalysis and common factor analysis models6.Tell how to determine the number of factorsto extract7.Explain the concept of rotation of factors8.Describe how to name a factor9.Explain the additional uses of factor analysis。


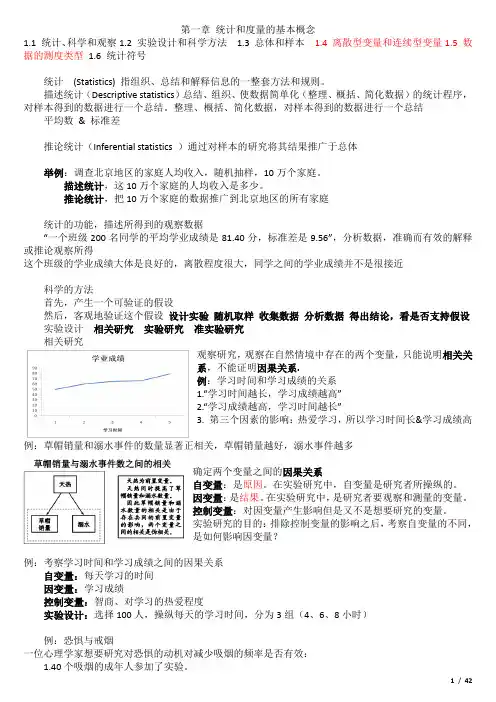
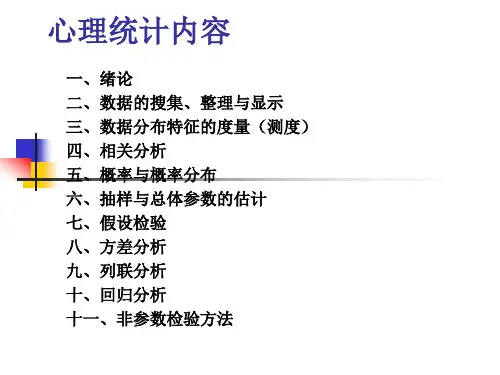
第一章统计和度量的基本概念1.1 统计、科学和观察1.2 实验设计和科学方法 1.3 总体和样本 1.4 离散型变量和连续型变量1.5 数据的测度类型 1.6 统计符号统计(Statistics) 指组织、总结和解释信息的一整套方法和规则。
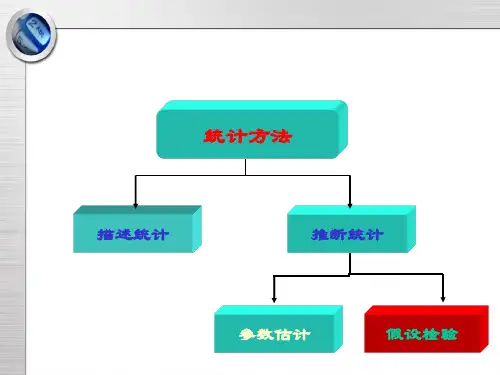
描述统计(Descriptive statistics)总结、组织、使数据简单化(整理、概括、简化数据)的统计程序,对样本得到的数据进行一个总结。
整理、概括、简化数据,对样本得到的数据进行一个总结平均数& 标准差推论统计(Inferential statistics )通过对样本的研究将其结果推广于总体举例:调查北京地区的家庭人均收入,随机抽样,10万个家庭。
描述统计,这10万个家庭的人均收入是多少。
推论统计,把10万个家庭的数据推广到北京地区的所有家庭统计的功能,描述所得到的观察数据“一个班级200名同学的平均学业成绩是81.40分,标准差是9.56”,分析数据,准确而有效的解释或推论观察所得这个班级的学业成绩大体是良好的,离散程度很大,同学之间的学业成绩并不是很接近科学的方法首先,产生一个可验证的假设然后,客观地验证这个假设设计实验随机取样收集数据分析数据得出结论,看是否支持假设实验设计相关研究实验研究准实验研究相关研究观察研究,观察在自然情境中存在的两个变量,只能说明相关关系,不能证明因果关系.例:学习时间和学习成绩的关系1.“学习时间越长,学习成绩越高”2.“学习成绩越高,学习时间越长”3. 第三个因素的影响:热爱学习,所以学习时间长&学习成绩高例:草帽销量和溺水事件的数量显著正相关,草帽销量越好,溺水事件越多确定两个变量之间的因果关系自变量:是原因。
在实验研究中,自变量是研究者所操纵的。
因变量:是结果。
在实验研究中,是研究者要观察和测量的变量。
控制变量:对因变量产生影响但是又不是想要研究的变量。
实验研究的目的:排除控制变量的影响之后,考察自变量的不同,是如何影响因变量?例:考察学习时间和学习成绩之间的因果关系自变量:每天学习的时间因变量:学习成绩控制变量:智商、对学习的热爱程度实验设计:选择100人,操纵每天的学习时间,分为3组(4、6、8小时)例:恐惧与戒烟一位心理学家想要研究对恐惧的动机对减少吸烟的频率是否有效:1.40个吸烟的成年人参加了实验。


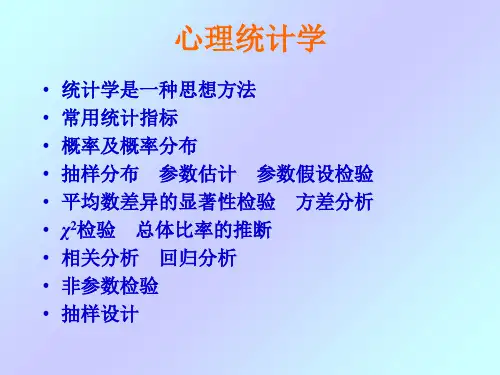
心理统计学(全套课件)第一部分:心理统计学导论一、引言心理统计学是心理学研究中的重要工具,它帮助我们从大量数据中提取有意义的信息,以便更好地理解人类行为和心理过程。
本课程将介绍心理统计学的基本概念、原理和方法,以及如何运用这些工具来分析心理学数据。
二、心理统计学的基本概念1. 变量:在心理学研究中,变量是指可以被测量的特征或属性。
变量可以分为连续变量和离散变量,以及自变量和因变量。
2. 数据:数据是变量的具体值,可以是数值型数据或非数值型数据。
3. 样本与总体:样本是从总体中抽取的一部分个体,而总体是所有可能个体的集合。
4. 随机抽样:随机抽样是从总体中随机抽取样本的过程,以确保样本能够代表总体。
三、描述性统计1. 频数分布:频数分布是描述数据分布情况的一种方法,它显示了每个数值或数值区间出现的次数。
2. 集中趋势:集中趋势是指数据分布的中心位置,常用的指标有均值、中位数和众数。
3. 离散程度:离散程度是指数据分布的分散程度,常用的指标有方差、标准差和变异系数。
四、推断性统计1. 概率与概率分布:概率是描述事件发生可能性大小的数值,概率分布是描述随机变量取值的概率分布情况。
2. 假设检验:假设检验是通过对样本数据进行统计分析,来判断总体参数是否符合某种假设的方法。
3. 参数估计:参数估计是通过对样本数据进行统计分析,来估计总体参数的方法。
五、心理统计学软件1. SPSS:SPSS是一种常用的心理统计学软件,它提供了丰富的数据分析功能,包括描述性统计、推断性统计、数据管理等功能。
2. R语言:R语言是一种开源的统计编程语言,它提供了强大的数据分析功能,包括数据可视化、机器学习等功能。
心理统计学是心理学研究中的重要工具,它帮助我们从大量数据中提取有意义的信息,以便更好地理解人类行为和心理过程。
本课程将介绍心理统计学的基本概念、原理和方法,以及如何运用这些工具来分析心理学数据。
通过学习本课程,学生将能够掌握心理统计学的基本知识和技能,为今后的心理学研究打下坚实的基础。