聚合物近代测试及表征DTA、DSC、TG、DTG..
- 格式:ppt
- 大小:1.26 MB
- 文档页数:37
1.在涉及高聚物力学行为的场合下,必须同时考虑应变、应力、温度、时间四个参数。
2.测定链结构的方法:X射线衍射法(大角),电子衍射法,紫外吸收光谱,红外吸收光谱,拉曼光谱,核磁共振法,荧光光谱,旋光分光法,电子能谱。
3.测定聚集态结构的方法:X射线小角散射,电子衍射法,电子显微镜(TEM、SEM),原子力显微镜。
4.测定结晶度的方法:X射线衍射法,电子衍射法,核磁共振吸收(宽线),红外吸收光谱,密度法,热分析法。
5.高聚物本身从某种模式分子运动状态改变到另一种平衡模式分子运动的状态,这就是转变,或称松弛。
6.测定体积的变化:膨胀计法,折射系数测定法测定热学性质的方法:差热分析法(DTA),差示扫描量热法(DSC)测定力学性质的变化的方法:热机械法,应力松弛法测定电磁效应:介电松弛,核磁共振第一章波谱分析1.中红外区,波长:2um~25um;运动形式:分子基频振动;光谱法:红外光谱第二章红外光谱IR(分子振动-转动光谱)1.红外光区在电磁总谱中指波长在750nm~1000um的区域。
分成近红外区,中红外区,远红外区。
2.复杂分子的简正振动分为两类:伸缩振动和弯曲振动伸缩:指原子沿着键轴方向伸缩使键长发生变化的振动方式。
特点:键长变化,键角基本不变弯曲振动:变形振动。
特点:键长不变化,键角发生变化(周期性)3.红外光谱两种表示方法。
(横坐标相同,纵坐标不同)a.记录原始光强在通过样品后透过光的强度变化百分比(透过率T)b.记录样品吸收的红外光强度(吸光度A)T=I/I0³100% A=lg1/T=lgI0/I I0:入射光强度 I:透过光强度4.通常把能代表某种基团存在并有较高强度的吸收峰称为基团的特征吸收峰,此峰所在的频率称为基团的特征吸收频率。
P11表2-1!5.聚合物的红外光谱图能反应:①聚合物结构单元的化学组成,单体之间的连接方式;②特殊结构如支化,交联及序列分布6.制样方法:溶液流延薄膜法,热压薄膜法(用于聚烯烃),溴化钾压片法(粉末状),切片法,可拆卸液体池法(低聚物,有机物)7.影响吸收谱带位移的内部因素a.诱导效应(I效应)与电负性有关b.共轭效应(C效应)吸收频率低c.氢键效应伸缩振动:作用越强,吸收频率下降,谱带变宽;弯曲振动:氢键形成,吸收频率升高,谱带变窄d.偶合效应分子内两个基团位置很近,振动频率很近,发生振动偶合8.影响谱图质量因素:仪器参数的影响,环境因素。
实验 聚合物的差热分析(DTA )和差动热分析(DSC)一、实验目的1.了解聚合物差热分析(DTA)和差动热分析(DSC)的基本原理和应用,及相互间的差别。
2.初步掌握解释聚合物DTA 和DSC 热谱图的方法。
3.了解CDR-4P 差热分析仪的构造原理、基本操作。
4.熟练掌握使用CDR-4P 差热分析仪分别测量聚合物差热分析(DTA)和差动热分析(DSC)。
二、实验原理热分析是测量在受控程序温度条件下,物质的物理性能随温度变化的函数关系的一组技术。
目前热分析已经发展成为系统的分析方法,它对于材料的研究是一种极为有用的工具,特别是在高聚合物的分析测定方面应用更为广泛。
它不仅能获得结构方面的信息,而且还能测定性能,热分析仪已成为从事材料测试的实验室必备的仪器。
差热分析是测定试样在受热(或冷却)过程中,由于物理变化或化学变化所产生的热效应来研究物质转化及化学反应的一种分析方法,(即在程序温度下,测量物质与参比物的温度差值△T 与温度的函数关系。
△T 向上为放热反应,向下为吸热反应)简称DTA (Differential Thermal Analysis )。
可用于测定物质在热反应时的特征温度及吸热或放出的热量,包括物质相变、分解、化合、凝固、脱水、蒸发等,尤其在聚合物(如聚烯烃、玻璃钢等)的热分析方面有重要意义。
差动热分析(DSC) 也叫做示差扫描热量法(Differential Scanning Calorimetry ),是在程序温度下,测量物质与参比物的功率差值△W 与温度的函数关系。
是和DTA 在应用上相近而在原理上稍有改进的一种热分析技术。
差动热分析仪CDR-4P 用于测定物质在热反应时的特征温度及吸热或放出的热量,包括物质相变、分解、化合、凝固、脱水、蒸发等物理或化学反应,广泛应用于无机、硅酸盐、陶瓷、矿物金属、航天耐温材料等领域。
是无机、有机、特别是高分子聚合物、玻璃钢等方面热分析的重要仪器。
聚合物三种Tg测试⽅法(DSC,DMA,TMA)The thermal properties of polymeric materials are important to the function of components and assemblies that will operate in warm environments. Glass Transition Temperature (referred herein as Tg) is the point at which a material goes from a hard brittle state to a soft rubbery state. Amorphous polymers only have a Tg. Crystalline polymers exhibit a Tm (melt temperature) and typically a Tg since there is usually an amorphous portion as well ("semi"-crystalline). Identifying the Tg of polymers is of interest for various reasons, but is most often used for quality control and research and development.There are three general techniques for measuring Tg:Differential Scanning Calorimetry (DSC) – This is probably the most traditional and common technique for most polymeric materials. Simply stated, DSC utilizes a heat flow technique and compares the amount of heat supplied to the test sample and a similarly heated "reference" to determine transition points. Tg is typically calculated by using a half-height technique in the transition region. The heating rate and sample heat history are a couple of factors that may affect the test result. Depending on the equipment capability, DSC can be used for a wide range of thermoplastic and thermoset polymers. For materials that have broad Tg's, DSC may not be sensitive enough to show a large enough transition for calculation purposes.Thermal Mechanical Analysis (TMA) – TMA is used to measure Coefficient of Thermal Expansion (CTE) of polymers. TMA uses a mechanical approach for measuring Tg. A sensitive probe measures the expansion of the test specimen when heated. Polymers typically expand as temperature is increased. From the expansion curve, a CTE canbe calculated over a temperature range. If a material goes through a Tg during a TMA test, the curve shape changes significantly and Tg can be calculated by using an onset technique. Amorphous polymers would typically not utilize the TMA approach because the material would soften to the point where the probe penetrates into the sample. Samples that remain somewhat rigid through Tg would be good candidates for Tg by TMA. The heating rate chosen can affect the Tg. Dynamic Mechanical Analysis (DMA) – DMA is probably the most sensitive technique (of the discussed methods)for Tg analysis. DMA measures the response of a material to an applied oscillatory strain (or stress), and how that response varies with temperature, frequency, or both. DMA is able to separate and measure the elastic and viscous components of polymers. How the material responds to the temperature increase can be illustrated by various means on the DMA graph. There are three typical approaches for reporting Tg by DMA. All techniques are viable but may yield different results. Several results may include: 1) Onset of the storage modulus curve; 2) Peak of the loss modulus curve; and/or 3) Peak of the Tan Delta curve.There also are different modes of oscillation used for DMA such as torsional, single and dual cantilever, tension, compression, three-point bend and compression. Various heating rates, frequencies and strains can be utilized as well. All of these variables can affect the Tg. Compared to DSC, DMA can be 10 to 100 times more sensitive to the changes occurring at the Tg. DMA is useful for polymers with difficult to find Tg's such as epoxies, polymers with Tg's well below ambient temperature and highly crosslinked polymers. It is important to note Tg by DMA can vary significantly from one reporting technique to the next.As you can see there are various approaches to obtain Tg of polymeric materials. Sometimes trial and error has to be used to see what technique is best. It is extremely important to know which technique and test parameters were used to determine Tg if comparing back to historical data. Similarly, if testing to a specification or industry standard, the technique and test parameters must be well defined. Even within a test technique, the means of obtaining the Tg can be performed various ways and the result can vary significantly. The Tg by DSC, TMA or DMA rarely will be the same and can vary by as much as 20°C or more.转⾃:Techniques for Obtaining Glass Transition Temperature of Polymeric Materials原⽂后⾯有条评论可以看看:DMA is probably the best equipment for this. It is typically preferable to have homogenous specimens for DMA testing, but it is unlikely DSC or TMA is going to be able to detect the Tg of the FRP or the Silicone. Since you have a multi-layer specimen, there may be some challenges in obtaining the Tg of both components. Depending on your objective, you may need to isolate the silicone layer from the FRP and test them separately.另外,我看了⼀家⽇本卖测试仪器的,对这些指标也做了些介绍,有兴趣可以看看。
聚合物的热谱分析——差示扫描量热法(DSC)一、实验目的1.了解DTA、DSC的原理。
2.掌握用DTA、DSC测定聚合物的T g、T c、T m、X D。
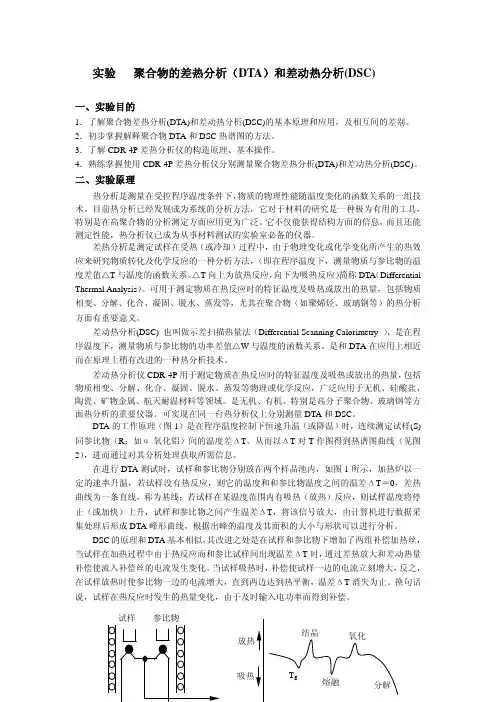
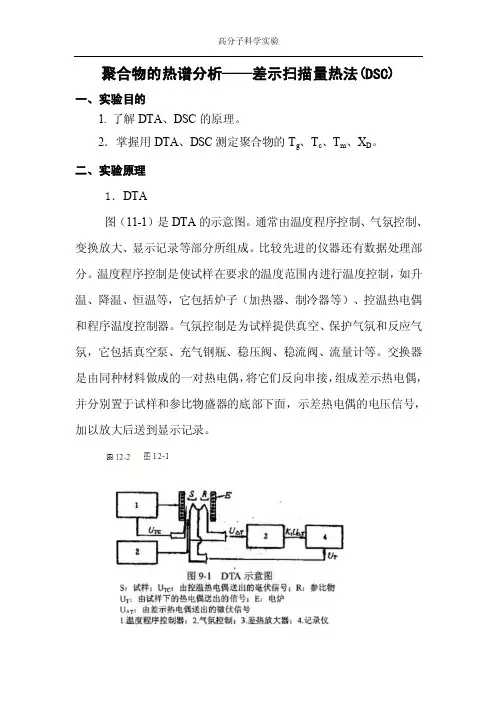
二、实验原理1.DTA图(11-1)是DTA的示意图。
通常由温度程序控制、气氛控制、变换放大、显示记录等部分所组成。
比较先进的仪器还有数据处理部分。
温度程序控制是使试样在要求的温度范围内进行温度控制,如升温、降温、恒温等,它包括炉子(加热器、制冷器等)、控温热电偶和程序温度控制器。
气氛控制是为试样提供真空、保护气氛和反应气氛,它包括真空泵、充气钢瓶、稳压阀、稳流阀、流量计等。
交换器是由同种材料做成的一对热电偶,将它们反向串接,组成差示热电偶,并分别置于试样和参比物盛器的底部下面,示差热电偶的电压信号,加以放大后送到显示记录。
参比物应选择那些在实验温度范围内不发生热效应的物质,如α-Al2O3、石英粉、MgO粉等,它的热容和热导率与样品应尽可能相近,当把参比物和试样同置于加热炉中的托架上等速升温时,若试样不发生热效应,在理想情况下,试样温度和参比物温度相等,ΔT=0,差示热电偶无信号输出,记录仪上记录温差的笔仅划一条直线,称为基线。
另一支笔记参比物温度变化。
而当试样温度上升到某一温度发生热效应时,试样温度与参比物温度不再相等,ΔT≠0,差示热电偶有信号输出,这时就偏离基线而划出曲线。
ΔT随温度变化的曲线即DTA曲线。
温差ΔT作纵坐标,吸热峰向下,放热峰向上。
炉子的温度T w以一定的速度变化,基准物的温度T r在t=0时与T w相等。
但当T w开始随时间增加时,由于基准物与容器有热容C r,发生一定的滞后;试样温度T s也相同,不同的热容,滞后的时间也不同,T w、T r、T s之间出现差距,在试样不发生任何热变化时ΔT呈定值,如图12-2所示。
其值与热容、热导和升温速度有关。
而热容、热导又随温度变化,这样,在整个升温过程中基线会发生不同程度的漂移。

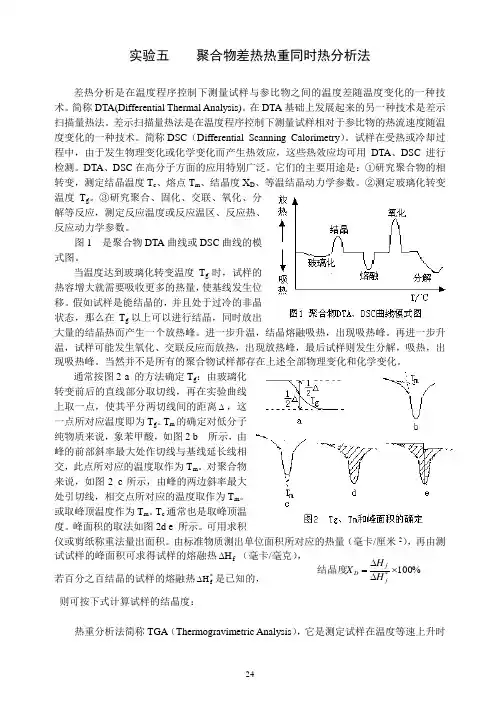
实验五 聚合物差热热重同时热分析法差热分析是在温度程序控制下测量试样与参比物之间的温度差随温度变化的一种技术。
简称DTA(Differential Thermal Analysis)。
在DTA 基础上发展起来的另一种技术是差示扫描量热法。
差示扫描量热法是在温度程序控制下测量试样相对于参比物的热流速度随温度变化的一种技术。
简称DSC (Differential Scanning Calorimetry )。
试样在受热或冷却过程中,由于发生物理变化或化学变化而产生热效应,这些热效应均可用DTA 、DSC 进行检测。
DTA 、DSC 在高分子方面的应用特别广泛。
它们的主要用途是:①研究聚合物的相转变,测定结晶温度T c 、熔点T m 、结晶度X D 、等温结晶动力学参数。
②测定玻璃化转变温度T g 。
③研究聚合、固化、交联、氧化、分解等反应,测定反应温度或反应温区、反应热、反应动力学参数。
图1 是聚合物DTA 曲线或DSC 曲线的模式图。
当温度达到玻璃化转变温度T g 时,试样的热容增大就需要吸收更多的热量,使基线发生位移。
假如试样是能结晶的,并且处于过冷的非晶状态,那么在T g 以上可以进行结晶,同时放出大量的结晶热而产生一个放热峰。
进一步升温,结晶熔融吸热,出现吸热峰。
再进一步升温,试样可能发生氧化、交联反应而放热,出现放热峰,最后试样则发生分解,吸热,出现吸热峰。
当然并不是所有的聚合物试样都存在上述全部物理变化和化学变化。
通常按图2 a 的方法确定T g :由玻璃化转变前后的直线部分取切线,再在实验曲线上取一点,使其平分两切线间的距离∆,这一点所对应温度即为T g 。
T m 的确定对低分子纯物质来说,象苯甲酸,如图2 b 所示,由峰的前部斜率最大处作切线与基线延长线相交,此点所对应的温度取作为T m 。
对聚合物来说,如图2 c 所示,由峰的两边斜率最大处引切线,相交点所对应的温度取作为T m 。


聚合物检测方法聚合物是由重复单元组成的高分子化合物,应用广泛于塑料制品、橡胶制品、纺织品、化妆品等领域。
随着聚合物制品的不断增多和应用领域的不断拓展,对聚合物的检测方法也提出了更高的要求。
本文将从传统的物理检测方法到现代的化学和生物技术检测方法进行综合介绍,以期为聚合物检测领域的科研和实践工作者提供一些参考和借鉴。
一、传统的物理检测方法1. 热分析法热分析法是通过测量聚合物在一定温度范围内的热学性质来判断其性能的一种方法。
其中包括差热分析法(DSC)、热重分析法(TGA)等。
通过观察聚合物在升温或降温过程中的吸热、放热,以及失重情况,可以初步判断其组成和性质。
2. 拉伸实验拉伸实验是一种简单直观的物理检测方法,通过对聚合物样品在一定温度下的拉伸过程进行观察,获得相关的拉伸特性参数。
这种方法适用于常见的塑料和橡胶制品,可以直接反映材料的物理性能。
二、化学分析方法1. 光谱分析紫外-可见光谱(UV-Vis)、红外光谱(FTIR)、核磁共振氢谱(HNMR)等光谱分析方法可用于聚合物材料的结构表征和成分分析。
通过检测聚合物在特定波长下的吸收、发射或散射情况,可以分析其分子链结构和可能的功能团。
2. 质谱分析质谱分析是一种高灵敏度的化学分析方法,适用于聚合物样品中微量成分的检测。
通过检测聚合物样品中分子离子的质荷比,可以确定其相对分子质量、分子结构和可能的附加元素。
三、生物技术检测方法1. 核酸检测法聚合物中常常携带有一定的核酸成分,利用聚合酶链式反应(PCR)等核酸检测技术可以对聚合物样品中的核酸成分进行扩增和鉴定。
这种方法对于化妆品等含有生物成分的聚合物制品有着重要的应用价值。
2. 生物传感器检测法生物传感器是一种利用生物材料(如酶、抗体)和传感器结合的检测技术。
通过将特定的生物材料与聚合物样品接触,观察其生物传感反应产生的信号变化,可以实现对聚合物样品中特定成分的快速检测和定量分析。
随着科学技术的发展,聚合物检测方法也在不断创新和完善。
334现代企业教育MODERN ENTERPRISE EDUCATION在历次教学过程中,教员都会强调学习讨论和研究的重要性,尤其是对我校集体生活的学员来说,互助学习的重要作用更为凸显。
学习互助的方式很多,例如,学员队可根据学员的实际情况,指定学习优秀的学员充当“小教员”,以辅导的形式组成学习帮扶小组。
或者是,由教员制定讨论话题,在教员的指导下,由学员队定期组织学习研讨活动,帮助所有学员巩固和强化所学内容,达到教学相长的效果,促进共同进步。
四、结束语函数连续性教学中透露出的问题在学员学习本课程的过程具有一定的普遍性,教员在分析原因和制定措施时都要从学员的现实情况考虑,充分结合自身的教学实际,多思考多总结,突出针对性和实用性。
只有这样,教员在教学中才能不断提高教学水平,促进教学质量和教学层次的不断提升。
参考文献:[1]吴振英.论极限的思想方法[J ].广州大学学报(自然科学版),2003,10.[2]张奠宙.教育数学是具有教育形态的数学[J ].数学教育学报,2005.8.[3]辛志英,王升.保证主体教学有效性的策略[J ].课程·教材·教法,2009,(5):21.聚合物材料表征与测试课程教学浅析王倡春(南京工程学院211167)聚合物材料表征与测试是南京工程学院高分子材料与工程专业的一门专业必修课。
该课程安排在大学第七学期,是在学生学习了高分子物理,高分子化学等专业基础课后开设的一门课程。
该课程主要是利用近现代发展的仪器来研究聚合物分子链的结构、分子链聚集体的结构、链长的分布等内容,理论性较强。
课程中介绍的仪器众多,各种仪器的原理复杂,涉及物理理论、数学处理等内容,难度较大。
通过该课程的学习,能够让高分子材料与工程等相关专业的本科生掌握高分子材料性能的表征及结果分析的方法,了解现代测试技术在高分子领域中的应用,培养学生的动手能力。
该课程主要包括波谱分析、聚合物的相对分子质量及相对分子质量分布表征、热分析、高聚物流变性能以及显微分析技术等五个方面。
TG,TMA,DSC,DMA,DETA五大材料热性能分析,材料人必看热分析简介热分析的本质是温度分析。
热分析技术是在程序温度(指等速升温、等速降温、恒温或步级升温等)控制下测量物质的物理性质随温度变化,用于研究物质在某一特定温度时所发生的热学、力学、声学、光学、电学、磁学等物理参数的变化,即P = f(T)。
按一定规律设计温度变化,即程序控制温度:T = (t),故其性质既是温度的函数也是时间的函数:P =f (T, t)。
材料热分析意义:在表征材料的热性能、物理性能、机械性能以及稳定性等方面有着广泛的应用,对于材料的研究开发和生产中的质量控制都具有很重要的实际意义。
热分析简史回顾常用热分析方法解读根据国际热分析协会(ICTA)的归纳和分类,目前的热分析方法共分为九类十七种,常用的热分析方法包括热重分析法(TG)、差示扫描量热法(DSC)、静态热机械分析法(TMA)、动态热机械分析(DMTA)、动态介电分析(DETA)等,它们分别是测量物质重量、热量、尺寸、模量和柔量、介电常数等参数对温度的函数。
(1) 热重分析(TG)热重法(TG)是在程序温度控制下测量试样的质量随温度或时间变化的一种技术。
应用范围:(1)主要研究材料在惰性气体中、空气中、氧气中的热稳定性、热分解作用和氧化降解等化学变化;(2)研究涉及质量变化的所有物理过程,如测定水分、挥发物和残渣、吸附、吸收和解吸、气化速度和气化热、升华速度和升华热、有填料的聚合物或共混物的组成等。
原理详解:样品重量分数w对温度T或时间t作图得热重曲线(TG 曲线):w = f (T or t),因多为线性升温,T与t只差一个常数。
TG曲线对温度或时间的一阶导数dw/dT 或 dw/dt 称微分热重曲线(DTG曲线)。
图1 热重曲线(TG曲线)图2中,B点Ti处的累积重量变化达到热天平检测下限,称为反应起始温度;C点Tf处已检测不出重量的变化,称为反应终了温度;Ti或Tf亦可用外推法确定,分为G点H点;亦可取失重达到某一预定值(5%、10%等)时的温度作为Ti。
《近代测试及表征技术》教材大纲一、课程基本信息课程名称(中、英文):《近代测试及表征技术》(Modern Technology of Test and Characterization)课程号(代码):300027020课程类别:专业选修课学时: 32 学分:2二、教学目的及要求近代测试及表征技术是应用近代仪器分析的基本原理,研究聚合物链的结构、单体结构单元、谱图解析、分析试样及各种仪器在高聚物中应用的一门科学。
本课程为高分子化学、化工、材料等相关专业本科生今后毕业论文的材料结构表征、成分和表面分析打下良好的理论基础,培养实际解谱能力,学会怎样应用近代仪器分析手段进行高分子材料的研究。
本课程安排总学时32学时,共12周。
对毕业要求及其分指标点支撑情况:(1)毕业要求 1,分指标点1.4和1.5;(2)毕业要求2,分指标点2.4和2.5;(3)毕业要求3,分指标点3.4;(4)毕业要求6,分指标点6.2;三、教学内容(含各章节主要内容、学时分配,并用*号方式注明重点难点)第一章绪论(1学时)简要介绍高分子近代分析的研究对象,高分子近代仪器分析方法及仪器,高分子的研究和分析方法概述。
使学生对本课程的重要性及学习内容方法建立整体概念。
要点:高分子近代分析的研究对象、定义和重要性(举例)高分子近代仪器分析方法分类及仪器高分子的研究和分析方法概述。
课程学习的目的、方法和要求第二章光谱分析(3~9学时)介绍紫外光谱基本原理及分子结构,紫外光谱技术在高分子中的应用。
红外光谱基本原理及分子结构,红外光谱图谱解析方法,红外光谱技术在高分子分析鉴定中的应用。
激光拉曼光谱,激光拉曼光谱高分子中的应用。
要点:紫外光谱基本原理及分子结构*紫外光谱技术在高分子中的应用红外光谱基本原理及分子结构*红外光谱图谱解析方法*红外光谱技术在高分子分析鉴定中的应用*激光拉曼光谱理论*激光拉曼光谱高分子中的应用。
布置作业及思考题第三章核磁共振波谱 (6学时)介绍1H-核磁共振波谱,13C-核磁共振波谱的基本原理、产生条件和影响化学位移因素,核磁共振波谱在高聚物研究中的应用。