医学统计学课件--主成分分析与因子分析(第20章)解析
- 格式:ppt
- 大小:1.14 MB
- 文档页数:8


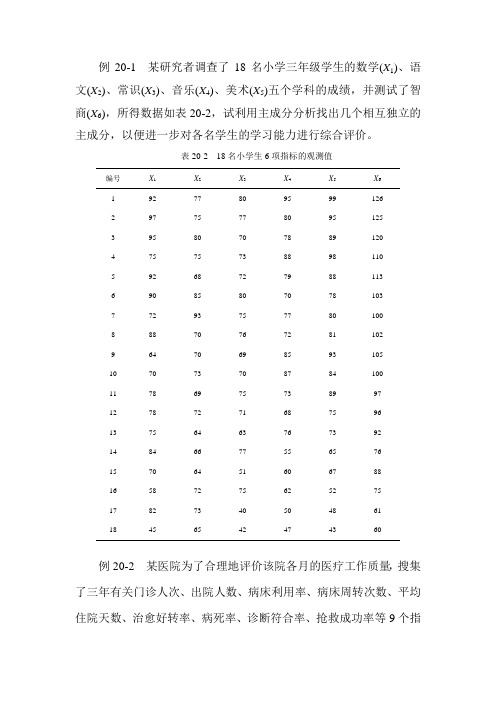
例20-1 某研究者调查了18名小学三年级学生的数学(X1)、语文(X2)、常识(X3)、音乐(X4)、美术(X5)五个学科的成绩,并测试了智商(X6),所得数据如表20-2,试利用主成分分析找出几个相互独立的主成分,以便进一步对各名学生的学习能力进行综合评价。
表20-2 18名小学生6项指标的观测值编号XX2X3X4X5X611 92 77 80 95 99 1262 97 75 77 80 95 1253 95 80 70 78 89 1204 75 75 73 88 98 1105 92 68 72 79 88 1136 90 85 80 70 78 1037 72 93 75 77 80 1008 88 70 76 72 81 1029 64 70 69 85 93 10510 70 73 70 87 84 10011 78 69 75 73 89 9712 78 72 71 68 75 9613 75 64 63 76 73 9214 84 66 77 55 65 7615 70 64 51 60 67 8816 58 72 75 62 52 7517 82 73 40 50 48 6118 45 65 42 47 43 60例20-2 某医院为了合理地评价该院各月的医疗工作质量,搜集了三年有关门诊人次、出院人数、病床利用率、病床周转次数、平均住院天数、治愈好转率、病死率、诊断符合率、抢救成功率等9个指标数据,如表20-8。
现采用因子分析方法,探讨其综合评价指标体系。
表20-8 某医院三年的医疗工作质量有关指标实测值年月X0门诊人次X1出院人数X2病床利用率X3病床周转次数X4平均住院天数X5治愈好转率X6(%)病死率X7(%)诊断符合率X8(%)抢救成功率X9(%)91.01 4.34 389 99.06 1.23 25.46 93.15 3.56 97.51 61.66 91.02 3.45 271 88.28 0.85 23.55 94.31 2.44 97.94 73.33 91.03 4.38 385 103.97 1.21 26.54 92.53 4.02 98.48 76.79 91.04 4.18 377 99.48 1.19 26.89 93.86 2.92 99.41 63.16 91.05 4.32 378 102.01 1.19 27.63 93.18 1.99 99.71 80.00 91.06 4.13 349 97.55 1.10 27.34 90.63 4.38 99.03 63.16 91.07 4.57 361 91.66 1.14 24.89 90.60 2.73 99.69 73.53 91.08 4.31 209 62.18 0.52 31.74 91.67 3.65 99.48 61.11 91.09 4.06 425 83.27 0.93 26.56 93.81 3.09 99.48 70.73 91.10 4.43 458 92.39 0.95 24.26 91.12 4.21 99.76 79.07 91.11 4.13 496 95.43 1.03 28.75 93.43 3.50 99.10 80.4991.12 4.10 514 92.99 1.07 26.31 93.24 4.22 100.00 78.9592.01 4.11 490 80.90 0.97 26.90 93.68 4.97 99.77 80.53 92.02 3.53 344 79.66 0.68 31.87 94.77 3.59 100.00 81.97 92.03 4.16 508 90.98 1.01 29.43 95.75 2.77 98.72 62.86 92.04 4.17 545 92.98 1.08 26.92 94.89 3.14 99.41 82.35 92.05 4.16 507 95.10 1.01 25.82 94.41 2.80 99.35 60.61 92.06 4.86 540 93.17 1.07 27.59 93.47 2.77 99.80 70.21 92.07 5.06 552 84.38 1.10 27.56 95.15 3.10 98.63 69.23 92.08 4.03 453 72.69 0.90 26.03 91.94 4.50 99.05 60.42 例题20-1(EX20-1.dta):. factor x1-x6,pc means(obs=18)Variable | Mean Std. Dev. Min Max-------------+----------------------------------------------------x1 | 78.05556 13.73048 45 97x2 | 72.83333 7.48528 64 93x3 | 68.66667 12.09278 40 80x4 | 72.33333 13.35048 47 95x5 | 77.61111 16.92245 43 99x6 | 97.16667 19.43087 60 126(principal components; 6 components retained)Component Eigenvalue Difference Proportion Cumulative------------------------------------------------------------------1 3.98290 3.15150 0.6638 0.66382 0.83141 0.16837 0.1386 0.80243 0.66304 0.25100 0.1105 0.91294 0.41204 0.34801 0.0687 0.98165 0.06403 0.01746 0.0107 0.99226 0.04658 . 0.0078 1.0000EigenvectorsVariable | 1 2 3 4 5 6-------------+----------------------------------------------------------------- x1 | 0.34279 0.07105 0.88272 0.11837 0.28759 0.03902 x2 | 0.25355 0.91405 -0.20001 0.23378 -0.02013 0.07183 x3 | 0.40390 0.11256 -0.04505 -0.90612 0.00644 -0.03269 x4 | 0.44669 -0.23400 -0.40532 0.20194 0.71151 -0.18548 x5 | 0.47278 -0.26333 -0.12004 0.15439 -0.29697 0.76203 x6 | 0.48167 -0.15064 0.00855 0.21369 -0.56781 -0.61413. factor x1-x6,mine(0.01) pcf(obs=18)(principal component factors; 6 factors retained)Factor Eigenvalue Difference Proportion Cumulative------------------------------------------------------------------1 3.98290 3.15150 0.6638 0.66382 0.83141 0.16837 0.1386 0.80243 0.66304 0.25100 0.1105 0.91294 0.41204 0.34801 0.0687 0.98165 0.06403 0.01746 0.0107 0.99226 0.04658 . 0.0078 1.0000Factor LoadingsVariable | 1 2 3 4 5 6-------------+----------------------------------------------------------------- x1 | 0.68412 0.06479 0.71878 0.07598 0.07277 0.00842 x2 | 0.50602 0.83345 -0.16286 0.15006 -0.00509 0.01550 x3 | 0.80608 0.10264 -0.03668 -0.58164 0.00163 -0.00706 x4 | 0.89147 -0.21337 -0.33004 0.12963 0.18005 -0.04003 x5 | 0.94355 -0.24011 -0.09774 0.09911 -0.07515 0.16446 x6 | 0.96128 -0.13735 0.00697 0.13717 -0.14368 -0.13254Factor LoadingsVariable |Uniqueness-------------+----------x1 | 0.00000x2 | -0.00000x3 | 0.00000x4 | 0.00000x5 | 0.00000x6 | 0.00000. score z1-z3(based on unrotated factors)(3 scorings not used)Scoring CoefficientsVariable | 1 2 3-------------+--------------------------------x1 | 0.17176 0.07793 1.08407x2 | 0.12705 1.00245 -0.24563x3 | 0.20238 0.12345 -0.05533x4 | 0.22383 -0.25663 -0.49777x5 | 0.23690 -0.28880 -0.14742x6 | 0.24135 -0.16521 0.01051. quietly factor x1-x6,mine(0.01) pcf. gen f=(z1*r(lambda1)+z2*r(lambda2)+z3*r(lambda3))/6. egen totalscore=rsum(x1-x6). gsort - f. l totalscore id z1-z3 ftotalsc~e id z1 z2 z3 f1. 569 1 1.472416 -.2930345 -.103475 .92537492. 549 2 1.130913 -.1980218 .9642215 .82983243. 532 3 .8939767 .5721344 .7984022 .76094524. 506 6 .584383 1.801504 .5787218 .70150685. 497 7 .5194059 2.576505 -1.362115 .55128936. 512 5 .602061 -.9741927 .9138077 .36564827. 519 4 .7785597 -.4411606 -1.086971 .33557338. 489 8 .3009298 -.3406681 .8300895 .24428699. 481 11 .2087767 -.6547917 -.0317313 .044349910. 484 10 .2948939 -.4248423 -1.248548 -.001086411. 460 12 -.0994829 .0496813 .1959662 -.037498712. 486 9 .3067468 -1.02853 -1.620377 -.117959513. 423 14 -.6322086 -.0679534 1.400122 -.274364714. 443 13 -.3502443 -1.206041 -.0247946 -.402356815. 394 16 -.9661463 .6634074 -.9886871 -.658673816. 400 15 -1.015548 -.9129516 .2820022 -.769481317. 354 17 -1.665773 .9942052 1.5082 -.801338318. 302 18 -2.363658 -.1152501 -1.004835 -1.696048Stata命令与结果例题20-2(EX20-2.dta):. factor x1-x9,mine(0.7) pcf(obs=36)(principal component factors; 4 factors retained)Factor Eigenvalue Difference Proportion Cumulative ------------------------------------------------------------------1 2.80742 0.81629 0.3119 0.31192 1.99113 0.54281 0.2212 0.53323 1.44832 0.66325 0.1609 0.69414 0.78507 0.10437 0.0872 0.78135 0.68070 0.13944 0.0756 0.85706 0.54126 0.08823 0.0601 0.91717 0.45303 0.27852 0.0503 0.96748 0.17451 0.05596 0.0194 0.98689 0.11855 . 0.0132 1.0000Factor LoadingsVariable | 1 2 3 4 Uniqueness -------------+------------------------------------------------------ x1 | -0.25458 0.77000 0.00776 0.47017 0.12117 x2 | 0.76587 0.12768 0.09055 0.50844 0.13043 x3 | 0.24434 0.77639 -0.08574 -0.44304 0.13387 x4 | 0.68927 0.66058 -0.07059 -0.01973 0.08316 x5 | -0.72423 0.12457 0.44013 0.18939 0.23038 x6 | 0.03930 -0.07076 0.88821 -0.00886 0.20445 x7 | -0.40462 -0.16381 -0.66326 0.24270 0.31063 x8 | -0.62276 0.40190 0.04132 -0.11635 0.43540 x9 | 0.73732 -0.36590 0.05894 0.02089 0.31856. factor x1-x9,factors(4) pf(obs=36)(principal factors; 4 factors retained)Factor Eigenvalue Difference Proportion Cumulative ------------------------------------------------------------------1 2.40201 0.79050 0.4839 0.48392 1.61150 0.71022 0.3246 0.80853 0.90129 0.51338 0.1816 0.99004 0.38791 0.27032 0.0781 1.06825 0.11759 0.08361 0.0237 1.09196 0.03398 0.05967 0.0068 1.09877 -0.02569 0.13818 -0.0052 1.09358 -0.16386 0.13655 -0.0330 1.06059 -0.30041 . -0.0605 1.0000Factor LoadingsVariable | 1 2 3 4 Uniqueness -------------+------------------------------------------------------ x1 | -0.17845 0.68836 0.03313 0.33591 0.38038 x2 | 0.72998 0.02943 0.12835 0.36037 0.31992 x3 | 0.28705 0.68771 -0.06434 -0.34304 0.32284 x4 | 0.73937 0.57953 -0.03613 -0.02279 0.11565 x5 | -0.65592 0.17695 0.38109 0.08571 0.38587 x6 | 0.02066 -0.07004 0.70535 -0.08488 0.48995 x7 | -0.34171 -0.07658 -0.48097 0.11116 0.63368 x8 | -0.49809 0.36120 0.02159 -0.00544 0.62095 x9 | 0.64242 -0.39427 0.06102 0.00849 0.42805。