matlab讲义第四章
- 格式:ppt
- 大小:1.40 MB
- 文档页数:80


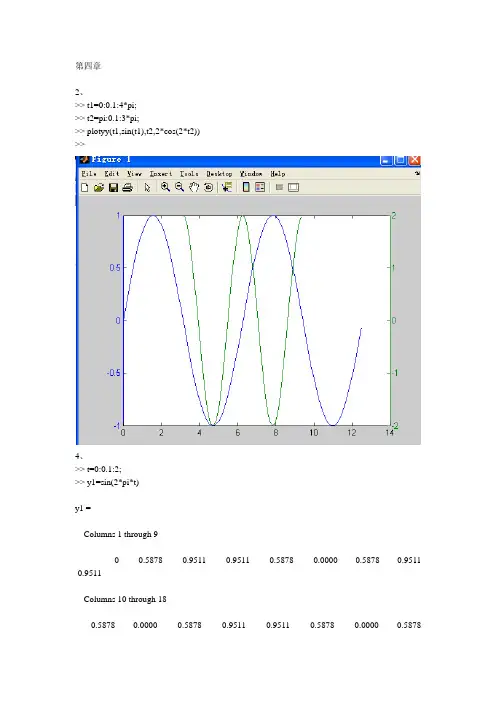
2、>> t1=0:0.1:4*pi;>> t2=pi:0.1:3*pi;>> plotyy(t1,sin(t1),t2,2*cos(2*t2))>>4、>> t=0:0.1:2;>> y1=sin(2*pi*t)y1 =Columns 1 through 90 0.5878 0.9511 0.9511 0.5878 0.0000 -0.5878 -0.9511 -0.9511Columns 10 through 18-0.5878 -0.0000 0.5878 0.9511 0.9511 0.5878 0.0000 -0.5878Columns 19 through 21-0.9511 -0.5878 -0.0000>> y2=cos(2*pi*t)y2 =Columns 1 through 91.0000 0.8090 0.3090 -0.3090 -0.8090 -1.0000 -0.8090 -0.3090 0.3090Columns 10 through 180.8090 1.0000 0.8090 0.3090 -0.3090 -0.8090 -1.0000 -0.8090 -0.3090Columns 19 through 210.3090 0.8090 1.0000>> y3=exp(-4*t)y3 =Columns 1 through 91.0000 0.6703 0.4493 0.3012 0.2019 0.1353 0.0907 0.0608 0.0408Columns 10 through 180.0273 0.0183 0.0123 0.0082 0.0055 0.0037 0.0025 0.0017 0.0011Columns 19 through 210.0007 0.0005 0.0003>> plot(t,y1,'b-')>> hold on>> plot(t,y2,'g:')>> plot(t,y1,'b-');>> plot(t,y3,'r')>> title('正弦、余弦和指数曲线')>> xlable('t(0-2)')??? Undefined command/function 'xlable'.>> xlabel('t(0-2)')>> text(1.2,y3,'指数函数')??? Error using ==> textX and Y must be the same length.>> text(1.2,exp(-4*1.2),'指数函数')>> text(0,0,'幅值')>> text(1.5,sin(2*pi*1.5),'正弦函数') >> text(0.8,cos(2*pi*0.8),'余弦函数')5、>> x=-2:0.1:2x =Columns 1 through 9-2.0000 -1.9000 -1.8000 -1.7000 -1.6000 -1.5000 -1.4000 -1.3000 -1.2000Columns 10 through 18-1.1000 -1.0000 -0.9000 -0.8000 -0.7000 -0.6000 -0.5000 -0.4000 -0.3000Columns 19 through 27-0.2000 -0.1000 0 0.1000 0.2000 0.3000 0.4000 0.5000 0.6000Columns 28 through 360.7000 0.8000 0.9000 1.0000 1.1000 1.2000 1.3000 1.40001.5000Columns 37 through 411.6000 1.7000 1.8000 1.90002.0000>> y=-2:0.1:2y =Columns 1 through 9-2.0000 -1.9000 -1.8000 -1.7000 -1.6000 -1.5000 -1.4000 -1.3000 -1.2000Columns 10 through 18-1.1000 -1.0000 -0.9000 -0.8000 -0.7000 -0.6000 -0.5000 -0.4000 -0.3000Columns 19 through 27-0.2000 -0.1000 0 0.1000 0.2000 0.3000 0.4000 0.5000 0.6000Columns 28 through 360.7000 0.8000 0.9000 1.0000 1.1000 1.2000 1.3000 1.40001.5000Columns 37 through 411.6000 1.7000 1.8000 1.90002.0000>> [X,Y]=meshgrid(x,y)>> Z=X*exp(-X^2-y^2)??? Error using ==> mpowerMatrix must be square.>> Z=X*exp(-X^2-Y^2)Z =1.0e-014 *Columns 1 through 90.9104 -0.2220 -0.4885 -0.1332 0.0888 -0.7994 -0.0888 -0.2665 0.0888Columns 10 through 180.3553 -0.2220 0.0444 -0.4885 -0.0888 0.4441 0.0444 -0.7994 -0.1332Columns 19 through 27-0.7994 0.3553 0.3553 0.3553 0.4441 -0.9326 -0.2665 -0.0888 -0.7994Columns 28 through 36-0.0444 0.0888 -0.0888 -0.3553 0.3553 0.0444 -0.7994 -0.0888 -0.2665Columns 37 through 41-0.4885 -0.9770 0.1776 -0.3553 0.7105>> plot3(X,Y,Z)>> surf(X,Y,Z)>> X(10:20,10:20)=nanX =Columns 1 through 9-2.0000 -1.9000 -1.8000 -1.7000 -1.6000 -1.5000 -1.4000 -1.3000 -1.2000Columns 10 through 18-1.1000 -1.0000 -0.9000 -0.8000 -0.7000 -0.6000 -0.5000 -0.4000 -0.3000NaN NaN NaN NaN NaN NaN NaN NaN NaNNaN NaN NaN NaN NaN NaN NaN NaN NaNNaN NaN NaN NaN NaN NaN NaN NaN NaNNaN NaN NaN NaN NaN NaN NaN NaN NaN-1.1000 -1.0000 -0.9000 -0.8000 -0.7000 -0.6000 -0.5000 -0.4000 -0.3000Columns 19 through 27-0.2000 -0.1000 0 0.1000 0.2000 0.3000 0.4000 0.5000 0.6000Columns 28 through 360.7000 0.8000 0.9000 1.0000 1.1000 1.2000 1.3000 1.40001.5000Columns 37 through 411.6000 1.7000 1.8000 1.90002.0000>> surf(X,Y,Z)10、>> y=[60 90 110 120 100 95]y =60 90 110 120 100 95 >> x=1:6x =1 2 3 4 5 6 >> bar(x,y)> pie(y,explode,{'一月','二月','三月','四月','五月','六月'}) ??? Undefined function or variable 'explode'.>> explode=[0 0 0 0 0 1]explode =0 0 0 0 0 1>> pie(y,explode,{'一月','二月','三月','四月','五月','六月'})>> y2=[50 80 90 100 100 90]y2 =50 80 90 100 100 90 >> y5=[y;y2]y5 =60 90 110 120 100 9550 80 90 100 100 90 >> bar3(y5)13、。