(刘昌全)资源应用计划表
- 格式:doc
- 大小:45.00 KB
- 文档页数:1

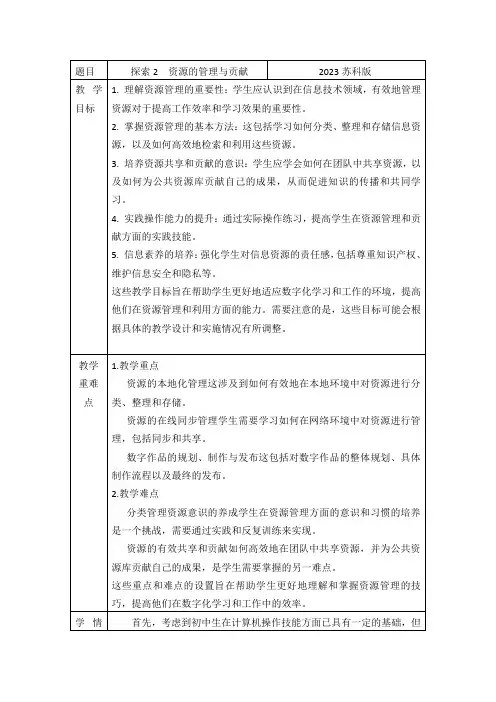
定义解释:首先,教师明确资源管理的定义,即合理地组织、存储、检索、维护和利用计算机系统中的各种资源,包括文件、文件夹、应用程序等。
重要性阐述:通过案例分析,让学生理解资源管理对于提高学习效率、保护信息安全、促进资源共享等方面的重要性。
2. 文件夹与文件的管理
文件夹的创建与命名:教师演示如何在计算机中创建文件夹,并强调文件夹命名的规范性和易读性。
可以引导学生思考如何为不同的文件夹命名,以便快速找到所需文件。
文件的分类与存储:讲解文件分类的原则和方法,如按学科、项目、日期等分类。
演示如何将文件移动到相应的文件夹中,并介绍文件的复制、粘贴、删除等基本操作。
目录树的构建:通过图表或动画展示目录树的结构,让学生理解文件夹之间的层级关系。
鼓励学生动手实践,构建自己的目录树。
3. 资源的贡献与分享
分享的意义:阐述资源共享对于促进学习交流、提高工作效率等方面的意义。
网盘的使用:介绍网盘的基本功能和特点,如在线存储、同步更新、分享链接等。
演示如何使用网盘上传文件、设置分享权限以及生成分享链接。
注意事项:强调在分享资源时需要注意的版权问题、隐私保护以及信息安全等问题。
4. 实用技巧与工具
快捷键操作:介绍一些常用的文件管理快捷键,如Ctrl+C(复制)、Ctrl+V(粘贴)、Ctrl+X(剪切)等,提高操作效率。
文件搜索:演示如何使用计算机的搜索功能快速找到所需文件。
专业软件推荐:根据学生需求推荐一些专业的文件管理软件或工具,如Evernote、OneNote等。
三、课堂实践
1. 分组实践
将学生分成若干小组,每组分配一个主题或项目任务,如“整理班。
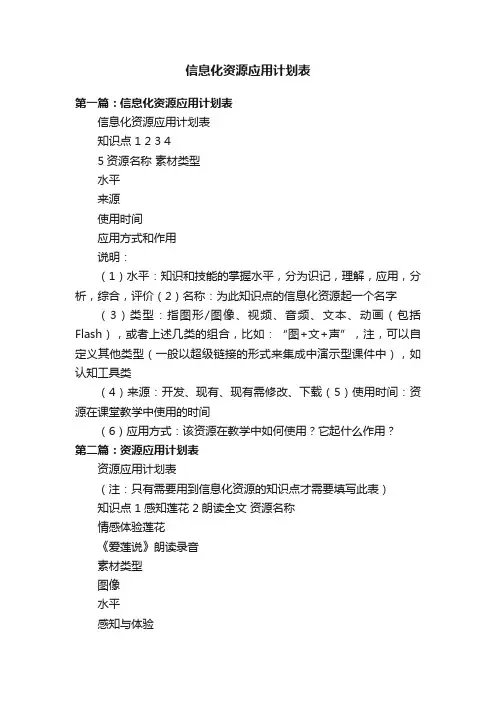
信息化资源应用计划表第一篇:信息化资源应用计划表信息化资源应用计划表知识点 1 2 3 45资源名称素材类型水平来源使用时间应用方式和作用说明:(1)水平:知识和技能的掌握水平,分为识记,理解,应用,分析,综合,评价(2)名称:为此知识点的信息化资源起一个名字(3)类型:指图形/图像、视频、音频、文本、动画(包括Flash),或者上述几类的组合,比如:“图+文+声”,注,可以自定义其他类型(一般以超级链接的形式来集成中演示型课件中),如认知工具类(4)来源:开发、现有、现有需修改、下载(5)使用时间:资源在课堂教学中使用的时间(6)应用方式:该资源在教学中如何使用?它起什么作用?第二篇:资源应用计划表资源应用计划表(注:只有需要用到信息化资源的知识点才需要填写此表)知识点 1感知莲花 2朗读全文资源名称情感体验莲花《爱莲说》朗读录音素材类型图像水平感知与体验来源下载使用时间2分钟应用方式和作用情景导入,激发动机录音识记下载 3分钟配乐朗读,陶冶性情3文言词语积累重点语句注释图像文本识记开发 3分钟教师讲解,学生巩固4体会莲的品质莲的君子品格动画文本理解分析开发 5分钟教师讲解,学生巩固资源内容描述说明(请详细说明此知识点信息化资源的主要内容,此表需要与教学设计紧密挂钩,同时在收集、下载、处理和开发素材的过程中不断修改与完善):(样式:资源名称,主要内容)1、情感体验莲花,6幅莲花图,保存在素材文件下,文件名为“情感体验莲花.bmp”2、《爱莲说》朗读录音,音频格式,长度1分50秒。
保存在素材文件下,文件名为“《爱莲说》朗读录音.wav”3、重点语句注释,文本,保存在素材文件下,文件名为“重点语句注释.doc”4、莲的君子品格,动画,主要内容是课文理解。
保存在素材文件下,文件名为“莲的君子品格.doc”说明:(1)水平:知识和技能的掌握水平,分为识记,理解,应用,分析,综合,评价(2)名称:为此知识点的信息化资源起一个名字(3)类型:指图形/图像、视频、音频、文本、动画(包括Flash),或者上述几类的组合,比如:“图+文+声”,注,可以自定义其他类型(一般以超级链接的形式来集成中演示型课件中),如认知工具类(4)来源:开发、现有、现有需修改、下载(5)使用时间:资源在课堂教学中使用的时间(6)应用方式:该资源在教学中如何使用?它起什么作用?第三篇:资源应用计划表资源应用计划表(注:只有需要用到信息化资源的知识点才需要填写此表)知识点感知教学内容感知教学内容理解含义深刻的语句理解含义深刻的语句拓展阅读资源名称 1作者生平简介素材类型音象文本水平识记来源下载使用时间应用方式和作用播放—默读创设情景激发兴趣2课文朗读音象文本理解下载 8 播放—感受欣赏陶冶整体感知3导读问题及词句品析答案 4课文分析展示五次擦火柴文本文本分析自制 5 出示—讲析设难质疑引起思辨综合下载 5 出示—讨论—总结突破化解教学难点5拓展资料文本6习题训练文本应用现有需修改出示—讨论—感悟培养情感提高认知小练笔评价现有需修改出示—总结知识巩固课外延伸资源内容描述说明(请详细说明此知识点信息化资源的主要内容,此表需要与教学设计紧密挂钩,同时在收集、下载、处理和开发素材的过程中不断修改与完善):(样式:资源名称,主要内容)说明:(1)水平:知识和技能的掌握水平,分为识记,理解,应用,分析,综合,评价(2)名称:为此知识点的信息化资源起一个名字(3)类型:指图形/图像、视频、音频、文本、动画(包括Flash),或者上述几类的组合,比如:“图+文+声”,注,可以自定义其他类型(一般以超级链接的形式来集成中演示型课件中),如认知工具类(4)来源:开发、现有、现有需修改、下载(5)使用时间:资源在课堂教学中使用的时间(6)应用方式:该资源在教学中如何使用?它起什么作用?第四篇:资源应用计划表演示型课件资源应用计划表(注:凡是需要用到信息化资源的知识点才需要填写此表)知识点牛顿第一定律2力是改变物体运动状态的原因资源名称认识牛顿素材类型视频+图片+文本水平感知与体验识记来源下载使用时间 3分钟应用方式和作用情境导入,激发动机时动时静的滚摆视频+文本下载3分钟自主阅读,开阔视野资源内容描述说明(请详细说明此知识点信息化资源的主要内容,此表需要与教学设计紧密挂钩,同时在收集、下载、处理和开发素材的过程中不断修改与完善):(样式:资源名称,主要内容)1.2.认识牛顿,一段MP3视频,长度约5分钟,流量不超过256KB/s,主要内容是认识牛顿的生平大事及主要贡献,保存在素材文件下,文件名为“认识牛顿.mp3” 时动时静的滚摆,图片:滚摆,大小600*960,jpg格式,文件名为“时动时静的滚摆”;文本:滚摆是生活中常见的一种工具……,保持到素材文件下。

Water Resources Management16:145–169,2002.145©2002Kluwer Academic Publishers.Printed in the Netherlands.Optimal Crop Planning and Conjunctive Use of Water Resources in a Coastal River BasinLAXMI NARAYAN SETHI1,D.NAGESH KUMAR2∗,SUDHINDRA NATH PANDA1and BIMAL CHANDRA MAL11Agricultural and Food Engineering Department,Indian Institute of Technology,Kharagpur-721302,India2Civil Engineering Department,Indian Institute of Science,Bangalore560012,India(∗author for correspondence)(Received:25June2001;accepted:2March2002)Abstract.Due to increasing trend of intensive rice cultivation in a coastal river basin,crop planning and groundwater management are imperative for the sustainable agriculture.For effective manage-ment,two models have been developed viz.groundwater balance model and optimum cropping and groundwater management model to determine optimum cropping pattern and groundwater allocation from private and government tubewells according to different soil types(saline and non-saline),type of agriculture(rainfed and irrigated)and seasons(monsoon and winter).A groundwater balance model has been developed considering mass balance approach.The components of the groundwater balance considered are recharge from rainfall,irrigated rice and non-ricefields,baseflow from rivers and seepageflow from surface drains.In the second phase,a linear programming optimization model is developed for optimal cropping and groundwater management for maximizing the economic re-turns.The models developed were applied to a portion of coastal river basin in Orissa State,India and optimal cropping pattern for various scenarios of riverflow and groundwater availability was obtained.Key words:groundwater balance,linear programming,optimum cropping,salinity and permissible mining allowance,water resources management1.IntroductionIn view of the ever-increasing human population,intensive rice cultivation and non-availability of canal water in the coastal humid regions of eastern India,the groundwater resources are under high pressure of deterioration in quantity and quality.The deterioration of the groundwater quality is the result of intrusion of seawater into the aquifers due to lowering of fresh groundwater level caused by ex-cessive groundwater abstraction.Due to increasing water scarcity,greater attention is being given to water management in irrigated as well as in rainfed agriculture.A farmer at the start of each irrigation season needs to have optimum cropping pattern and irrigation programs,which will maximize the economic return.Under these circumstances there is an urgent need to introduce efficient techniques in land146LAXMI NARAYAN SETHI ET AL. and water resources management for optimal utilization of the available land and water resources.A number of simulation and optimization models have been applied in the past to decide planning and operating strategies for irrigation reservoir systems(Kumar and Pathak1989;Vedula and Mujumdar,1992).Rao et al.,(1990)developed a model for optimal weekly irrigation scheduling policy for two crops by considering both seasonal as well as intra seasonal competition for water.Vedula and Nagesh Kumar(1996)developed a mathematical programming model to determine the steady state optimal operating policy and the associated optimal crop-water al-locations to all the crops for a single purpose irrigation reservoir,combining linear programming in the intraseasonal period and stochastic dynamic programming in inter seasonal period.Most farming situations are concerned with several crops grown in the same season.Both allocations of land and water resources under a multi-crop situation in a season should be considered(Paul et al.,2000).Paul et al.,(2000)developed optimal resources allocation strategies for a canal command in the semiarid region of India in a stochastic regime,considering the competition of crops in a season, both for irrigation water and area of cultivation.The development of optimization models for improved water management ex-panded rapidly in the last decade.Linear programming is used for multiple crop models and dynamic programming for a single crop model.In irrigated agricul-ture,where various crops are competing for a limited quantity of land and water resources,linear programming is one of the best tools for optimal allocation of land and water resources(Smith,1973;Maji and Heady,1980;Loucks et al.,1981; Yaron and Dinar,1982:Pleban,et al.,1983;Tyagi and Dhruva Narayana,1984; Chavez-Morales,et al.,1987;Loftis and Houghtalen1987;Sritharan,et al.,1988; Afshar and Marino,1989;Mayya and Prasad,1989;Paudyal and Gupta,1990; Kaushal,et al.,1985;Panda et al.,1996;Sethi,2001).In recent years considerable attention has been given to problems associated with groundwater management and salinity control.Groundwater management has been studied from different view points,e.g.,the economic control of groundwater management under institutional restrictions(Burt,1970),the conjunctive manage-ment of groundwater and surface water(Cummings and Winkle,1974,Khepar and Chaturvedi,1982,Panda et al.,1985)and groundwater management and salinity control(Cummings and Winkle,1974,Hallaji and Yazicigil,1996).Water resources management is generally done by water balance for crop plan-ning.In the present study the optimal cropping pattern and area allocation with respect to availability of water resources(both surface and groundwater)were obtained for different seasons by developing an optimization model.Water balance model has also been developed using the methods of Satish Chandra and Saxena (1975)and Panda et al.(1996)considering mass balance approach.In addition to the rational water use,there is need for selecting economically viable cropping pattern for a given area with available resources.Such cropping pattern can beOPTIMAL CROP PLANNING AND CONJUNCTIVE USE OF WATER RESOURCES147 obtained through the use of optimization models.The optimal cropping pattern was obtained for different soil types(saline and non-saline),type of agriculture(rainfed and irrigated)and seasons(monsoon and winter)using Linear Programming(LP) model.The objective of the LP model is tofind the maximum annual net return from different cropping patterns and areas for all types of agriculture(rainfed and irrigated)under different soil types.This optimization is subject to various constraints such as surface and groundwater availability and their mass balance, cropping pattern restrictions.These models were applied to a portion of coastal river basin in Orissa State,India.The study was undertaken with a view to assist in taking decisions about crop planning and groundwater management.2.Study AreaThe study area,a portion of coastal river basin in India,is situated within the north latitude of21◦27 0 to21◦45 45 and east longitude of86◦56 15 to87◦20 30 spanning over an area of1066square kilometers,out of which833.15square kilometers is cultivable land(Figure1).The area is situated in three administrative blocks,namely,Balasore Sadar,Basta and Baliapal of Balasore district in Orissa State,India.The study area is bounded on the north and the south by two rivers(Subarn-arekha and Budhabalang),on the east by Bay of Bengal and on the west by hilly areas of Mayurbhanj district of Orissa State.The area can be categorized into three distinct morphological units viz.saline marshy tract along the coast,the gently slopping alluvial plain in the central part and the hilly region in the western parts. The saline marshy tract forms a long and narrow strip along the coast.The width of this tract varies from3to5km and is intersected by a good number of tidal streams and is covered by shrubby vegetation.The gently sloping alluvial plain is situated to the west of the saline marshy tract and is the most fertile part of the area.The general slope of this tract is towards east and southeast and varies from0.57to1.33 m per km.The hilly region in the western part is an extension of the Eastern Ghats mountain range.These hill ranges are trending roughly in the northeast-southwest direction.The maximum elevation in this region is40m above mean sea level. The climate of the area is characterized by tropical monsoon climate having three distinct seasons viz.monsoon,winter and summer.The average annual rainfall of the region varies between1500–2000mm,two third of which occurs in monsoon season between mid-June and mid-September.During this period,a large volume of rainwater from the ricefields discharges into the sea through surface drains and rivers.In this process,a huge quantity of fertile soil nutrients and applied fertilizers are drained into the sea.A study of the existing cultivation practices reveals that the farmers usually grow crops in two seasons(monsoon and winter) in both rainfed and irrigated areas.Farmers normally grow rice as a principal crop.Apart from rice,pulses,oilseeds and vegetables are the other crops grown during monsoon and winter seasons.In summer season there is no cultivation in148LAXMI NARAYAN SETHI ET AL.Figure1.Location map of study area.the area.In the various seasons the cropping area does not remain the same.This is due to the uncertainty of rainfall,scanty water resources,uncontrolled grazing of animals,management problems due to considerable distance from the farmers’houses,theft possibilities of high valued crops and other socio-economic problems. The only sources of water available for irrigation are the groundwater and the river water from Subarnarekha and Budhabalang.In the study area,no canal irrigation system is available.The structures used for irrigation are the government owned deep tubewells(more than60m)and private shallow(less than20m)and mini-deep tubewells(between20and60m)and river lifts.Cost of groundwater from government owned deep tubewells(here afterwards referred as government tube-OPTIMAL CROP PLANNING AND CONJUNCTIVE USE OF WATER RESOURCES149 wells)is subsidized by the state government.Therefore,groundwater abstraction is intensive in the rice-cultivated areas.If the present increasing trend of groundwater abstraction continues,it may further lead to decline in groundwater table,seawater intrusion,and non-functioning of shallow tubewells operated by centrifugal pumps. So,a farmer at the start of each irrigation season needs to have optimum cropping pattern and irrigation program to maximize his economic returns.3.Model DevelopmentTwo models,viz.groundwater balance model and optimum cropping and ground-water management model are developed to determine the optimum cropping pat-tern and groundwater allocation corresponding to different soil type(saline and non-saline),type of agriculture(rainfed and irrigated)and seasons(monsoon and winter).3.1.GROUNDWATER BALANCE MODELGroundwater balance is an important aspect of any study on allocation of water resources,planning and management.The objective of the groundwater balance model is to regulate the groundwaterflow system so as to prevent the water table from rising too close and/or declining too far from the root zone of the crops.This amounts to increasing or reducing the groundwater discharge at different locations as per requirement.The simplest form of groundwater balance equation is given by:S=TGR r–TGD d(1) in which S=change of groundwater storage,m3;TGR r=total groundwater recharge,m3;and TGD d=total groundwater draft,m3.3.1.1.Groundwater RechargeGroundwater recharge consists of recharge from rainfall,seepageflow from surface drains,baseflow from rivers,deep percolation from irrigated rice and non-rice areas.However,seepage fromfield drainage channels and conveyance system has been neglected.The annual groundwater recharge(starting of monsoon season to end of winter season)has been estimated by using the following equation: TGR r=R r+GR p+GR np+BF+SF(2)in which R r=recharge to the groundwater from rainfall,m3;GR p=recharge to the groundwater from irrigated rice area,m3;GR np=recharge to the groundwater from irrigated non-rice area,m3;SF=seepageflow to the study area from drains, m3;and BF=baseflow to the area from the rivers,m3.150LAXMI NARAYAN SETHI ET AL. Recharge from RainfallTo compute the recharge from rainfall,ten years monthly rainfall data of the study area was collected from the Central Water Commission office,Balasore,Orissa. Annual groundwater recharge(cm)from rainfall in cm was calculated using the following equation given by Satish Chandra and Saxena(1975).R r=3.984(R av–40.64)0.5(3) in which R av=average annual rainfall of the area,cm.Recharge from Irrigated FieldsRecharge from irrigatedfields including losses infield channels was estimated us-ing the norms recommended by the Groundwater Estimation Committee(1984)as follows.The different percentages of seepage and percolation in cropfields adopted are based on the studies conducted in similar areasa)Recharge from irrigated rice area(GR p):35to64%of tubewell dischargeb)Recharge from irrigated non-rice area(GR np):30to36%of tubewell dis-chargeIn the present study recharge from tubewells and from river lift irrigatedfields (including losses infield channels)for rice and non-ricefields are taken as55and 30%,respectively.Base Flow from RiversIn the present study,the major groundwater recharge contribution is the baseflow from Subarnarekha and Budhabalang rivers.Until recently,the common methods used for estimation of baseflow are direct-measurement method,the curve tangent method,the basin area method and the chemical and isotope method(Delleur, 1998).In the present study,direct-measurement methodology has been used for estimation of the baseflow from rivers,where an accurate estimate of hydraulic conductivity of the soils of the riverbeds was obtained using Falling Head Per-meameter method in the laboratory.The Darcy’s law was used to estimate the base flow from rivers considering the annual average groundwaterflow gradient on both sides of the rivers and the cross-sectional area through whichflow takes place. Seepage Flow from DrainsSeepage from drains depends on factors like seepage rate,wetted perimeter,length of drains contributing to seepage and the number of days water remains in the drains.Due to unavailability of data related to estimation of the seepage from drains,it was computed considering run off available in drains as40%of the total rainfall(Sarma et al.,1983).Seepageflow from drains to groundwater was assumed as8%of the total run off available in drains(Satish Chandra and Saxena, 1975).OPTIMAL CROP PLANNING AND CONJUNCTIVE USE OF WATER RESOURCES151 Table I.Existing seasonal water resources systems and the extraction from the water resourcesName of Structures Number Average Operating Total draft(Mm3) sources discharge hours(m3s−1)(h day−1)Mon-Win-Mon-Win-Monsoon Wintersoon ter soon terSurface River lift15370.020912 1.12 3.84 waterGovernment200(4)507(4)0.040121442.30130.95tubewellGround-Private shallow962400.0061012 2.997.47 water tubewellPrivate107(45)335(45)0.025121219.7051.62mini-deeptubewellSource:Lift Irrigation Corporation,Balasore,Orissa,India.Note:Figures in the parenthesis indicate number of structures in saline area.3.1.2.Groundwater DischargeGroundwater discharge consists of draft from tubewells and evaporation from ground-water,which is given by:TGD d=GD t+GD e(4) in which GD t=groundwater draft from tubewells,m3;GD e=evaporation from groundwater,m3.Groundwater DraftPrivate shallow and mini-deep tubewells and government deep tubewells in the study area are being used for pumping the groundwater.The number of tubewells varies in different years.The year-wise groundwater draft is based on discharge, number of wells and duration of operation of wells in each season(Table I). Evapotranspiration from GroundwaterEvapotranspiration from groundwater is difficult to be evaluated.In the study area the average groundwater level varies from3to9m below surface.The evapotran-spiration from groundwater is assumed negligible due to high depth of water table from the surface and absence of deep-rooted forest plants.152LAXMI NARAYAN SETHI ET AL.3.2.OPTIMAL CROPPING AND GROUNDWATER MANAGEMENT MODELThe objective of the model is to maximize the net annual return from the study area considering the returns from crop but excluding the irrigation cost.The de-cision variables of the models are seasonal area allocation to crops and surface water and groundwater application for crop production.The rainfall and irrigation requirement of crops,which are inputs to the model,are considered as stochastic variables.3.2.1.Objective FunctionThe objective function consists of maximizing the net annual return(Z)from the coastal river basin subject to constraints on the availability of water and other inputs.MaxZ=2i=12j=12k=1nc=1a ijkc A ijkc−2i=12j=12k=1C RWijkRW ijk+(1+L r)C GW PijkGW P ijk+C GW GijkGW G ijk(5)in which i=soil type,i=1for coastal saline soil and i=2for inland non-saline soil;f=type of agriculture,j=1for rainfed agriculture and j=2for irrigated agriculture;k=crop growing season,k=1for monsoon season,and=k=2for the winter season;c=1,2...,n;n=number of crops;a ijkc=net return(excluding the cost of irrigation water)for crop c grown in season k of j th type of agriculture in soil type i(Rs ha−1)(US$1≈Indian Rupees,Rs.48);A ijkc=area allocated to crop c grown in season of k of j th type of agriculture in soil type i(ha);C RWijk=cost of lifting river water(RW)in season k for j th type of agriculture in soil type i(Rs ha-m−1);RW ijk=river water allocated in season k for j th type of agriculture in soiltype i(ha-m);C GW Pijk=cost of groundwater from private tube well(P)in season k for j th type of agriculture and in soil type i(Rs ha-m−1);GW P ijk=groundwater pumped from private tube wells in season k for j th type of agriculture in soil typei(ha-m);C GW Gijk=cost of groundwater from government tube well(G)in season k for j th type of agriculture and in soil type i(Rs ha-m−1);GW G ijk=groundwater pumped from government tube well in season k for j th type of agriculture in soil type i(ha-m);and L r=leaching requirement(fraction).3.2.2.ConstraintsMaximization of the objective function is subject to the following constraints. 1.Water Allocation ConstraintThe expected irrigation requirements of all the crops must be fully satisfied during all the seasons from the available surface and groundwater resources and rainfallOPTIMAL CROP PLANNING AND CONJUNCTIVE USE OF WATER RESOURCES153 for both rainfed and irrigated agriculture of the coastal saline and non saline soil areas.2 i=12j=1nc=1NIR ijkc A ijkc−2i=12j=1α1(β1RW ijk++GW P ijk+GW G ijk)≤0for all k;(6)in which NIR ijkc=net irrigation requirement of crop c,grown in season k for j th type of agriculture in soil type i(m);α1=(1-θ2)=field water application efficiency(fraction);θ2=field water application loss(fraction);β1=(1-θ1)= conveyance efficiency of river lift system(fraction);andθ1=conveyance loss of river lift system(fraction);nd Area ConstraintLand allocated to various crops during the monsoon and winter seasons must not exceed the available cultivable area for all types of agriculture and the soil types.2 i=12j=1nc=1A ijkc≤TA k for all k(7)in which TA k=total land area available in season k(ha);3.Water Availability ConstraintsThe availability of water for irrigation from the surface water source is limited.So allocation of surface water must not exceed the available surface water during a season.Similarly for groundwater resources,tube well water allocation must not exceed the availability of groundwater during the season for the corresponding type of agriculture and also the type of soil.(a)River Water2 i=12j=1RW ijk≤ARW k for all k(8)(b)Groundwater2 i=12j=1(1+L r)(GW P ijk+GW G ijk)≤AGW k for all k(9)in which ARW k=total available river water in season k after allowing for losses (ha-m);and AGW k=total available groundwater in season k after allowing for losses(ha-m).154LAXMI NARAYAN SETHI ET AL.Figure2.Flow chart of groundwater balance for the study area.4.Hydrologic Balance of aquiferThe proper hydrologic balance of groundwater aquifer will help in keeping the water table at balanced position.Thus a hydrologic balance constraint should be satisfied(Figure2).Neglecting run-off,seepage fromfield drainage channels and evaporation losses and rainfall contribution to the water delivery systems during conveyance,the following expression is obtained.2 i=12j=12k=1GW P ijk+GW G ijk)−θ1RW ijk+θ3E(R)A ijk+θ2(β1RW ijk+GW P ijk+GW G ijk−BF−SF≤PMA(10)By rearranging2 i=12j=12k=1(1−θ2)(GW Pijk+GW G ijk)−(θ1+θ2β1)RW ijk≤PMA+BF+SF+θ3E(R)A ijk(11)in whichθ3=rainfall recharge(fraction);E(R)=expected annual rainfall(m);SF =seepage loss to the study area from the drain(ha-m);BF=seepage loss to the study area from the river(ha-m);PMA=permissible annual mining allowance of the aquifer(ha-m);and A=cultivable area under considerations(ha). Permissible annual mining allowance is determined as follows:PMA= h×A×Y(12) in which h=permissible annual average groundwater tablefluctuations(m);and Y=specific yield of aquifer(fraction).5.Minimum/Maximum Allowable AreaManagement considerations restrict some minimum and/or maximum value for irrigated areas under certain crops to meet the local food requirement.a)For Maximum areaA ijkc≤µmax ijkc T A ijkc(13-a) b)For Minimum areaA ijkc≥µmin ijkc T A ijkc(13-b)=factor by which existing area of crop c can be increased in season in whichµmaxijkc=factor by which existing area of k for j th type of agriculture and soil type i;µminijkccrop c can be decreased in season k for j th type of agriculture and soil type i and TA ijkc=area of crop c as per existing pattern in season k for j th type of agriculture and soil type i(ha).6.Non-negativityA ijkc≥0;RW ijk≥0;GW P ijk≥0;and GW G ijk≥0for all i,j,k,and c(14a-d)4.Estimation of Model InputsThe model inputs include determination of the water resources data,leaching frac-tion,net irrigation requirement of crops at different probability of exceedances,net return of crops and permissible mining allowance.4.1.WATER RESOURCESIn the study area,the sources of water available for irrigation purpose are river water and groundwater.Although the river water is of good quality,it falls short of the irrigation requirement of the area adjoining the river due to very few river lift-pumping units installed by government.The average electrical conductivity of thegroundwater is3.75dS m−1(deci Siemen/meter)in the saline area.The structures used for irrigation are the river lifts and government owned tubewells and private (shallow and mini deep)tubewells.The river water is supplied through37river lift irrigation schemes in the study area,which are programmed for different seasons (monsoon and winter)and soil type(saline and non-saline)according to demand. Details of river lift and groundwater pumping sources are given in Table I.4.2.LEACHING REQUIREMENTThe upper aquifer of coastal saline area is of poor quality not suitable for irrigation whereas deeper aquifer is suitable for all purposes due to which all the mini-deep and deep tubewells are installed in the said layer.The leaching requirement(L r) can be calculated based upon the electrical conductivity of irrigation water in salt affected areas(EC iw)and threshold value of the electrical conductivity of irrigation water(EC th)for crop tolerance as follows:Lr=EC iwEC th(15)in which EC iw=electrical conductivity of irrigation water(dS m−1);and EC th= threshold electrical conductivity of water draining from the root zone(dS m−1). 4.3.IRRIGATION REQUIREMENT OF CROPSCrops grown in study area during monsoon season are rice(Oryza sativa),maize (Zea mays),sweet potato(Ipomoea batatas)and pigeon pea(Cajanus cajan)whereas winter season crops are rice,wheat(Triticum aestivum),groundnut(Arachis hy-pogaea),mustard(Brassica juncea),black gram(Phaseolus mungo),green gram (Phaseolus aureus),onion(Allium cepa),and garlic(Allium sativum).Various methods are available to estimate the reference crop evapotranspiration (ET o)(Doorenbos and Pruitt,1977;Allen et al.,1998).Based on the availability of meteorological data of the study area,the Hargreaves and Samani(1985)method of estimating ET o was selected as given below:ET o=0.0135R sl(T mean+17.8)(16) in which ET o=reference evapotranspiration in a given period(month)(mm/month); R sl=incoming short-wave solar radiation in the considered period(mm/month); T mean=mean temperature(T max+T min)/2;T max=monthly maximum air temper-ature(◦C);T min=monthly minimum air temperature(◦C).R sl=0.16R a(T max−T min)0.5(17) in which R a=extra terrestrial solar radiation(mm/month).Now,the crop evapotranspiration(ET c)is calculated using the following equa-tion,ET c=k c ET o(18) where,k c=crop coefficient.The crop coefficient(k c)values for each crop were obtained from literature (Doorenbos and Pruitt,1977and Allen et al.,1998).The U.S.Department of Agriculture(USDA)Soil Conservation Service(SCS)method(Dastane,1977)was used to determine the effective rainfall.The total depth of net irrigation requirement of crop that needs to be applied to meet the crop demand can be estimated from the following equation:NIR=ET c−E R(19) in which NIR=net irrigation requirement in a given month,mm/month;and E R= effective rainfall in the given month,mm/month;The seasonal net irrigation requirement(NIR)of crops has been computed by adding the monthly NIR of crops corresponding to the months in the growing season.4.4.PROBABILITY OF EXCEEDANCE(PE)The daily rainfall and temperature of the study area for10yr(1991–2000)was collected and converted to monthly values.These values were used to predict the expected monthly rainfall and evapotranspiration at different probability levels. The values were entered in the database of SMADA package(Statistical Model for Analysis of Distribution function)considering Weibull’s distribution as ref-erence andfitted to different probability functions.From the best-fit distribution (in this case,normal distribution),the value of the monthly-expected reference evapotranspiration at10,20,30,40,50,60,70,80,and90%probability levels could be obtained.Based on these values,the net irrigation requirements(NIR)of crops at various probability levels of exceedance(PE)were computed for both the growing seasons,and are shown in Figures3and4for monsoon season and winter season respectively.The optimal annual returns at different probability levels of NIR and the optimal groundwater allocation are computed by assuming that all the components of the groundwater balance taken in the calculations are correct. RETURNS OF CROPSThe net return from the cultivation of selected crops per unit area of farming was calculated by considering the potential yield from the crops.The variation of net return excluding irrigation water cost depends upon the type of soil,agriculture and the crops with their corresponding yield,market price and the cost of cultivation.Figure 3.Variation of net irrigation requirement of crops with different probability of exceedance level during monsoon season.The potential yield values of the study area were collected from the Agriculture De-partment,Government of Orissa.The cost of production of various crops excluding the cost of irrigation water was obtained from the budget for monsoon and winter crops suggested by the Department of Statistics and Economics,Orissa,India.The net returns excluding the irrigation water cost for crop c,season k,agriculture type j and soil type i were determined based on these inputs(Table II).4.6.PERMISSIBLE MINING ALLOWANCEPermissible mining allowance(safe yield)is the upper limit of groundwater pump-ing without creating adverse effect on groundwater management.Adverse effect may be either declining or rising of groundwater table or intrusion of poor quality water either from sea(salt water intrusion)or from adjoining aquifer due to creation of adverseflow gradients.The groundwater should be managed so that the aver-age depletion does not exceed the permissible mining allowance.The permissible mining allowance(PMA)is calculated using Equation12.。
(完整版)资源分配计划及资源计划表1. 引言本文档旨在描述资源分配计划及资源计划表,以确保项目的顺利进行。
资源分配计划是指在项目执行过程中,合理分配和利用各种资源的计划。
资源计划表则是对这些资源进行详细规划和记录的表格。
2. 资源分配计划资源分配计划包括以下几个方面的内容:2.1 人力资源分配根据项目需求和工作任务的复杂程度,确定所需的人力资源数量和技能要求。
将合适的人员分配到相应的岗位,并确保他们具备所需的培训和技术支持。
人力资源分配应兼顾项目进度、工作质量和成本效益。
2.2 资金资源分配根据项目的预算和经费安排,合理分配和利用资金资源。
确保项目开支与实际情况相符合,并及时进行预算调整和财务监控。
资金资源分配应遵守相关法规和内部控制要求,确保资金使用的合规性和透明度。
2.3 物资资源分配根据项目需求,确定所需的物资资源种类、数量和质量标准。
与供应商建立合作关系,确保物资的及时供应和质量保证。
物资资源分配应充分考虑项目需求的稳定性、灵活性和成本效益。
2.4 技术资源分配根据项目的技术需求和要求,确定所需的技术资源类型和规模。
确保项目团队拥有必要的技术设备、软件工具和专业知识。
技术资源分配应关注项目的技术支持和协同工作能力,以提高项目的执行效率和成果质量。
3. 资源计划表资源计划表是对资源分配计划的详细记录和规划。
表格的列项包括资源类型、数量、负责人、分配日期、预算和实际支出等内容。
通过资源计划表,可以清晰了解资源的状况和使用情况,及时进行资源的调整和优化。
以下是一个资源计划表的示例:4. 结论资源分配计划及资源计划表是确保项目顺利进行的重要工具和依据。
通过合理的资源分配和详细的资源记录,可以更好地管理和控制项目的进展和成果。
在项目执行过程中,应不断优化和调整资源的分配,以适应实际情况和需求变化。
最终成果应用的目标、范围及应用计划案例背景:某公司是一家大型制造企业,其产品覆盖了多个行业。
由于市场竞争激烈,公司决定引进一套先进的生产管理系统,以提升生产效率、降低成本、提高产品质量。
目标:公司希望通过引进生产管理系统,实现以下目标:1. 提高生产效率:通过自动化和智能化的生产过程管理,减少生产线上的人为错误,提高生产效率。
2. 降低成本:通过优化生产计划、减少废品和损耗,降低生产成本。
3. 提高产品质量:通过监控生产过程中的关键指标,及时发现并纠正生产异常,提高产品质量。
4. 实现生产数据的实时监控和分析:通过生产管理系统,实现生产数据的实时监控和分析,为管理者提供决策支持。
范围:生产管理系统的范围包括以下几个方面:1. 生产计划管理:包括订单管理、排产计划制定、资源调度等。
2. 物料管理:包括物料采购、库存管理、供应链管理等。
3. 生产过程控制:包括设备控制、工艺参数控制、生产数据采集等。
4. 质量管理:包括质量检测、质量控制、不良品处理等。
5. 数据分析与报表:包括生产数据的实时监控、生产报表的生成与分析等。
应用计划:为了顺利引进生产管理系统并实现上述目标,公司制定了以下应用计划:1. 项目启动与需求分析:明确项目目标、范围和需求,与供应商沟通合作,并制定详细的实施计划。
2. 系统设计与开发:根据需求分析,进行系统设计与开发,包括数据库设计、界面设计、功能开发等。
3. 测试与试运行:在开发完成后,对系统进行全面测试,包括功能测试、性能测试、稳定性测试等,并组织试运行,验证系统的可行性和稳定性。
4. 系统部署与培训:根据试运行结果,对系统进行优化和部署,同时对相关人员进行培训,确保他们熟悉系统的操作和功能。
5. 正式运行与监控:系统正式上线后,进行日常运维与监控,及时处理系统问题,保障系统稳定运行。
6. 数据分析与持续改进:通过对生产数据的实时监控和分析,及时发现问题并进行持续改进,以提升生产效率和产品质量。
《资源库的后台资源管理》讲解纲要《资源库(智障版)的后台资源管理》讲解纲要武昌培智中心学校建立了资源库系统平台,首先要了解学科资源库(先按学科、主题分类,再按照教材、教案、音频、视频、图片<图形/图像>、动画、网络资源和其他文本八种资源类型分类)学科分类如下:1、适应:适应(中度)45个主题;生活适应(重度)42个主题2、常识(轻度)56个主题3、脑瘫运动康复训练4、孤独症感觉统合训练5、实用语文72个主题6、语沟(重度)41个主题7、唱游91个主题8、感知8个主题9、体康8个主题10、美工63个主题11、信息技术10个主题12、实用数学7个主题下面主要从使用资源、管理资源和资源上传三方面来了解资源库(智障版)的后台资源管理。
一、资源库平台的使用1、访问资源库通过IE浏览器,在地址栏中输入http://服务器IP地址,直接访问资源库平台。
2、搜索资源(1)普通搜索:可以通过“标题”和“描述”查找资源。
(2)高级搜索:可分别在“资源标题”、“关键词”、“资源描述”、“分库”、“资源类型”、“格式”等搜索栏中输入相关内容进行查找,如以上搜索栏中不填任何内容或选择“全部”,则将会在所有资源中搜索。
也可通过两个或两个以上搜索栏进行综合查找。
(3)按学科分类点击相应学科进入学科资源页面后,可在屏幕左上方的的搜索栏中通过“标题”或“描述”查找相应学科的内容。
3、资源浏览(1)按学科分类点击相关链接进行浏览。
(2)请选择屏幕左侧目录列表中的科目、主题、资源分类等文件目录。
(3)当屏幕右侧出现相关资源列表内容时,点击标题即可浏览。
(4)当点击音视频等媒体文件时,如果无法打开,请检查是否安装了相关播放软件、插件,如:暴风影音等。
4、资源下载(1)当右侧界面出现资源列表内容时,右键点击标题,选择“目标另存为”即可,如果文件名为乱码,请重新输入文件名(建议先复制标题,再在文件名的位置粘贴即可)。
(2)图片文件下载,也可在显示图片上点击右键,选择“图片另存为”。
高效利用资源的建设方案规划近年来,随着全球经济的快速发展和人口的不断增加,资源的稀缺性问题日益凸显。
如何高效利用资源,成为了建设方案规划的重要议题。
本文将探讨高效利用资源的建设方案规划,并提出一些可行的解决方案。
一、资源的重要性与挑战资源是人类社会发展的基础,包括自然资源、人力资源、科技资源等。
然而,由于资源的有限性,我们面临着诸多挑战。
首先,自然资源的过度开采和污染导致了环境恶化和生态系统崩溃的风险。
其次,人力资源的不合理配置和浪费使得社会发展面临瓶颈。
再次,科技资源的滥用和不合理利用可能导致技术进步的停滞。
二、高效利用自然资源的建设方案规划1. 提倡可持续发展:可持续发展是高效利用自然资源的关键。
政府应制定相关政策,鼓励企业和个人采取节约能源、降低排放、推广循环经济等措施,以减少资源的消耗和环境的破坏。
2. 加强环境保护:保护自然环境是高效利用资源的前提。
政府应加大环境治理力度,加强环境监测和执法,严惩环境污染行为。
同时,鼓励绿色技术和清洁能源的研发和应用,以减少对自然资源的依赖。
3. 推动循环经济:循环经济是高效利用自然资源的重要路径。
政府应加大对循环经济的支持,鼓励企业开展废弃物资源化利用、废弃物能源化利用等活动,以实现资源的最大化利用。
三、高效利用人力资源的建设方案规划1. 优化教育体系:教育是高效利用人力资源的基础。
政府应加大教育投入,改善教育设施和师资条件,提高教育质量。
同时,鼓励学生发展多元化的技能和才能,以满足社会对各类人才的需求。
2. 推动人才流动:人才流动是高效利用人力资源的重要途径。
政府应制定相关政策,鼓励人才跨地区、跨行业的流动,促进人才资源的合理配置。
同时,加强人才评价和激励机制,提高人才的积极性和创造力。
3. 加强职业培训:职业培训是高效利用人力资源的有效手段。
政府应加大对职业培训的投入,提供多样化的培训课程和机会,帮助劳动者提升技能和适应市场需求的变化。
四、高效利用科技资源的建设方案规划1. 加强科技创新:科技创新是高效利用科技资源的关键。
工作计划的资源利用与关键目标实现一、引言工作计划是指在特定时间范围内,为实现组织或个人的目标而制定的具体工作安排和行动计划。
一个科学合理的工作计划,可以帮助我们高效地利用资源,实现关键目标。
本文将探讨工作计划中资源的合理利用和关键目标的实现。
二、明确目标制定工作计划之前,首先需要明确工作的目标。
目标的明确性有助于我们更好地规划工作内容和时间。
只有明确了目标,才能更好地利用资源,实现关键目标。
三、分配优先级在进行工作计划时,我们需要对不同的任务进行优先级的划分。
将任务按照紧急程度和重要程度进行分类,优先处理重要而紧急的任务。
合理分配优先级,可以更好地利用时间和资源,高效完成工作。
四、合理规划时间时间是有限的资源,合理规划时间,对工作计划至关重要。
我们可以根据任务的紧急程度和重要程度,制定详细的时间安排。
将时间合理分配给不同的任务,可以有效地避免时间的浪费,提高工作效率。
五、充分发挥团队协作优势合理利用团队资源,是工作计划中关键的一部分。
团队协作可以将个人的优势和才能充分发挥出来,在有限的时间和资源内,实现更多的目标。
因此,在制定工作计划时,应充分考虑团队的配合,合理安排任务分工,推动团队的整体发展。
六、合理分配资源不同的任务需要不同的资源支持,合理分配资源是实现关键目标的重要保障。
我们需要根据任务的性质和要求,确定所需的人力、物力和财力资源,并进行适当分配。
只有合理分配资源,才能满足任务的需求,顺利完成关键目标。
七、灵活调整策略在工作计划执行过程中,我们可能会面临各种变化和挑战。
此时,我们需要保持灵活性,随时调整工作策略。
灵活调整策略有助于我们更好地利用资源,应对问题,实现预定的关键目标。
八、监测与评估工作计划的执行过程中,我们需要及时监测和评估工作的进展情况。
这有助于我们发现问题和不足,并及时采取措施进行调整。
通过监测与评估,可以更好地利用资源,实现关键目标。
九、与经验总结相结合过去的经验是宝贵的财富,我们可以将过去的成功和失败进行总结,在工作计划中加以利用。
高效利用资源的实施方案随着社会的不断发展,资源稀缺的问题逐渐凸显出来。
为了实现可持续发展,我们必须采取措施来高效利用有限的资源。
本文将探讨一些实施方案,帮助我们更好地利用资源。
一、提高资源利用效率我们可以通过提高资源利用的效率来更好地满足需求。
首先,我们应该加强对资源的管理和监控。
通过建立科学的资源管理制度,我们可以实时了解资源的使用情况以及可能存在的浪费问题。
其次,我们应该推广先进的节能技术和设备。
通过提高设备的能效水平,我们可以减少能源的消耗,从而达到更高效的资源利用效果。
二、加强资源的再利用和回收资源的再利用和回收是实现高效利用的关键步骤。
首先,我们应该加大对废弃物的回收力度。
通过建立健全的废物回收系统,可以将废弃物转化为可再利用的资源。
其次,我们应该鼓励和支持废弃物的再生产。
通过将资源重新加工,可以降低生产成本,减少资源的浪费。
三、推广循环经济模式循环经济是一种可持续发展的经济模式,可以实现资源的高效利用。
我们应该积极推广循环经济模式,包括生产、消费和废弃物处理等各个环节。
采用循环经济模式可以减少资源的消耗,降低环境污染,实现经济的可持续发展。
四、加强资源的合理配置资源的合理配置是高效利用的前提条件。
我们应该加强资源的规划和管理,避免资源的过度开发和浪费。
同时,我们还应该鼓励资源的合理流动。
通过建立资源交易市场和促进资源流通,可以实现资源的优化配置,提高资源利用效率。
五、加强教育和宣传教育和宣传是实施高效利用资源方案的重要手段。
我们应该加强对资源稀缺性和环境保护的教育,提高公众对资源利用的认识和重视程度。
同时,我们还应该加强宣传工作,提高公众的环保意识和节约意识。
只有大家共同努力,才能够实现高效利用资源的目标。
六、推动绿色生产和消费绿色生产和消费是实现高效利用资源的重要途径。
各个产业应该加大对绿色生产技术的研发和推广,减少对资源的消耗和环境的污染。
同时,消费者也应该改变消费观念,选择绿色环保的产品,减少对资源的浪费。