变性梯度凝胶电泳(DGGE)
- 格式:doc
- 大小:19.50 KB
- 文档页数:3

高通量测序和DGGE分析土壤微生物群落的技术评价一、本文概述随着生物技术的发展和深入,土壤微生物群落的研究逐渐受到广泛关注。
作为土壤生态系统的重要组成部分,微生物群落的结构和多样性对土壤健康、生态平衡以及农业可持续发展具有重要影响。
高通量测序技术和DGGE(变性梯度凝胶电泳)分析是近年来在微生物生态学研究中常用的两种技术手段,它们各自具有独特的优势和局限性。
本文旨在全面评价这两种技术在土壤微生物群落研究中的应用效果,以期为相关领域的研究提供有益的参考和借鉴。
本文首先将对高通量测序技术和DGGE分析的基本原理、操作流程及其在土壤微生物群落研究中的应用进行详细介绍。
随后,通过综述已有文献和案例分析,评估这两种技术在揭示土壤微生物群落结构、多样性和动态变化方面的准确性和可靠性。
本文还将探讨这两种技术在实践应用中的优缺点、适用范围及限制条件,以期为研究者在选择合适的技术手段时提供有益的指导。
本文旨在通过深入评价高通量测序和DGGE分析在土壤微生物群落研究中的应用效果,为相关领域的研究提供有价值的参考信息,推动土壤微生物生态学研究的深入发展。
二、高通量测序技术及其在土壤微生物群落分析中的应用高通量测序技术,又被称为下一代测序技术(Next Generation Sequencing,NGS),是近年来生物学领域革命性的技术进步之一。
它允许在单次运行中同时对数百万至数十亿的DNA分子进行测序,极大地提高了测序通量和效率。
在土壤微生物群落分析中,高通量测序技术已成为不可或缺的工具。
高通量测序技术基于边合成边测序的原理,通过桥式PCR扩增生成DNA簇,并利用可逆性终止子的荧光标记核苷酸进行连续测序。
在测序过程中,每加入一种荧光标记的核苷酸,都会通过扫描记录下荧光信号,并切除荧光基团和终止基团,继续进行下一个核苷酸的添加和测序。
这一过程循环进行,直至获得完整的DNA序列信息。
土壤是一个极为复杂的生态系统,其中包含了大量的微生物种类和种群。
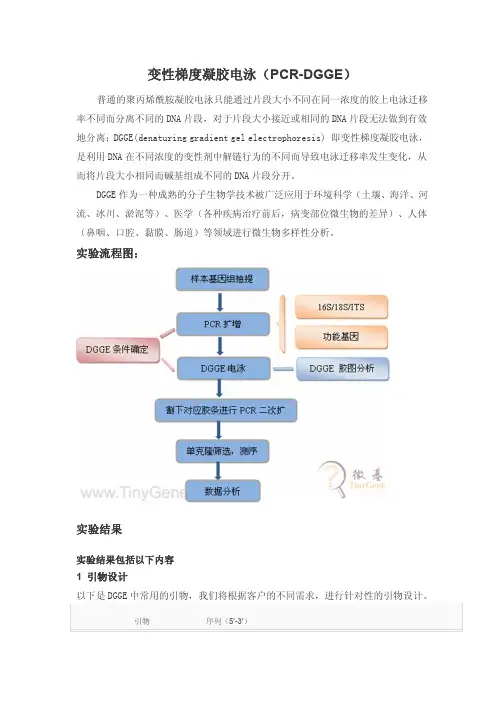
变性梯度凝胶电泳(PCR-DGGE)普通的聚丙烯酰胺凝胶电泳只能通过片段大小不同在同一浓度的胶上电泳迁移率不同而分离不同的DNA片段,对于片段大小接近或相同的DNA片段无法做到有效地分离;DGGE(denaturing gradient gel electrophoresis) 即变性梯度凝胶电泳,是利用DNA在不同浓度的变性剂中解链行为的不同而导致电泳迁移率发生变化,从而将片段大小相同而碱基组成不同的DNA片段分开。
DGGE作为一种成熟的分子生物学技术被广泛应用于环境科学(土壤、海洋、河流、冰川、淤泥等)、医学(各种疾病治疗前后,病变部位微生物的差异)、人体(鼻咽、口腔、黏膜、肠道)等领域进行微生物多样性分析。
实验流程图:实验结果实验结果包括以下内容1 引物设计以下是DGGE中常用的引物,我们将根据客户的不同需求,进行针对性的引物设计。
引物序列(5’-3’)细菌 16S V3区扩增引物357-F-GC CGCCCGCCGCGCGCGGCGGGCGGGGCGGGG GCACGGGGGGCCTACGGGAGGCAGCAG518r ATTACCGCGGCTGCTGG引物 序列(5’-3’)真核 18S V1-3区扩增引物Euk1A CTGGTTGATCCTGCCAGEukA516r-GCCGCCCGGGGCGCGCCCCGGGCGGGGCGGGGGCA CGGGGGGACCAGACTTGCCCTCC2 基因组DNA 抽提电泳检测图针对客户的样本来源不同,我们针对性优化不同的基因组抽提方法,已达到提取效果最佳。
说明:1-8为样本所抽提基因组DNA,上样量3uL;M 为1kb Marker 上数第一条带为8 kb,中间的亮带为3kb,浓度为30ng/uL,其余为10 ng/uL。
3 目的片段PCR 检测说明:1-8为样本,负为负对照(说明我们的实验没有污染,这对分子实验是至关重要的),上样量为5uL;M 为DL2000 Marker,上样量3uL。
变性梯度凝胶电泳《变性梯度凝胶电泳》是一种有效的分离技术,它可以帮助科学家快速有效地分离不同类型的分子。
它和其他分离技术相比,有着独特的优势和不可替代的优势。
变性梯度凝胶电泳(DGGE)采用特殊的凝胶在不同变性环境中电泳,以有效地分离不同类型的DNA片段和蛋白质。
正常情况下,由于更多的低能量的片段的存在,特定的变性环境会吸引这些较低能量的片段,并且它们走的路程也会比较短,而其他高能量的片段则会走的路程会更长。
因此,将凝胶改变到一种低能量的片段可以吸引,而走得路程更长的片段,则可以有效地将这些片段分离开来。
DGGE的优点是它可以有效分离不同片段的DNA和蛋白质,并且可以更快地分离出更多的细小片段。
此外,由于DGGE有一个独特的低能量环境,它可以更好的区分不同的片段,而不会受到其他分离技术的限制。
另外,DGGE是一种半定量的分离技术,可以让研究者比较不同片段之间的相对含量。
除了上述优势,DGGE还具有一些缺点。
首先,由于梯度凝胶电泳系统搭建起来比较复杂,使用它来进行分离技术需要比较复杂的实验技术。
其次,由于梯度凝胶电泳系统比较复杂,对系统的调整和控制非常复杂,只有熟练的实验室人员才能处理好这些技术。
变性梯度凝胶电泳的应用非常广泛,它可以用来分离和分析不同类型的DNA片段和蛋白质,甚至可以用来检测细菌的抗药性。
它也可以用来研究基因的多样性,用于癌症和免疫系统的研究,以及对特定疾病的诊断。
最后,它也可以作为一种植物鉴定技术,用于比较不同植物类型间的分子差异。
总之,变性梯度凝胶电泳(DGGE)是一种有效的分离技术,它可以用于研究不同类型的DNA片段和蛋白质,还可以用于分析肿瘤细胞的分子结构,对特定疾病的诊断和植物鉴定。
它具有独特的低能量环境,可以更好的区分不同的片段,而不会受到其他分离技术的限制。
它具有快速、高效和半定量的优势,是研究DNA分子和蛋白质的有效分离技术。
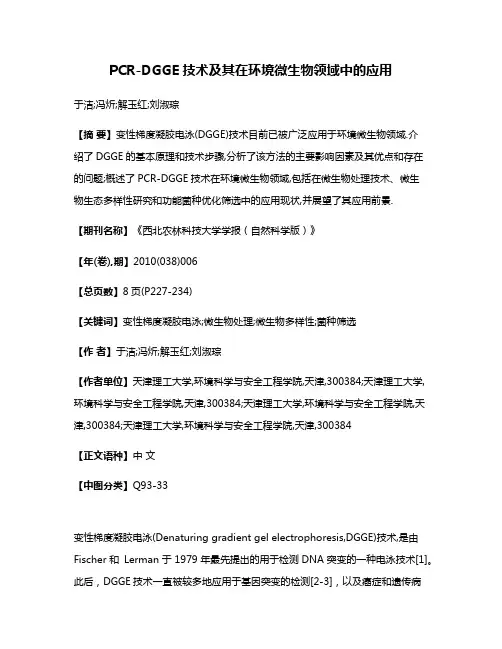
PCR-DGGE技术及其在环境微生物领域中的应用于洁;冯炘;解玉红;刘淑琮【摘要】变性梯度凝胶电泳(DGGE)技术目前已被广泛应用于环境微生物领域.介绍了DGGE的基本原理和技术步骤,分析了该方法的主要影响因素及其优点和存在的问题;概述了PCR-DGGE技术在环境微生物领域,包括在微生物处理技术、微生物生态多样性研究和功能菌种优化筛选中的应用现状,并展望了其应用前景.【期刊名称】《西北农林科技大学学报(自然科学版)》【年(卷),期】2010(038)006【总页数】8页(P227-234)【关键词】变性梯度凝胶电泳;微生物处理;微生物多样性;菌种筛选【作者】于洁;冯炘;解玉红;刘淑琮【作者单位】天津理工大学,环境科学与安全工程学院,天津,300384;天津理工大学,环境科学与安全工程学院,天津,300384;天津理工大学,环境科学与安全工程学院,天津,300384;天津理工大学,环境科学与安全工程学院,天津,300384【正文语种】中文【中图分类】Q93-33变性梯度凝胶电泳(Denaturing gradient gel electrophoresis,DGGE)技术,是由Fischer和Lerman于1979年最先提出的用于检测DNA突变的一种电泳技术[1]。
此后,DGGE技术一直被较多地应用于基因突变的检测[2-3],以及癌症和遗传病的筛查及诊断中。
1993年,Muyzer等[4]首次将DGGE技术应用于研究微生物菌苔和生物膜系统的群落多样性,证实了这种技术在研究自然界微生物群落的遗传多样性和种群差异方面具有明显的优越性。
在此之后,DGGE技术开始在环境微生物研究中应用并得到发展[5-6]。
该法在应用中除其自身具有的明显优势外,也出现了一些不足之处。
本文对DGGE技术原理和技术步骤进行了分析,并对该技术在环境微生物领域中的应用情况进行了整体评述,以期为DGGE技术更好地应用于环境微生物研究提供更多的理论依据。
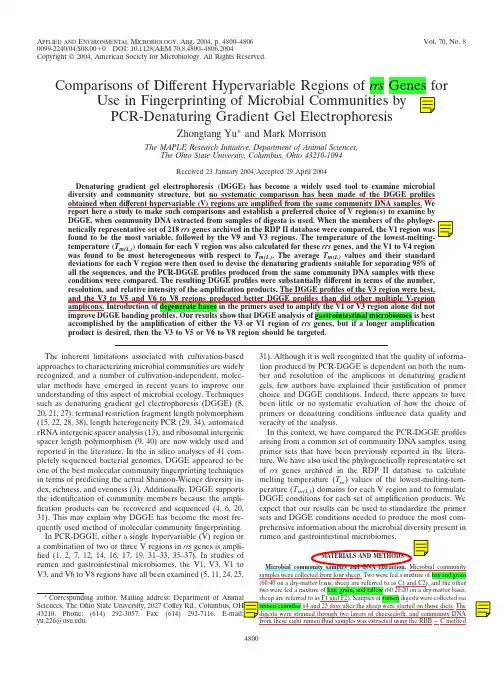
A PPLIED AND E NVIRONMENTAL M ICROBIOLOGY ,Aug.2004,p.4800–4806Vol.70,No.80099-2240/04/$08.00ϩ0DOI:10.1128/AEM.70.8.4800–4806.2004Copyright ©2004,American Society for Microbiology.All Rights Reserved.Comparisons of Different Hypervariable Regions of rrs Genes forUse inFingerprinting of Microbial Communities byPCR-Denaturing Gradient GelElectrophoresisZhongtang Yu*andMark MorrisonThe MAPLE Research Initiative,Department of Animal Sciences,The Ohio State University,Columbus,Ohio 43210-1094Received 23January 2004/Accepted 29April 2004Denaturing gradient gel electrophoresis (DGGE)has become a widely used tool to examine microbial diversity and community structure,but no systematic comparison has been made of the DGGE profiles obtained when different hypervariable (V)regions are amplified from the same community DNA samples.We report here a study to make such comparisons and establish a preferred choice of V region(s)to examine by DGGE,when community DNA extracted from samples of digesta is used.When the members of the phyloge-netically representative set of 218rrs genes archived in the RDP II database were compared,the V1region was found to be the most variable,followed by the V9and V3regions.The temperature of the lowest-melting-temperature (T m(L))domain for each V region was also calculated for these rrs genes,and the V1to V4region was found to be most heterogeneous with respect to T m(L).The average T m(L)values and their standard deviations for each V region were then used to devise the denaturing gradients suitable for separating 95%of all the sequences,and the PCR-DGGE profiles produced from the same community DNA samples with these conditions were compared.The resulting DGGE profiles were substantially different in terms of the number,resolution,and relative intensity of the amplification products.The DGGE profiles of the V3region were best,product is desired,then the V3to V5or V6to V8region should be targeted.The inherent limitations associated with cultivation-based approaches to characterizing microbial communities are widely recognized,and a number of cultivation-independent,molec-ular methods have emerged in recent years to improve our understanding of this aspect of microbial ecology.Techniques such as denaturing gradient gel electrophoresis (DGGE)(8,20,21,27),terminal restriction fragment length polymorphism (15,22,28,38),length heterogeneity PCR (29,34),automated rRNA intergenic spacer analysis (13),and ribosomal intergenic spacer length polymorphism (9,40)are now widely used and reported in the literature.In the in silico analyses of 41com-pletely sequenced bacterial genomes,DGGE appeared to be one of the best molecular community fingerprinting techniques in terms of predicting the actual Shannon-Wiener diversity in-dex,richness,and evenness (3).Additionally,DGGE supports the identification of community members because the ampli-fication products can be recovered and sequenced (4,6,20,31).This may explain why DGGE has become the most fre-quently used method of molecular community fingerprinting.In PCR-DGGE,either a single hypervariable (V)region or a combination of two or three V regions in rrs genes is ampli-fied (1,2,7,12,14,16,17,19,31–33,35–37).In studies of rumen and gastrointestinal microbiomes,the V1,V3,V1to V3,and V6to V8regions have all been examined (5,11,24,25,31).Although it is well recognized that the quality of informa-tion produced by PCR-DGGE is dependent on both the num-ber and resolution of the amplicons in denaturing gradient gels,few authors have explained their justification of primer choice and DGGE conditions.Indeed,there appears to have been little or no systematic evaluation of how the choice of primers or denaturing conditions influence data quality and veracity of the analysis.In this context,we have compared the PCR-DGGE profiles arising from a common set of community DNA samples,using primer sets that have been previously reported in the litera-ture.We have also used the phylogenetically representative set of rrs genes archived in the RDP II database to calculate melting temperature (T m )values of the lowest-melting-tem-perature (T m(L))domains for each V region and to formulate DGGE conditions for each set of amplification products.We expect that our results can be used to standardize the primer sets and DGGE conditions needed to produce the most com-prehensive information about the microbial diversity present in rumen and gastrointestinal microbiomes.MATERIALS AND METHODSMicrobial community samples and DNA extraction.Microbial samples were collected from four sheep.Two were fed a from these eight rumen fluid samples was extracted using the RBB ϩC method*Corresponding author.Mailing address:Department of Sciences,The Ohio State University,2027Coffey Rd.,Columbus,43210.Phone:(614)292-3057.Fax:(614)292-7116.yu.226@.4800(41).The DNA recovered from each sample was quantified using the PicoGreen double-stranded DNA quantitation kit(Molecular Probes,Inc.,Eugene,Oreg.) and diluted to afinal concentration of50ng/l with Tris-EDTA.In silico analysis of rrs gene V regions.The phylogenetically representative setof218rrs geneswas downloaded from the RDP II database(release8.1).The Vregions were delimited by the primersequencesflanking them,and the respec-tive sequence identities were calculated using BioEdit(http://www.mbio.ncsu .edu/BioEdit/bioedit.html).The average(Ϯstandard deviation)of the percent sequence identities for each individual V region,or combination thereof,was calculated using Microsoft Excel.The T m(L)value of each V region was also calculated for the same sequences with Primo Melt3.4software(/primo/primomel .html),and the frequencies of T m(L)values for the V1,V3,and V5regions were graphed using Microsoft Excel.It was assumed that a40-bp GC clamp was present at one end of each amplicon.The average T m(L)for each V region and its standard deviation were calculated,and these values were used to predict the denaturing gradients needed to effectively resolve95%of all the amplicons produced by a specific primer set,with the following equations:d L͑%͒ϭ͑T m͑L͒ϪT b͒Ϫ2/C(1)d H͑%͒ϭ͑T m͑L͒ϪT b͒ϩ2/C(2)where d L and d H are the low and high denaturant concentrations,respectively; T m(L)is the average T m value of the lowest-melting-temperature domains of each amplicon;T b is the temperature of the running buffer(typically60°C);is the standard deviation corresponding to the average T m(L)of that amplicon;and C is a constant,relating chemical denaturant concentration to melting temperature of double-stranded DNA(in DGGE,Cϭ0.3°C/1%denaturant as described in reference10).PCR and DGGE.The primers,annealing temperatures,and DGGE conditions used in this study are listed in Table1.The following degenerate primer sets were used to evaluate the effects of primer degeneracy on DGGE profiles:Deg-63f (5Ј-GCY TAA BVC ATG CRA GTC-3Ј),Deg-109r(5Ј-AYG YRT TAC TSA SCC KT-3Ј);Deg-357f(5Ј-ACW CCT ACG GGD SGC WGC A-3Ј),and Deg-518r(5Ј-GTA TTA CCG CGG CKG CTG-3Ј).Degenerate bases(equimolar ratios)were introduced at positions where two or more nucleotides occur at relatively high frequency within the phylogenetically representative set of rrs genes.Inosine-containing primers with the underlined bases replaced with ino-sine were also tested.All PCR amplifications were performed using a PTC-100 thermocycler(MJ Research,Waltham,Mass.)in50-l volumes containing1ϫPCR buffer(20mM Tris-HCl[pH8.4]and50mM KCl),200M deoxynucleo-side triphosphates,500nM(each)primer,1.75mM MgCl2,670ng of bovine serum albumin/l,and1.25U of Platinum Taq DNA polymerase(InvitrogenTABLE1.PCR primers,targeted hypervariable regions,PCR,and DGGE conditions used in this studyPrimer Sequence(5Ј33Ј)Annealingpositions b Target Annealing tempAmpliconlength(bp)c DGGE conditionsRefer-ence(s)Ϫ63f a GCC TAA CAC ATG CAA GTC46–63V158353°C,Ϫ0.5°C/cycle808%,30–50%,620V⅐h2,31 109r ACG TGT TAC TCA CCC GT109–125Ϫ63f a GCC TAA CAC ATG CAA GTC46–63V1–V358353°C,Ϫ0.5°C/cycle489 6.5%,20–70%,1,230V⅐h5 518r ATT ACC GCG GCT GCT GG518–534Ϫ357f a CCT ACG GGA GGC AGC AG341–357V361356°C,Ϫ0.5°C/cycle194 6.5%,40–60%,1,230V⅐h7,35 518r ATT ACC GCG GCT GCT GG518–534533f GTG CCA GCA GCC GCG GTA A515–533V4–V556351°C,Ϫ0.5°C/cycle412 6.5%,20–70%,1,230V⅐h16 907r a CCG TCA ATT CCT TTG AGT TT907–926Ϫ357f a CCT ACG GGA GGC AGC AG341–357V3–V556351°C,Ϫ0.5°C/cycle586 6.5%,30–60%,1,230V⅐h1,37 907r CCG TCA ATT CCT TTG AGT TT907–926Ϫ954f a GCA CAA GCG GTG GAG CAT GTG G933–954V6–V861356°C,Ϫ0.5°C/cycle456 6.5%,35–60%,1,230V⅐h18,19 1369r GCC CGG GAA CGT ATT CAC CG1369–1388F-968a AAC GCG AAG AAC CTT AC968–984V6–V861356°C,Ϫ0.5°C/cycle434 6.5%,35–60%,1,230V⅐h25,42 R-1401CGG TGT GTA CAA GAC CC1385–14011070f ATG GCT GTC GTC AGC T1055–1070V853348°C,Ϫ0.5°C/cycle352 6.5%,40–60%,1,230V⅐h12,14Ϫ1392r a ACG GGC GGT GTG TAC1392–1406a Primers with a40-bp GC clamp at the5Јend.b Numbering according to the rrs gene of Escherichia coli.c Calculated from the rrs gene of E.coli;the primers were included.TABLE2.Sequence identities of the PCR amplicons calculated from the phylogenetically representative set of218rrs genes in RDP II and the melting temperatures of the lowest-melting-temperature domains(T m(L))Hypervariableregion %Sequenceidentity aNo.of T m(L)groups bNo.of sequences sharingthe same T m(L)Avg T m(L)(°C)aDenaturantgradient(%)cV134.4(12.1)120 1.8377.6(4.9)26–91V262.9(8.0)108 2.0374.1(3.3)25–69V360.9(15.4)89 2.4676.3(2.6)37–72V467.4(8.4)93 2.3576.3(2.7)36–72V573.5(7.1)77 2.8476.3(2.1)40–68V669.3(15.3)64 3.4277.1(1.6)46–68V876.5(7.6)73 3.0075.7(1.9)40–65V948.3(16.2)84 2.6177.6(2.5)42–75V1–V352.7(20.7)101 2.1774.5(3.2)27–70V3–V569.2(9.0)91 2.4174.7(2.7)31–67V4–V571.7(7.2)89 2.4674.8(2.5)33–66V6–V8d70.6(10.5)80 2.7473.6(2.2)31–60V6–V8e71.8(10.3)78 2.8075.1(2.2)36–65V7–V874.2(7.5)75 2.9275.3(2.2)36–66a Values in parentheses are standard deviations.b Difference ofϾ0.1°C.c Assuming that DGGE gels are run at60°C.d Amplicons delimited with GC-954f and1368r.e Amplicons delimited with F-968-GC and R-1401.V OL.70,2004COMPARISONS OF HYPERVARIABLE REGIONS BY PCR-DDGE4801Corporation,Carlsbad,Calif.),which allows for hot-start PCR.After an initial denaturation at 94°C for 5min,10cycles of touchdown PCR were performed (denaturation at 94°C for 30s,annealing for 30s with an 0.5°C/cycle decrement at a temperature 5°C above the respective annealing temperatures indicated in Table 1,and extension at 72°C for 1min),followed by 25cycles of regular PCR (94°C for 30s,30s at the respective annealing temperature,and 72°C for 1min [0.5min for PCR ampli fication of the V1region])and a final extension step for 7min at 72°C.Negative controls,containing all the components except DNA templates,were included in parallel.After PCR,5-l aliquots were subjected to agarose gel electrophoresis with 1.5%(wt/vol)agarose gels (2%[wt/vol]for the V1-region amplicons).Then,15-l aliquots were resolved on polyacrylamide gels (37.5:1)containing a gradi-ent of denaturants (100%denaturants consisting of 40%[vol/vol]formamide and 7M urea)as indicated in Table 1.All the DGGE gels were run at 60°C and 82V to reach the volts-hours indicated in Table 1,with a Dcode Universal Mutation detection system (Bio-Rad Laboratories,Hercules,Calif.).The DGGE gels were stained with GelStar (BioWhittaker Molecular Applications,Rockland,Maine)according to the manufacturer ’s speci fications,and the images were captured using a FluorChem Imager (Alpha Innotech Corp.,San Leandro,Calif.).DGGE gel analysis.The DGGE bands were detected using the band-searching algorithm of BioNumerics software (BioSystematica,Tavistock,Devon,United Kingdom).After normalization of the gels,only those bands with a peak height intensity exceeding 2.0%of the strongest band in each lane were included in further analyses.Diversity indices were also calculated:richness (S )was deter-mined from the number of bands in each lane,and the Shannon-Wiener index (H Ј)was calculated from H ЈϭϪ⌺P i ln P i (30),where P i is the importance probability of the bands in a lane,calculated from n i /N ,where n i is the peak height of a band and N is the sum of all peak heights in the densitometric curve.Evenness (E )was calculated as E ϭH Ј/H Јmax ,where H Јmax ϭln S (26).RESULTSSequence divergence within various V regions and their T m(L)heterogeneity.With the use of the phylogenetically rep-resentative set of rrs genes archived at RDP II,the V1region was found to be the most divergent,as indicated by the low average sequence identities and the high standard deviation (Table 2).The V3and V9regions are also more divergent than the remaining V regions examined.Accordingly,the V1,V2,and V3regions combined were found to possess the highest sequence divergence compared to the other multiple V re-gions.The average T m(L)values for the V regions ranged from 73.6to 77.6°C (Table 2),and the V1,V2,and V1to V3regions possess the greatest T m(L)heterogeneity,while the V5,V6,V8,and V7-V8regions have the lowest T m(L)heterogeneity.More-over,the frequency of calculated T m(L)values for the V1,V3,and V5regions all appeared to be normally distributed about the average value (Fig.1).Equations 1and 2described in Materials and Methods were therefore devised to predict the denaturing gradient necessary to resolve 95%of the ampli fi-cation products arising for each V region.Table 2shows that the V1region requires the largest denaturing gradient (26to 91%),while the V6region requires the smallest (46to 68%).With the use of these equations,the denaturing gradients listed for the V1,V3,and V5regions should effectively resolve 95.0,95.4,and 92.7%of the 218phylogenetically representative rrs sequences,respectively.DGGE pro files of rumen microbial community DNA sam-ples.The DGGE pro files produced using the different primer sets and conditions listed in Table 1are shown in Fig.2,and the diversity indices calculated from the PCR-DGGE banding pro files are shown in Table 3.Ampli fication of either the V1or V3region alone yielded more intense bands,and the V3region produced the largest number of bands (and richness score),followed by the V1and V8regions.However the V1,V3,and V8DGGE pro files all produced relatively low evenness scores,apparently due to the existence of a relatively small number of intense bands.When multiple V regions were ampli fied,the richness scores were all lower than that for the V3region alone,because of the reduced number of discernible bands,and the V1to V3region was not ampli fied as ef ficiently as were other V regions,as judged by the intensity of the bands on theFIG.1.Frequency distribution of T m(L)values for the V1region (A),V3region (B),and V5region (C),derived from the phylogeneti-cally representative set of 218rrs gene sequences archived in RDP II (release 8.1).The arrows indicate the average T m(L)value calculated for each V region,and the T m(L)values appear to be normally distrib-uted.4802YU AND MORRISON A PPL .E NVIRON .M ICROBIOL .DGGE gel (Fig.2).In contrast,the evenness scores were all higher for the multiple-V-region pro files,suggesting that band intensity was more uniform in these DGGE pro files.Another interesting finding was the differences arising in DGGE pro-files and diversity indices when the different V6to V8primer sets were used (Fig.2and Table 3).Overall,the primer set consisting of GC-954f and 1369r resulted in higher values than those obtained with F-968-GC and R-1401,although both primer sets were found to produce lower richness,Shannon-Wiener,and evenness values than those for the V3to V5region (Table 3).Based on these results,it appears that am-pli fication of the V3region alone produced the most informa-tive DGGE pro files,and if a longer ampli fication product is required,then either the V3to V5region or the V6toV8FIG.2.DGGE banding pro files of V regions produced from the community DNA extracted from eight different samples of ruminal digesta.The nondegenerate primers and DGGE conditions described in Table 1were used in the PCR and DGGE.The lanes labeled C1and C2represent samples of digesta collected from animals fed a mixture of hay and grain,and the lanes labeled F1and F2represent samples of digesta collected from animals fed a mixture of hay,grain,and beef tallow.D14and D23,samples collected 14and 23days,respectively,after the animals were started on the diet;Marker,electrophoresis marker;V6to V8a ,DGGE pro files generated using primers GC-954f and 1369r;V6to V8b ,DGGE pro files generated using primers F-968-GC and R-1401.TABLE 3.Diversity indices calculated from the DGGE bandingpro files generated from various hypervariable regionsV region(s)Richness (S )H ЈaH Јmax bEvenness (E )V124.6 2.67 3.200.83V331.3 3.04 3.440.88V815.0 1.64 2.710.61V1–V315.3 2.58 2.730.95V3–V521.8 3.03 3.080.98V4–V514.3 2.37 2.660.89V6–V8c 20.8 2.95 3.050.97V6–V8d17.3 2.46 2.850.86a H Ј,Shannon-Wiener index.bH Јmax ,maximum Shannon-Wiener index.cPrimers used were GC-954f and 1369r,as described by Iwamoto et al.(18).dPrimers used were F-968-GC and R-1401as described by Nu ¨bel et al.(25).V OL .70,2004COMPARISONS OF HYPERVARIABLE REGIONS BY PCR-DDGE 4803region ampli fied with the GC-954f –1369r primer set should be selected.Impact of degenerate PCR primers on DGGE pro file.The introduction of degenerate bases into the V1-speci fic primer set substantially decreased the number of bands (Fig.3A),and the replacement with inosine resulted in unsuccessful PCR ampli fication at the various annealing temperatures (42to 64°C)and MgCl 2concentrations (1.5to 2.75mM)tested.The degenerate primers speci fic for the V3region increased the number of bands at the upper portion of the DGGE gel,but there was a decrease in the number of bands appearing at the lower portion of the gel (Fig.3B).Although the use of inosine-containing primers resulted in a more even band distribution in the DGGE gel (Fig.3C),there was little in fluence on the diversity indices (data not shown).Based on these results,it appears that the introduction of degenerate bases and/or ino-sine in the V1and V3primer sequences does not improve the PCR-DGGE pro files.DISCUSSIONAlthough there are numerous published reports of using PCR-DGGE to examine microbial diversity (e.g.,references 1,12,14,16,18,and 19),how the quality of the information obtained is impacted by the choice of V region(s)ampli fied has not been previously evaluated.The results presented here with eight different community DNA samples clearly show that the V region(s)chosen for ampli fication can greatly in fluence the PCR-DGGE pro files and diversity indices produced from com-munity DNA samples,and even subtle differences in primer sequences can result in substantially different pro files and as-sessment of microbial diversity.The denaturing gradient used will also affect the results obtained,but this,too,has received little attention.The gradient estimation approach described here was very effective in producing well-resolved banding pro files,with all the primer sets used here.By using the set of 218rrs gene sequences archived in RDP II to calculate average T m(L)values (and standard deviations),we avoided bias to-wards those taxa that have more sequence representations in RDP II.However,our approach to choosing denaturing gra-dients should also be applicable to guild-,genus-,or species-speci fic PCR-DGGE analyses,where closely related sequences require a narrow denaturing gradient to maximize the resolv-ing power of DGGE.Theoretically the V1region,with the highest sequence di-vergence and T m(L)heterogeneity,should have produced DGGE pro files with the greatest number of resolved bands.However,the DGGE pro files of the V1region alone were inferior to those obtained with V3-speci fic primers (Table 3and Fig.2).This may be attributed to the limited length of the V1region,rather than the limited universality of the primer set used.This explanation is supported by the observation that degenerate primers did not improve DGGE pro files of the V1region (Fig.3A).For the V3region,although inosine replace-ments resulted in an increase in the number of bands at the lower portion of the DGGE gel (Fig.3C),the use of degen-erate primers did not improve the assessment of microbial diversity in the samples.For these reasons,we propose that PCR-DGGE targeting the V1region be avoided in future studies of gut microbiomes and that degenerate primers be used with caution in PCR-DGGE analyses.A necessary requirement of all DGGE-based studies of mi-crobial ecology is the reampli fication and sequencing of ex-cised amplicons,to provide a more detailed characterization of these microbial communities.For such purposes,longer am-plicons would be preferable to facilitate identi fication to spe-cies level with a higher degree of probability.Most automated DNA sequencers now produce in excess of 500bp of unam-biguous sequence,which can span at least two V regions.Based on the results obtained here,ampli fication of the V3to V5region produced superior DGGE pro files.Given the results obtained when either the V1or V3region was ampli fied alone,we were also surprised by the relatively poor DGGE pro files when the V1to V3region was ampli fied.An in silico analysis of the primer set consisting of GC-63f and 518r performed using Primer Designer (Scienti fic &Educational Software,Durham,N.C.)did not show primer self-annealing or hairpin bined with the results obtained when the V1region alone was ampli fied,a different forward primer (e.g.,27f,5Ј-AGA GTT TGA TCM TGG CTC AG-3Ј[23])may improve the ampli fication and DGGE pro files of the V1to V3region.It is interesting to notice the difference in results obtained when two different primer sets were used to amplify the V6toFIG.3.DGGE gel banding pro files of the V1and V3regions produced with V1-speci fic inosine-containing primers (A),V3-speci fic degenerate primers (B),or V3-speci fic inosine-containing primers (C).The labeling of lanes follows the same protocol as described for Fig.2.4804YU AND MORRISON A PPL .E NVIRON .M ICROBIOL .V8region(Fig.2and Table3).The primer set consisting of F-968-GC and R-1401set has been frequently used for PCR-DGGE analysis of community DNA samples from human and animal gastrointestinal tracts(11,21,39,42),while the primer set consisting of GC-954f and1369r has been used with other types of environmental samples(18,19).The annealing sites for these primers are in high proximity to each other:the F-968-GC and GC-954f primers are30nucleotides apart,and the R-1401and1369r primers are16nucleotides apart.How-ever,the primer set consisting of GC-954f and1369r is more universal than that consisting of F-968-GC and R1401,because when compared to all16S rrs sequences in RDP II(release 8.1),1369r matches many more(8,595perfect matches and 4,482nearly perfect matches[0.9ϽS abϽ1.0])than does R-1401(2,049perfect matches and495nearly perfect matches).The improved DGGE profiles derived with GC-954f and1369r are qualitatively consistent with the above in silico analysis,and the different DGGE profiles generated from these two primer sets suggest detection of different populations in the samples.For these reasons,we propose that,if the V6to V8region is chosen for PCR-DGGE analyses,a more infor-mative analysis of gastrointestinal microbiomes will be pro-duced by using GC-954and1369r rather than F-968-GC and R-1401.In conclusion,given the similarities among the microbial communities present in the gastrointestinal tracts of humans and other herbivores,in terms of the dominance of these communities by members of the phylum Bacteroidetes and class Clostridia,we recommend that the V3region be routinely used in PCR-DGGE analyses with such samples.Alternatively,the V3to V5or V6to V8(with the use of GC-954f and1369r) region can be chosen if a longer amplicon is preferred.ACKNOWLEDGMENTSThis work was supported by funds available to the authors through an Ohio Board of Regents Academic Enrichment Award and funds from the Ohio Agricultural Research and Development Center(Hatch Research Subsidy530189and OHOG0592-500486).We also thank Burk Dehority,Ohio Agricultural Research and Development Center,Wooster,for the collection of the samples of rumen digesta.REFERENCES1.Casamayor,E.O.,H.Schafer,L.Baneras,C.Pedros-Alio,and G.Muyzer.2000.Identification of and spatio-temporal differences between microbial assemblages from two neighboring sulfurous lakes:comparison by micros-copy and denaturing gradient gel electrophoresis.Appl.Environ.Microbiol.66:499–508.2.Cocolin,L.,M.Manzano,C.Cantoni,and i.2001.Denaturing gra-dient gel electrophoresis analysis of the16S rRNA gene V1region to mon-itor dynamic changes in the bacterial population during fermentation of Italian sausages.Appl.Environ.Microbiol.67:5113–5121.3.Crosby,L.D.,and C.S.Criddle.2003.Understanding bias in microbialcommunity analysis techniques due to rrn operon copy number heterogene-ity.BioTechniques34:790–802.4.Curtis,T.P.1998.The comparison of the diversity of activated sludge plants.Water Sci.Technol.37:71–78.5.De Boever,P.,R.Wouters,V.Vermeirssen,N.Boon,and W.Verstraete.2001.Development of a six-stage culture system for simulating the gastro-intestinal microbiota of weaned infants.Microbiol.Ecol.Health Dis.13:111–123.6.Diez,B.,C.Pedros-Alio,T.L.Marsh,and R.Massana.2001.Application ofdenaturing gradient gel electrophoresis(DGGE)to study the diversity of marine picoeukaryotic assemblages and comparison of DGGE with other molecular techniques.Appl.Environ.Microbiol.67:2942–2951.7.Dilly,O.,J.Bloem,A.Vos,and J.C.Munch.2004.Bacterial diversity inagricultural soils during litter decomposition.Appl.Environ.Microbiol.70: 468–474.8.Donskey,C.J.,A.M.Hujer,S.M.Das,N.J.Pultz,R.A.Bonomo,and L.B.e of denaturing gradient gel electrophoresis for analysis of the stool microbiota of hospitalized patients.J.Microbiol.Methods54:249–256.9.Eriksson,M.,E.Sodersten,Z.Yu,G.Dalhammar,and W.W.Mohn.2003.Degradation of polycyclic aromatic hydrocarbons at low temperature under aerobic and nitrate-reducing conditions in enrichment cultures from north-ern soils.Appl.Environ.Microbiol.69:275–284.10.Ezra,S.,S.Abrams,and e of denaturant gradient gelelectrophoresis to study conformational transitions in nucleic acids.Methods Enzymol.212:71–104.11.Favier,C.F.,E.E.Vaughan,W.M.de Vos,and A.D.L.Akkermans.2002.Molecular monitoring of succession of bacterial communities in human ne-onates.Appl.Environ.Microbiol.68:219–226.12.Ferris,M.,G.Muyzer,and D.Ward.1996.Denaturing gradient gel electro-phoresis profiles of16S rRNA-defined populations inhabiting a hot spring microbial mat community.Appl.Environ.Microbiol.62:340–346.13.Fisher,M.M.,and E.W.Triplett.1999.Automated approach for ribosomalintergenic spacer analysis of microbial diversity and its application to fresh-water bacterial communities.Appl.Environ.Microbiol.65:4630–4636. 14.Friedrich,M.,R.J.Grosser,E.A.Kern,W.P.Inskeep,and D.M.Ward.2000.Effect of model sorptive phases on phenanthrene biodegradation: molecular analysis of enrichments and isolates suggests selection based on bioavailability.Appl.Environ.Microbiol.66:2703–2710.15.Gong,J.,R.J.Forster,H.Yu,J.R.Chambers,R.Wheatcroft,P.M.Sabour,and S.Chen.2002.Molecular analysis of bacterial populations in the ileum of broiler chickens and comparison with bacteria in the cecum.FEMS Mi-crobiol.Ecol.41:171–179.16.Henckel,T.,M.Friedrich,and R.Conrad.1999.Molecular analyses of themethane-oxidizing microbial community in ricefield soil by targeting the genes of the16S rRNA,particulate methane monooxygenase,and methanol dehydrogenase.Appl.Environ.Microbiol.65:1980–1990.17.Hespell,R.B.,D.E.Akin,and B.A.Dehority.1997.Bacteria,fungi,andprotozoa of the rumen,p.59–141.In R.I.Mackie,B.A.White,and R.E.Isaacson(ed.),Gastrointestinal microbiology,vol.2.Chapman and Hall, New York,N.Y.18.Iwamoto,T.,K.Tani,K.Nakamura,Y.Suzuki,M.Kitagawa,M.Eguchi,and M.Nasu.2000.Monitoring impact of in situ biostimulation treatment on groundwater bacterial community by DGGE.FEMS Microbiol.Ecol.32: 129–141.19.Kawai,M.,E.Matsutera,H.Kanda,N.Yamaguchi,K.Tani,and M.Nasu.2002.16S ribosomal DNA-based analysis of bacterial diversity in purified water used in pharmaceutical manufacturing processes by PCR and dena-turing gradient gel electrophoresis.Appl.Environ.Microbiol.68:699–704.20.Kocherginskaya,S.A.,R.I.Aminov,and B.A.White.2001.Analysis of therumen bacterial diversity under two different diet conditions using denatur-ing gradient gel electrophoresis,random sequencing,and statistical ecology approaches.Anaerobe7:119–134.21.Konstantinov,S.R.,W.-Y.Zhu,B.A.Williams,S.Tamminga,W.M.de Vos,and A.D.L.Akkermans.2003.Effect of fermentable carbohydrates on piglet faecal bacterial communities as revealed by denaturing gradient gel electro-phoresis analysis of16S ribosomal DNA.FEMS Microbiol.Ecol.43:225–235.22.Kuske,C.R.,L.O.Ticknor,ler,J.M.Dunbar,J.A.Davis,S.M.Barns,and parison of soil bacterial communities in rhizospheres of three plant species and the interspaces in an arid grassland.Appl.Environ.Microbiol.68:1854–1863.ne,D.J.1991.16S/23S rRNA sequencing,p.115–175.In E.Stackebrandtand M.D.Goodfellow(ed.),Nucleic acid techniques in bacterial systematics.John Wiley&Sons,Inc.,New York,N.Y.24.Mai,V.,H.A.Katki,H.Harmsen,D.Gallaher,A.Schatzkin,D.J.Baer,andB.Clevidence.2004.Effects of a controlled diet and black tea drinking on thefecal microflora composition and the fecal bile acid profile of human volun-teers in a double-blinded randomized feeding study.J.Nutr.134:473–478.25.Nu¨bel,U.,B.Engelen,A.Felske,J.Snaidr,A.Wieshuber,R.Amann,W.Ludwig,and H.Backhaus.1996.Sequence heterogeneities of genes encod-ing16S rRNAs in Paenibacillus polymyxa detected by temperature gradient gel electrophoresis.J.Bacteriol.178:5636–5643.26.Pielou,E.C.1969.An introduction to mathematical ecology.Wiley,NewYork,N.Y.27.Plant,L.,m,P.L.Conway,and K.O’Riordan.2003.Gastrointestinalmicrobial community shifts observed following oral administration of a Lac-tobacillus fermentum strain to mice.FEMS Microbiol.Ecol.43:133–140. 28.Ranjard,L.,F.Poly,and S.Nazaret.2000.Monitoring complex bacterialcommunities using culture-independent molecular techniques:Application to soil environment.Res.Microbiol.151:167–177.29.Ritchie,N.J.,M.E.Schutter,R.P.Dick,and e oflength heterogeneity PCR and fatty acid methyl ester profiles to characterize microbial communities in soil.Appl.Environ.Microbiol.66:1668–1675. 30.Shannon,C.E.,and W.Weaver.1949.The mathematical theory of commu-nication.University of Illinois Press,Urbana.31.Simpson,J.M.,V.J.McCracken,H.R.Gaskins,and R.I.Mackie.2000.Denaturing gradient gel electrophoresis analysis of16S ribosomal DNAV OL.70,2004COMPARISONS OF HYPERVARIABLE REGIONS BY PCR-DDGE4805。


变性梯度凝胶电泳摘要:变性梯度凝胶电泳(DenaturingGradientGelE1ectrophoresiS,DGGE)是由Fisher 和Lerman发明用于检测DNA突变的技术,其主要是基于突变型和野生型棱酸序列的不同而导致其变性浓度的差异,利用变性梯度凝胶进行分离, 该手段分辨率达一个碱基。
恒定变性凝胶电泳(CDGE)、瞬时温度梯度电泳(TTGE)和温度梯度凝胶电泳(TGGE)是由DGGE经改进而成。
它们在突变分析上都有着重要的作用。
关键词:变性梯度凝胶电泳、恒定变性凝胶电泳、瞬时温度梯度电泳、温度梯度凝胶电泳1、前言:随着结构基因组计划接近尾声,人类基因神秘的面纱已逐步揭开,GenBank中已知基因的数目也与日俱增,各种遗传病的相关基因也了解得越来越多。
但是,在找到了候选基因后,还需要在相关的遗传病病人中进行突变检测,只有找到了相应的突变。
才能真正确定该基因与疾病的关系,从而服务于临床。
变性梯度凝胶电泳就是一种很有实用价值的突变分析方法。
该方法经改进,又发展出了恒定变性凝胶电泳(constant denaturant gel elec—trophoresis,CDGE)、瞬时温度梯度电泳(temporaltemperature gradient electrophoresis,TTGE)和温度梯度凝胶电泳(temperature gradient gel elec—trophoresis,TGGE)。
现在上述方法已经广泛应用于遗传病的诊断、突变分析和肿瘤相关基因的筛查等许多方面。
2、基本原理2.1变性梯度凝胶电泳由Fisher和Izrman口3于1983年创立,以后该技术和PCR技术相结合被广泛应用于各种突变分析。
它主要是利用梯度变性胶来分离DNA片段。
电泳开始时,DNA在胶中的迁移速率仅与分子太小有关,而一旦DNA泳动到某一点时,即到达该DNA变性浓度位置时,使得DNA双链开始分开,从而大大降低了迁移速率。
变性梯度凝胶电泳(DGGE)和温度梯度凝胶电泳(TGGE)变性梯度凝胶电泳(DGGE)产品说明DGGE变性梯度凝胶电泳系统包括内置式温度控制系统、可编程控电源、梯度凝胶生成器、内置式缓冲液循环泵及搅拌桨、电泳槽、梯度生成器、制胶配件及玻璃板等。
DGGE介绍:变性梯度凝胶电泳法(denaturing gradient gel electrophoresis,DGGE)分析PCR产物,如果突变发生在最先解链的DNA区域,检出率可达100%,检测片段可达1kb,最适围为100bp-500bp。
基本原理基于当双链DNA 在变性梯度凝胶中进行到与DNA变性温度一致的凝胶位置时,DNA发生部分解链,电泳迁移率下降,当解链的DNA链中有一个碱基改变时,会在不同的时间发生解链,因影响电泳速度变化的程度而被分离。
由于变性梯度凝胶电泳法是利用温度和梯度凝胶迁移率来检测,需要一套专用的电泳装置,合成的PCR引物最好在5`末端加一段40bp-50bp的GC夹,以利于检测发生于高熔点区的突变。
DGGE原理:变性梯度凝胶电泳系统(denaturing gradient gel electrophoresis, DGGE)的原理是使用一对特异性引物,PCR扩增微生物自然群体的16s rRNA基因,产生长度相同但序列有异的DNA片段的混合物。
然后用变性梯度凝胶电泳分离产物混合物。
变性梯度凝胶电泳DGGE胶是在6%聚丙烯酰胺胶中添加线性梯度的变性剂,变性剂的浓度由上到下,从低到高成线性梯度。
在一定温度下,在同一浓度的变性剂浓度下,序列不同的产物,其部分解链程度也不同,而产物解链程度又直接影响其电泳迁移率,结果不同的产物在凝胶上分离开来。
在引物的5’端加上40个碱基左右的G-C串可使变性梯度凝胶电泳DGGE对序列差异的分辨率提高到近100%。
所以变性梯度凝胶电泳法可用于微生物群落结构的研究、微生物种群动态的分析、富集培养物及分离物的分析、核糖体RNA同源性的分析。
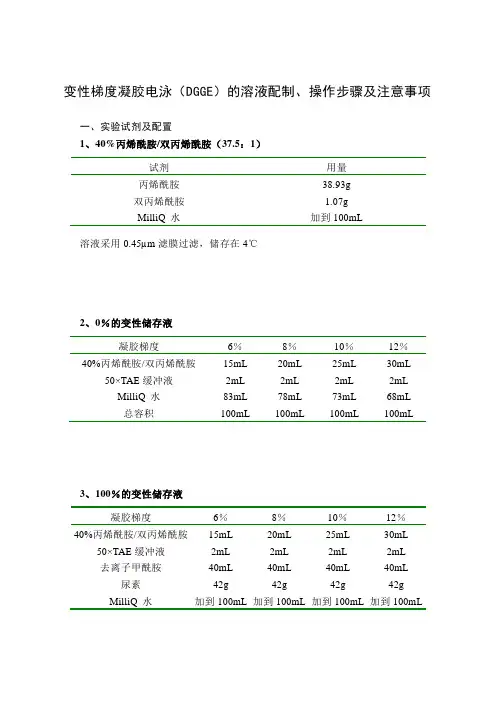
变性梯度凝胶电泳(DGGE)的溶液配制、操作步骤及注意事项一、实验试剂及配置1、40%丙烯酰胺/双丙烯酰胺(37.5:1)试剂用量丙烯酰胺38.93g双丙烯酰胺 1.07gMilliQ 水加到100mL 溶液采用0.45µm滤膜过滤,储存在4℃2、0%的变性储存液凝胶梯度6%8%10%12%40%丙烯酰胺/双丙烯酰胺15mL 20mL 25mL 30mL 50×TAE缓冲液2mL 2mL 2mL 2mL MilliQ 水83mL 78mL 73mL 68mL总容积100mL 100mL 100mL 100mL3、100%的变性储存液凝胶梯度6%8%10%12%40%丙烯酰胺/双丙烯酰胺15mL 20mL 25mL 30mL 50×TAE缓冲液2mL 2mL 2mL 2mL去离子甲酰胺40mL 40mL 40mL 40mL 尿素42g 42g 42g 42g MilliQ 水加到100mL 加到100mL 加到100mL 加到100mL4、50×TAE缓冲液试剂用量终浓度Tris碱242.0g 2M冰乙酸57.1 1M 0.5M EDTA,pH8.0 100.0mL 50mM MilliQ 水加到1000.0mL将溶液混合溶解,121℃下蒸汽灭菌20-30min,储存在室温5、银染液的配制:原液:8×固定液(250 ml):乙醇200 ml冰乙酸10mlMilliQ 水40ml(A):1×固定液(400 ml):8×固定液50mlMilliQ 水350ml(B)银染溶液(400ml):AgNO3 0.8 g8×固定液50mlMilliQ 水350ml(C):显影剂(500ml):NaOH 7.5gMilliQ 水500 ml甲醛 1.5ml6、10%过硫酸铵(AP):过硫酸胺0.3g超纯水 3.0ml溶解后使用0.45µm微孔滤膜过滤,4℃保存,保存时间为1周。
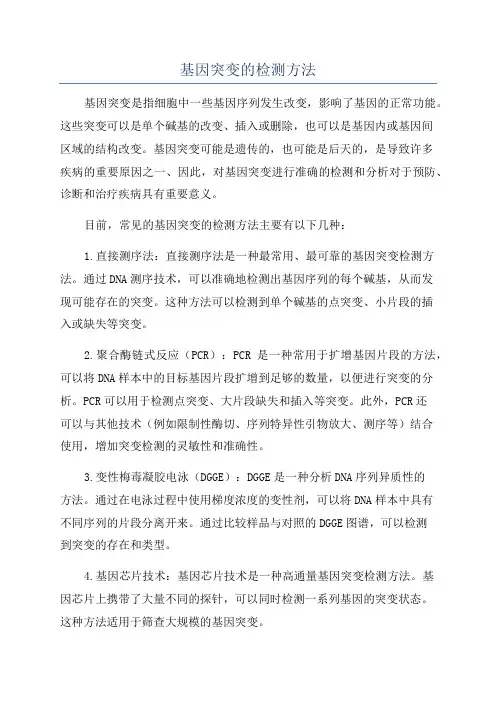
基因突变的检测方法基因突变是指细胞中一些基因序列发生改变,影响了基因的正常功能。
这些突变可以是单个碱基的改变、插入或删除,也可以是基因内或基因间区域的结构改变。
基因突变可能是遗传的,也可能是后天的,是导致许多疾病的重要原因之一、因此,对基因突变进行准确的检测和分析对于预防、诊断和治疗疾病具有重要意义。
目前,常见的基因突变的检测方法主要有以下几种:1.直接测序法:直接测序法是一种最常用、最可靠的基因突变检测方法。
通过DNA测序技术,可以准确地检测出基因序列的每个碱基,从而发现可能存在的突变。
这种方法可以检测到单个碱基的点突变、小片段的插入或缺失等突变。
2.聚合酶链式反应(PCR):PCR是一种常用于扩增基因片段的方法,可以将DNA样本中的目标基因片段扩增到足够的数量,以便进行突变的分析。
PCR可以用于检测点突变、大片段缺失和插入等突变。
此外,PCR还可以与其他技术(例如限制性酶切、序列特异性引物放大、测序等)结合使用,增加突变检测的灵敏性和准确性。
3.变性梅毒凝胶电泳(DGGE):DGGE是一种分析DNA序列异质性的方法。
通过在电泳过程中使用梯度浓度的变性剂,可以将DNA样本中具有不同序列的片段分离开来。
通过比较样品与对照的DGGE图谱,可以检测到突变的存在和类型。
4.基因芯片技术:基因芯片技术是一种高通量基因突变检测方法。
基因芯片上携带了大量不同的探针,可以同时检测一系列基因的突变状态。
这种方法适用于筛查大规模的基因突变。
5.网络测序技术:网络测序技术是一种新兴的基因突变检测方法。
通过将DNA样本测序后上传至云端服务器,利用高效的计算机算法和庞大的数据库,可以分析和鉴定样本中的突变。
这种方法可以快速准确地检测大规模基因突变,适用于临床中的个性化医疗。
虽然以上列举了几种常见的基因突变检测方法,但需要注意的是,每种方法都有其优缺点,并且适用于不同类型的突变鉴定。
在实际应用中,常常需要结合多种方法进行综合分析和鉴定,以提高突变检测的准确性和可靠性。
PCR-DGGE技术一、实验原理变性梯度凝胶电泳(denatured gradient gel electrophoresis,DGGE)最早是Lerman 等人于20 世纪80 年代初期发明的,起初主要用来检测DNA 片段中的点突变。
Muyzer 等人在1993 年首次将其应用于微生物群落结构研究。
后来又发展出其衍生技术,温度梯度凝胶电泳(TGGE)。
该技术被广泛用于微生物分子生态学研究的各个领域,目前已经发展成为研究微生物群落结构的主要分子生物学方法之一。
双链DNA分子在一般的聚丙烯酰胺凝胶电泳时,其迁移行为取决于其分子大小和电荷。
不同长度的DNA片段能够被区分开,但同样长度的DNA片段在胶中的迁移行为一样,因此不能被区分。
DGGE技术在一般的聚丙烯酰胺凝胶基础上,加入了变性剂(尿素和甲酰胺)梯度,从而能够把同样长度但序列不同的DNA片段区分开来。
一个特定的DNA片段有其特有的序列组成,其序列组成决定了其解链区域和解链行为。
一个几百个碱基对的DNA片段一般有几个解链区域,每个解链区域有一段连续的碱基组成。
当变性剂浓度逐渐增加达到其最低的解链区浓度时,该区域这一段连续的碱基对发生解链。
当变性剂那浓度再升高依次达到其他解链区域浓度后,最高的解链区域也发生解链,从而双链DNA完全解链。
不同的双链DNA片段因为其序列组成不一样,所以其解链区域和解链区域的解链浓度也是不一样的。
当进行DGGE电泳时,一开始变性剂浓度比较小,不能使双链DNA片段最低的解链区域解链,此时DNA片段的迁移行为和在一般的聚丙烯酰胺凝胶中一样。
然而一旦DNA片段迁移到一特定位置,其变性剂浓度刚好能使双链DNA片段最低的解链区域解链时,双链DNA片段最低的解链区域立即发生解链。
部分解链的DNA片段在胶中的迁移速率会急剧下降。
因此同样长度但序列不同的DNA片段会在胶中不同位置处达到各自最低解链区域的解链变性剂浓度,因此它们会在胶中不同的位置分开。
变性梯度凝胶电泳DGGE刘琳 1131428 环境科学一、 实验目的1. 学习掌握变性梯度凝胶电泳的原理和方法。
2. 练习变性梯度凝胶电泳的操作步骤。
3. 分析并掌握变性梯度凝胶电泳的思路,并了解其在微生物群落研究中的地位。
二、 实验原理双链DNA 分子在一般的聚丙烯酰胺凝胶电泳时,其迁移行为决定于其分子大小和电荷。
不同长度的DNA 片段能够被区分开,但同样长度的DNA 片段在凝胶中的迁移行为一样,因此不能被区分。
DGGE 技术在一般的聚丙烯酰胺凝胶基础上,加入了变性剂(尿素和甲酰胺)梯度,从而能够把同样长度但序列不同的DNA 片段区分开来。
不同的双链DNA 片段因为其序列组成不一样,所以其解链区域及各解链区域的解链温度也是不一样的。
同样长度但序列不同的DNA 片段会在胶中不同位置处达到各自最低解链区域的解链温度,因此它们会在胶中的不同位置处发生部分解链导致迁移速率大大下降,从而在胶中被区分开来。
然而,一旦温度(或变性剂浓度)达到DNA 片段最高的解链区域温度时,DNA 片段会完全解链,成为单链DNA分子,此时它们又能在胶中继续迁移。
因此,如果不同DNA 片段的序列差异发生在最高的解链区域时,这些片段就不能被区分开来。
DNA 片段在DGGE 胶中的迁移行为(如下图):变性剂LowHigh在DNA 片段的一端加入一段富含GC 的DNA 片段(一般30-50个碱基对),使DNA 片段最高的解链区域在GC 夹子这一段序列处,它的解链温度很高,可以防止DNA 片段在DGGE/TGGE 胶中完全解链。
当加了GC 夹子后,DNA 片段中基本上每个碱基处的序列差异都能被区分开(Myers, 1985)。
DGGE 有两种电泳形式:垂直电泳和水平电泳。
垂直电泳是为了确定变性剂梯度;而水平电泳则是对比分析不同样品的微生物差异。
本次试验做的是水平电泳,主要对比分析不同样品的微生物差异。
三、 实验器材与药剂器材:DGGE system (D-Code, Bio-Rad)、移液管、移液枪、枪头、制胶设备、30ml 针筒、聚乙烯细管、电泳仪试剂:16s rDNA V3区PCR 扩增产物、胶浓度为8%变性剂浓度分别为0%和90%丙烯酰胺胶、50×TAE buffer、去离子甲酰胺、尿素、去离子水、10%过硫酸铵(Aps)、TEMED 、sDNA 染料 变性剂Low high四、实验步骤1.首先按照实验要求将50x TAE buffer稀释为1×TAE buffer,并利用90%和0%的变性胶分别配置15.5ml的35%和55%的变性胶溶液。
PCR-DGGE技术一、实验原理变性梯度凝胶电泳(denatured gradient gel electrophoresis,DGGE)最早是Lerman 等人于20 世纪80 年代初期发明的,起初主要用来检测DNA 片段中的点突变。
Muyzer 等人在1993 年首次将其应用于微生物群落结构研究。
后来又发展出其衍生技术,温度梯度凝胶电泳(TGGE)。
该技术被广泛用于微生物分子生态学研究的各个领域,目前已经发展成为研究微生物群落结构的主要分子生物学方法之一。
双链DNA分子在一般的聚丙烯酰胺凝胶电泳时,其迁移行为取决于其分子大小和电荷。
不同长度的DNA片段能够被区分开,但同样长度的DNA片段在胶中的迁移行为一样,因此不能被区分。
DGGE技术在一般的聚丙烯酰胺凝胶基础上,加入了变性剂(尿素和甲酰胺)梯度,从而能够把同样长度但序列不同的DNA片段区分开来。
一个特定的DNA片段有其特有的序列组成,其序列组成决定了其解链区域和解链行为。
一个几百个碱基对的DNA片段一般有几个解链区域,每个解链区域有一段连续的碱基组成。
当变性剂浓度逐渐增加达到其最低的解链区浓度时,该区域这一段连续的碱基对发生解链。
当变性剂那浓度再升高依次达到其他解链区域浓度后,最高的解链区域也发生解链,从而双链DNA完全解链。
不同的双链DNA片段因为其序列组成不一样,所以其解链区域和解链区域的解链浓度也是不一样的。
当进行DGGE电泳时,一开始变性剂浓度比较小,不能使双链DNA 片段最低的解链区域解链,此时DNA片段的迁移行为和在一般的聚丙烯酰胺凝胶中一样。
然而一旦DNA片段迁移到一特定位置,其变性剂浓度刚好能使双链DNA片段最低的解链区域解链时,双链DNA片段最低的解链区域立即发生解链。
部分解链的DNA 片段在胶中的迁移速率会急剧下降。
因此同样长度但序列不同的DNA片段会在胶中不同位置处达到各自最低解链区域的解链变性剂浓度,因此它们会在胶中不同的位置分开。
一大类是以单链构象多态性(SSCP) 、变性梯度凝胶电泳(DDGE) 、酶切扩增多态性序列(CAPS) 、等位基因特异性PCR (allele-specific PCR,AS-PCR)等为代表的以凝胶电泳为基础的传统经典的检测方法另一大类是以直接测序DNA芯片变性、高效液相色谱(DHPLC)、质谱检测技术高分辨率溶解曲线(HRM)等为代表的高通量自动化程度较高的检测方法。
1.单链构象多态性(SSCP)方法的原理是PCR扩增的DNA片段在变性剂条件下,通过高温处理使双链DNA扩增片段解旋并且维持单链状态,进一步进行非变性聚丙烯酰胺凝胶电泳。
由于DNA单链的空间构象决定着其迁移率,相同长度的DNA单链,若某单个碱基存在差异,则形成迥然不同的空间构象,就会显示出带型的差异(多态型) 。
优点:该方法简便灵敏快速成本低缺点:PCR-SSCP适用于小的DNA片段,长度小于500 bp,如果DNA片段太长,DNA单链很难形成稳定发夹结构。
但是该方法只能对突变进行较为粗略地检测,不能确定突变的具体位置和类型;而且对电泳条件的要求非常严格。
2.变性梯度凝胶电泳(DDGE)在DNA序列中,4种碱基的组成和排列存在差异,致使不同序列的DNA双链有着不同的解旋温度当DNA分子在含浓度梯度变性剂的聚丙烯酰胺凝胶中进行电泳时,由于解旋的状况与其序列高度相关,使得不同DNA片段形成相互分开的条带。
DGGE利用双链DNA分子在含有一定浓度梯度变性剂的凝胶中进行电泳时,由于存在突变的双链DNA分子和不存在突变的双链DNA分子在不同的部位解旋而区分即使只有一个碱基对的不同,两个双链DNA分子在不同的时间发生部分解旋,随之形成有差异的电泳条带。
由于存在突变DNA片段和正常DNA 片段的Tm值有差异,从而发生迥然不同的解旋行为,TGGE通过设置温度梯度在聚丙烯酰胺凝胶电泳中分离DNA差异片段。
优点:DGGE能够检测长达1 kb的DNA片段,若SNP恰好出现在发生部分解旋的DNA区域内,其检出率可以高达100%,特别是100~500 bp长度的片段。
DGGE目录DGGE的基本原理DGGE的特点DGGE主要步骤DGGE的基本原理DGGE的特点DGGE主要步骤展开简介DGGE(denaturing gradient gel electrophoresis),即变性梯度凝胶电泳,是根据DNA在不同浓度的变性剂中解链行为的不同而导致电泳迁移率发生变化,从而将片段大小相同而碱基组成不同的DNA片段分开。
具体而言,就是将特定的双链DNA片段在含有从低到高的线性变性剂梯度的聚丙烯酰胺凝胶中电泳,随着电泳的进行,DNA片段向高浓度变性剂方向迁移,当它到达其变性要求的最低浓度变性剂处,双链DNA形成部分解链状态,这就导致其迁移速率变慢,由于这种变性具有序列特异性,因此DGGE能将同样大小的DNA片段很理想地分开,它是一种很有用分子标记方法。
现已广泛应用于生物多样性调查、亲缘关系鉴定、基因突变检测等多个领域。
DNA螺旋[1]DGGE的基本原理DGGE(denaturing gradient gel electrophoresis变性梯度凝胶电泳)不是将分子量不同的DNA分开,而是通过聚丙烯酰胺凝胶中变性剂浓度梯度的不同,将序列不同的DNA分开。
该方法的原理是根据DNA 的解链特性,不同碱基组成的DNA双螺旋发生变性所要求的变性剂浓度不同,混合双链DNA 在变性剂浓度呈线性梯度增加的聚丙烯酰胺凝胶电泳时,当泳动到与DNA变性所需变性剂浓度一致的凝胶位置时,相对应的DNA发生解链变性,导致电泳迁移速率降低。
由于泳动受阻DNA分子在凝胶中的停留位置不同,从而使不同DNA分子得以分离。
根据变性剂梯度方向的不同, DGGE可分为:垂直DGGE,即变性剂梯度与电场方向垂直,常用于试验决定分离型、野生型和变异型的最佳变性剂梯度范围;平行DGGE,其变性剂的梯度和电场方向平行,主要用于解链范围明确的DNA片段的检测。
DGGE的特点DGGE/TGGE已广泛用于分析自然环境中细菌、蓝细菌, 古菌、微型真核生物、真核生物和病毒群落的生物多样性。
变性梯度凝胶电泳(DGGE)实验
【实验目的】
掌握变性梯度凝胶电泳检测新的突变,以及测定高度多态基因的基因型的技术方法。
【实验原理】
在现代遗传学中DNA 序列突变的分析占有十分重要的地位。
由于在较大DNA 序列中检测一个细微的突变非常困难,因而现在人们建立了几种方法来解决这一难题。
变性梯度凝胶电泳(DGGE)能把长度相同而核苷酸顺序不同的双链DNA 片段分开。
这种方法利用了DNA 分子从双螺旋型变成局部变性型时电泳迁移率会下降的现象。
不同的DNA 片段发生这种变化所需梯度不同。
DGGE 的凝胶中沿电场方向变性剂(甲醛和尿素)含量递增,当DNA 片段通过这种变性剂递增的凝胶时,不同分子的电泳迁移率在不同区域会发生降低。
这就可使核苷酸顺序不同DNA 片段分开。
此方法可作为测序的初始步骤在杂合个体中分离等位基因。
许多研究表明变性递度凝胶电泳分离能力很强,它可以把相差仅1bp 的DNA 片段分开。
【仪器、材料与试剂】
1.50×TAE 缓冲液(2mol/LTris 乙酸盐,0.05mol/L EDTA pH8.0)1L 体积:242gTris碱,57.1mL 冰醋酸,100mL 0.5mol/L EDTA pH8.0,加水至lL。
2.丙烯酰胺贮存液:40%丙烯酰胺(38:2 丙烯酰胺:双丙烯酰胺)。
3.过硫酸铵贮存液(10%):10mL 配制:1g 过硫酸铵加水至10mL。
TEMED(N,N,N',N',—四甲基乙二胺)。
4.变性剂贮存液:(0%)6%丙烯酰胺TAE 溶液。
250mL 溶液:37.5mL 丙烯酰胺贮存液,5mL50×TAE 缓冲液,加水至250mL,过滤和排气。
5.变性剂贮存液(100%):6%丙烯酰胺,7mol/L 尿素,40%甲醛TAE 溶液。
250mL配制:37.5mL 丙烯酰胺贮存液,5mL50×TAE 缓冲液,105g 尿素,100mL 甲醛,加水至250mL,过滤并排气。
6.染料:40%(W/V)蔗糖,0.25%溴酚蓝,0.25%二甲苯青和30%甘油。
7.塑料胶框、梳子和垫片,两个用于固定胶框中玻璃片的塑料支架。
8.一有柄和一无柄的两片玻璃板(尺寸:17.78cm 宽×20.32cm 长×0.635cm 厚),有柄的玻璃板有一个13.97cm 宽,2.54cm 厚的突出。
9.无金属结构的塑料槽(尺寸:43.18cm 长×22.86cm 宽×22.86cm 深;可以允许一块或两块胶同时电泳)。
10.电源、阳极—铂制;阴极—石墨棒(直径0.635cm)。
11.蠕动泵及连接管、搅拌器和加热器、梯度生成器:每侧容积15~25mL。
【实验步骤】
1.制备平行胶:平行胶中从上至下变性剂的浓度递增。
这种胶适用于分析大量样品。
1)与制备标准聚丙烯胺凝胶一样制备胶板。
2)从丙烯酰胺和两种变性剂贮存液中取两份等体积溶液以符合要求的变性剂浓度范围。
溶液的总体积一般为刚好覆盖胶板。
丙烯酰胺的浓度取决于DNA 片段的大小,对于DNA 片段大小为≥300bp 的丙烯酰胺的浓度为6%,而长度<300bp 的DNA 片段,丙烯酰胺的浓度为12%。
3)加高浓度变性剂溶液到梯度生成器右槽中(该溶液将首先通过梯度合成器进入胶板间的空隙),打开连接梯度生成器两端的开关,让一些溶液流入左槽内关上开关,用吸管把它们移回到右槽(目的是确保两槽之间无气泡的阻隔)。
然后把低浓度变性剂溶液加到梯度生成器左槽中。
4)搅拌这两个槽中溶液的同时向其中加入4.5μL/mLl0%的过硫酸铵和1μL/mL 的TEMED(N,N,N',N',—四甲基乙二胺)。
5)轻轻打开两槽之间的开关及梯度生成器出口的开关,灌胶时两槽内的溶液应处于搅拌状态(尤其高浓度溶液槽更应搅拌),溶液受重力影响通过一个放在两块玻璃板之间的顶部的细塑料管流过梯度生成器。
流速应保持一定大小以保证溶液在凝聚之前所有溶液都应注入到两层玻璃板之间。
(凝聚速度可通过调整过硫酸铵和TEMED 的浓度来调节)。
6)胶板充满后,在其顶部插入梳子并将其放平,凝聚至少30min。
(胶可事先灌好并于4℃贮存几天)。
2.制备垂直胶:垂直胶含有丙烯酰胺的浓度是固定的,垂直于电泳方向有一个线性递增的变性剂梯度。
这种胶适用于确定分离含有核苷酸改变的DNA 片段的最佳梯度范围。
垂直胶的制备大体相似和平行胶的制备,但也有所不同:
1)像标准的聚丙烯酰胺凝胶一样制备胶板,但其顶部不插入梳子。
2)准备一块比梳子稍短的涂上润滑剂的间隔片插在梳子的位置,位置稍突出一些,这样左边就留下一个缺口。
用夹子夹紧这一边。
把胶板旋转90°这样和缺口相连的这一面就转到最上面了。
胶液将通过该缺口进
入两玻璃板之间。
如前所述的方法灌胶。
3)胶完全凝固之后,将胶板垂直立起,轻轻移出胶顶部的间隔片。
胶的顶部就会出现大而平的孔,这样就可以进行电泳了。
3.DNA 电泳:(平行或垂直DGGE 的步骤是相同的)
1)移去顶部间隔片或梳子之后,将相关设备和胶移至含有加热到60℃的缓冲液的电泳槽内,使缓冲液高度刚刚没过胶上的加样孔。
2)连上蠕动泵以使缓冲液能从槽内流至顶部槽内(阴极)。
之后缓冲液漫过框架边缘的小孔重新流回槽内(顶槽缓冲液循环是必须的,目的是避免电泳过程中pH 值的显著增加和离子强度的改变)。
3)对垂直胶电泳来说,向胶顶部的加样孔中加入100μL PCR 产品(其中包括20μL的上样染料);而对于平行胶电泳来说,每个加样孔中加入15~20μL 样品。
4)按照凝胶宽度在顶槽内放置石墨电极,并根据片段的大小在150~350V 电压下电泳3~15h。
在平行胶上,250V、电泳5h 可使300bp 的片段移到凝胶的1/3 处。
5)0.5μg/mL 溴化乙锭中进行染色并观察。
【注意事项】
1.在混合和灌胶时应避免产生气泡。
2.有时聚丙烯酰胺凝胶的左侧会出现缩水现象以致在胶的顶部到底部之间会产生空气通道,可用2%熔化的琼脂糖凝胶将其充满。
3.所有溶液应保存于4℃棕色瓶中,一般几个月到一年内有效。
4.电泳时凝胶温度必须保持恒定,要达到这一要求,可把胶板浸没于充分搅拌的温控缓冲液槽内。
对于缺乏变性剂时比较容易变性的DNA 来说,槽内的温度选择在60℃稍微超过熔点,并且大部分的工作都在60℃下进行(但温度稍高或低一点都可采用)。
温度保持恒定可将电泳缓冲液加热到60℃,并把胶浸入其中进行电泳即可。