广陆数测:2010年第三季度报告全文 2010-10-29
- 格式:pdf
- 大小:186.02 KB
- 文档页数:11
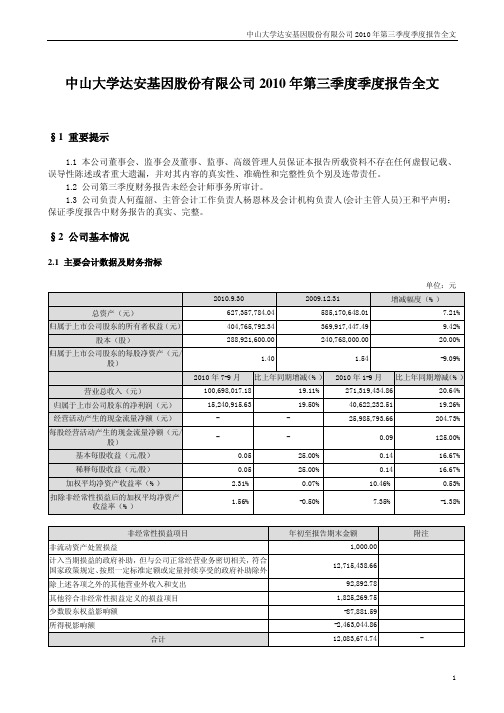
中山大学达安基因股份有限公司2010年第三季度季度报告全文§1 重要提示1.1 本公司董事会、监事会及董事、监事、高级管理人员保证本报告所载资料不存在任何虚假记载、误导性陈述或者重大遗漏,并对其内容的真实性、准确性和完整性负个别及连带责任。
1.2 公司第三季度财务报告未经会计师事务所审计。
1.3 公司负责人何蕴韶、主管会计工作负责人杨恩林及会计机构负责人(会计主管人员)王和平声明:保证季度报告中财务报告的真实、完整。
§2 公司基本情况2.1 主要会计数据及财务指标单位:元2010.9.30 2009.12.31 增减幅度(%)总资产(元)627,357,784.04 585,170,648.01 7.21% 归属于上市公司股东的所有者权益(元)404,765,792.34 369,917,447.49 9.42% 股本(股)288,921,600.00 240,768,000.00 20.00% 归属于上市公司股东的每股净资产(元/1.40 1.54 -9.09%股)2010年7-9月比上年同期增减(%)2010年1-9月比上年同期增减(%)营业总收入(元)100,698,017.18 19.11% 271,319,434.86 20.64% 归属于上市公司股东的净利润(元)15,240,915.63 19.50% 40,622,232.51 19.26% 经营活动产生的现金流量净额(元)- - 25,985,793.66 204.73%每股经营活动产生的现金流量净额(元/- - 0.09 125.00% 股)基本每股收益(元/股)0.05 25.00% 0.14 16.67% 稀释每股收益(元/股)0.05 25.00% 0.14 16.67% 加权平均净资产收益率(%) 2.31% 0.07% 10.46% 0.53%扣除非经常性损益后的加权平均净资产1.56% -0.50% 7.35% -1.38%收益率(%)非经常性损益项目年初至报告期末金额附注非流动资产处置损益1,000.00计入当期损益的政府补助,但与公司正常经营业务密切相关,符合12,715,438.66国家政策规定、按照一定标准定额或定量持续享受的政府补助除外除上述各项之外的其他营业外收入和支出92,892.78其他符合非经常性损益定义的损益项目1,825,269.75少数股东权益影响额-87,881.59所得税影响额-2,463,044.86合计12,083,674.74 -2.2 报告期末股东总人数及前十名无限售条件股东持股情况表单位:股报告期末股东总数(户)62,302前十名无限售条件流通股股东持股情况股东名称(全称)期末持有无限售条件流通股的数量种类广州中大控股有限公司55,384,320 人民币普通股广州生物工程中心43,338,240 人民币普通股红塔创新投资股份有限公司5,040,000 人民币普通股中国工商银行-易方达价值成长混合型证券4,209,141 人民币普通股投资基金全国社保基金一零九组合1,999,759 人民币普通股何蕴韶1,748,736 人民币普通股中国建设银行-中小企业板交易型开放式指1,599,273 人民币普通股数基金中融国际信托有限公司-慧安5号1,426,249 人民币普通股程钢1,340,064 人民币普通股中融国际信托有限公司-慧安1号1,318,218 人民币普通股注:何蕴韶为公司董事长,共持有公司股份6,994,944股,其中:高管锁定股为5,246,208股,无限售条件流通股为1,748,736股。

2010年第三季度国际经济观察2010-10-252010年三季度,各发达国家经济有复苏迹象。
但发达经济体虽然走上了经济复苏的道路,但未来经济仍面临许多不确定因素,确保金融稳定、继续巩固财政状况仍是各国下一季度经济工作的重点。
一、经济出现复苏迹象,未来前景仍需观察1.美国经济温和复苏随着2009年全球的V字反弹的结束,今年以来,美国的经济增速明显放缓。
三季度美国GDP增长2%,比二季度提升0.3个百分点,呈温和复苏态势。
其中,私人投资和政府投资仍然呈下滑态势;消费方面,消费者支出微幅上升,但消费者信心依然不高,消费者对价格依旧敏感,消费限于必需品;商品与服务的出口也继续下滑,但下降幅度在缩小。
图1:美国2007年以来GDP季度环比增长率单位:%资料来源:国研网国研数据图2:美国消费信贷指数单位:%资料来源:国研网国研数据8月份工业生产指数小幅回落至93.2,工业生产同比增速继续下滑,工业部门扩张力度放缓。
制造业PMI连续第四个月的下滑,但非制造业PMI回升,服务业表现较制造业为佳。
美国产能利用率依然不高,目前仅为危机前水平的85%左右。
订单方面,耐用品订单下滑幅度超过全部工业品订单的降幅,耐用品工业生产未来依然低迷,工业增速在此影响下将继续回落。
图3:美国GDP、消费、投资和出口折年率季度同比增长单位:%资料来源:国研网国研数据从产能利用率来看,相较于二季度,三季度美国各月的产能利用率有所提高,但与1972-2009年的均值相比较,仍有较大差距,说明美国经济仍未完全复苏。
图4:2010年美国产能利用率对比资料来源:国研网国研数据尽管美国三季度经济增长数据好过预期,但市场仍然担心,经济复苏能否得以延续。
根据美国劳工部公布的最新数据显示,2010年9月,美国失业率仍然维持在9.6%的高位,9月份政府部门总就业人数减少159,000人,降幅最大。
这其中不仅包括联邦政府解雇的77,000名人口普查员,还包括州及地方政府因预算压力而裁减的76,000名雇员。

中国货币政策执行报告二○一○年第三季度中国人民银行货币政策分析小组2010年11月2日内容摘要2010年第三季度,中国经济继续朝着宏观调控的预期方向发展,经济平稳较快发展的势头进一步巩固。
消费平稳较快增长,投资结构有所改善,对外贸易继续恢复,消费、投资、出口拉动经济增长的协调性增强;农业生产稳定发展,工业产销衔接状况良好,居民消费价格继续上涨。
前三季度,实现国内生产总值(GDP)26.9万亿元,同比增长10.6%,第三季度同比增长9.6%;居民消费价格指数(CPI)同比上涨2.9%,第三季度同比上涨3.5%。
中国人民银行按照国务院统一部署,继续实施适度宽松的货币政策,并着力提高政策的针对性、灵活性和有效性,加强银行体系流动性管理,适时上调存贷款基准利率,引导金融机构合理把握信贷投放总量、节奏和结构,继续稳步推进金融企业改革,进一步推进人民币汇率形成机制改革,改进外汇管理,促进经济金融平稳健康发展。
总体看,金融运行平稳,人民币汇率弹性增强,9月末货币信贷增速有所反弹。
2010年9月末,广义货币供应量M2余额为69.6万亿元,同比增长19.0%,增速比6月末高0.5个百分点。
狭义货币供应量M1余额为24.4万亿元,同比增长20.9%,增速比6月末低3.7个百分点。
金融机构存款增长较快,9月末,全部金融机构本外币各项存款同比增长19.8%,增速比6月末高1.2个百分点。
金融机构人民币贷款增速稳中趋升。
9月末,人民币贷款余额同比增长18.5%,增速比6月末高0.3个百分点,比年初增加6.3万亿元,同比少增2.4万亿元。
金融机构贷款利率继续小幅上升,9月份非金融性企业及其他部门贷款加权平均利率为5.59%,比6月份上升0.02个百分点。
9月末,人民币对美元汇率中间价为6.7011元,比2010年6月19日升值1.89%,比2009年年末升值1.90%。
下一阶段,国民经济有望继续保持平稳较快增长的态势。
全球经济已步出金融危机的最坏阶段,整体仍将延续缓慢复苏的态势。

中国联合网络通信股份有限公司6000502010年第三季度报告目录§1 重要提示 (2)§2 公司基本情况................................................ . (2)§3 经营情况 (3)§4 重要事项 (4)§5 附录 (8)§1 重要提示1.1 本公司董事会、监事会及其董事、监事、高级管理人员保证本报告所载资料不存在任何虚假记载、误导性陈述或者重大遗漏,并对其内容的真实性、准确性和完整性承担个别及连带责任。
1.2会议应到董事8名,实际出席6名,其中董事陆益民先生因出差在外,不能亲自参加本次会议,委托董事长常小兵先生代为表决。
董事左迅生先生因出差在外,不能亲自参加本次会议,委托董事佟吉禄先生代为表决。
1.3 公司第三季度财务报告未经审计。
1.4公司负责人姓名常小兵主管会计工作负责人姓名张健会计机构负责人(会计主管人员)姓名赵玉军公司负责人常小兵、主管会计工作负责人张健及会计机构负责人(会计主管人员)赵玉军声明:保证本季度报告中财务报告的真实、完整。
§2 公司基本情况2.1 主要会计数据及财务指标币种:人民币本报告期末上年度期末本报告期末比上年度期末增减(%)总资产(元) 421,046,251,263 419,232,296,909 0.4 归属于上市公司股东权益(元) 70,640,900,663 70,983,885,838 -0.5 归属于上市公司股东的每股净资产(元/股) 3.33 3.35 -0.5年初至报告期期末比上年同期增减(%) 经营活动产生的现金流量净额(元) 60,459,657,694 28.1 每股经营活动产生的现金流量净额(元/股) 2.852 28.1报告期(7-9月)年初至报告期期末(1-9月)本报告期比上年同期增减(%)归属于上市公司股东的净利润(元) 238,144,384 1,066,635,789 -73.8 基本每股收益(元/股)0.011 0.050 -73.8 扣除非经常性损益后的基本每股收益(元/股)0.010 0.048 -69.1 稀释每股收益(元/股)0.011 0.050 -73.8 加权平均净资产收益率(%)0.33 1.49 减少0.96个百分点扣除非经常性损益后的加权平均净资产收益率(%)0.29 1.41 减少0.67个百分点扣除非经常性损益项目和金额:单位:元币种:人民币项目年初至报告期期末金额(1-9月)营业外收入和支出净额243,858,380 所得税影响额-73,349,473 少数股东权益影响额(税后)-112,733,272合计57,775,6352.2 报告期末股东总人数及前十名无限售条件股东持股情况表单位:股前十名无限售条件流通股股东持股情况股东名称(全称)期末持有无限售条件流通股的数量种类中国联合网络通信集团有限公司12,939,746,152 人民币普通股博时价值增长证券投资基金280,193,677 人民币普通股中国农业银行-富国天瑞强势地区精选混合型开放127,991,792 人民币普通股式证券投资基金中国建设银行-鹏华价值优势股票型证券投资基金108,872,494 人民币普通股中国建设银行-博时价值增长贰号证券投资基金106,761,634 人民币普通股中国工商银行-上证50交易型开放式指数证券投87,095,262 人民币普通股资基金交通银行-富国天益价值证券投资基金78,043,412 人民币普通股中国工商银行-诺安价值增长股票证券投资基金75,000,000 人民币普通股交通银行-易方达50指数证券投资基金68,003,939 人民币普通股中国工商银行-南方隆元产业主题股票型证券投资57,348,252 人民币普通股基金§3 经营情况2010年前三季度,本公司进一步加快业务发展,持续提升网络服务和支撑能力,移动业务实现持续更快增长,宽带业务继续保持高速增长,固话业务下滑得到较好控制,整体收入呈现良好增长态势。

证券代码(A/H):000063/763 证券简称(A/H):中兴通讯 公告编号:201086 债券代码:115003 债券简称:中兴债1ZTE中兴2010年第三季度报告正文中兴通讯股份有限公司ZTE CORPORATION本公告在境内和香港同步刊登。
本公告根据《深圳证券交易所股票上市规则》规定在境内刊登。
本公告乃依据《香港联合交易所有限公司证券上市规则》第13.09条的披露义务而公布。
§1 重要提示1.1中兴通讯股份有限公司(以下简称“本公司”)董事会、监事会及董事、监事、高级管理人员保证本报告所载资料不存在任何虚假记载、误导性陈述或者重大遗漏,并对其内容的真实性、准确性和完整性承担个别及连带责任。
1.2 没有董事、监事、高级管理人员对本季度报告内容的真实性、准确性和完整性无法保证或存在异议。
1.3 本公司第五届董事会第十二次会议已审议通过本季度报告。
副董事长雷凡培先生因工作原因未能出席本次会议,已书面委托董事长侯为贵先生行使董事会会议表决权;副董事长谢伟良先生因工作原因未能出席本次会议,已书面委托董事董联波先生行使董事会会议表决权;董事殷一民先生因工作原因未能出席本次会议,已书面委托董事史立荣先生行使董事会会议表决权;独立董事陈乃蔚先生因工作原因未能出席本次会议,已书面委托独立董事魏炜先生行使董事会会议表决权。
1.4本季度报告中的财务报表未经审计。
本季度报告所载的财务资料乃根据中国企业会计准则编制。
1.5本公司董事长侯为贵先生、财务总监韦在胜先生和会计机构负责人石春茂先生声明:保证本季度报告中财务报告真实、完整。
§2 公司基本情况2.1本集团(即“本公司及其附属公司”)报告期内经营活动总体状况的简要分析2010年1-9月,国内市场方面,光纤宽带网络建设大规模开展,但运营商在移动网络投资上保持谨慎,本集团积极配合运营商各类网络建设需求,继续巩固自身市场份额,同时深化研发,不断探索新的市场机会;国际市场方面,全球电信设备投资开始恢复增长,但印度、欧盟等地区的贸易政策变化对设备商的收入产生了一定的影响,本集团发挥优势,聚焦于客户需求,继续保持销售稳步增长。
Shenzhen SEG Co., Ltd.The Third Quarterly Report for 2010(Full-Text)§1. Important Notes1.1 Board of Directors and the Supervisory Committee of Shenzhen SEG Co., Ltd., its directors, supervisors and senior executives hereby confirm that there are no any fictitious statements, misleading statements, or important omissions carried in this report, and shall take all responsibilities, individual and/or joint, for the reality, accuracy and completion of the whole contents.1.2 All the directors presented the board meeting on discussing the Third Quarterly Report except for the following director(s).Name of absent directors Posts of absentdirectorsReasons for absencefrom the meetingName of entrusteeWang Chu President Business Engagement Zhang Guangliu Jiang Yigang Independent Director Business Engagement Zhou Hanjun1.3 The Third Quarterly Financial Report of 2010 has not been audited by CPAs.1.4 Wang Chu, Person in Charge of the Company; Li Lifu, Person in Charge of Accounting Work; Ying Huadong, Person in Charge of Accounting Organization (Accounting Principal) hereby confirm that the Financial Report of the Third Quarterly Report is true and complete.§2. Company Profile2.1 Main accounting data and financial indexes:Unit: RMB Yuan2010.9.30 2009.12.31 Increase/decrease scope(%)Total assets (Yuan) 1,424,810,070.951,359,490,387.43 4.80% Owners’ equities attributable to theshareholders of listed company(Yuan)1,062,529,316.841,015,659,488.47 4.61% Share capital (Share) 784,799,010.00784,799,010.00 0.00% Net assets per share attributable tothe shareholders of listed company(Yuan/Share)1.35 1.29 4.65%July-Sep. 2010 Increase/decreaseover the sameperiod of the lastyear (%)Jan.-Sep. 2010Increase/decreaseover the sameperiod of the lastyear (%)Total operating income (Yuan) 103,795,650.7049.03%282,093,078.90 35.93% Net profit attributable to theshareholders of listed company(Yuan)9,066,771.9235,963,616.63Net cash flow arising from operatingactivities (Yuan) - -66,036,920.8522.90%Net cash flow arising from operating activities per share (Yuan/Share) - - 0.084120.21%Basic earnings per share(Yuan/Share)0.01150.0458Diluted earnings per share(Yuan/Share)0.01150.0458Weighted average return on equity(%)0.86% 3.79% 3.46% 18.23% Weighted average return on equityafter deducting non-recurring0.83% 5.55% 3.21% 24.11%gains/losses (%)Items of non-recurring gains and losses Amount from year begin tothe end of report periodRemarksGains/losses from the disposal of non-current assets 272,184.25Held transactional financial asset, gains/losses of changes offair values from transactional financial liabilities, andinvestment gains from disposal of transactional financialasset, transaction financial liabilities and financial assetavailable for sales, exclude the effective hedging businessrelevant with normal operations of the Company2,947,815.81Other non-operating income and expense excluded theaforementioned business189,232.54Impact amount on equity of minority shareholders -63,195.71Impact amount on income tax -736,128.12Total 2,609,908.77- 2.2 Total number of shareholders at the end of the report period and shares held by the topten shareholders with unrestricted sales conditionsUnit: ShareTotal numbers of shareholdersat the end of report period (shareholder)55,715Particulars about the shares held by the top ten shareholders with unrestricted sales conditionsFull name of shareholder Unrestricted sharesheld at period-endType of sharesShenzhen SEG Group Co., Ltd. 237,359,666RMB common share Yang Zhihui 25,148,818RMB common share Gguangzhou Fodak Enterprise Group Co., Ltd. 18,880,334RMB common share Taifook Securities Company Limited-Account Client 16,251,535Domestically listed foreign share China Merchants Securities Hong Kong Co., Ltd. 6,240,173Domestically listed foreign share Gong Qianhua 5,313,620Domestically listed foreign share Shanghai Hong Kong Wanguo Securities 4,835,828Domestically listed foreign share Guotai Jun’an Securities (Hong Kong) Limited 4,075,811Domestically listed foreign share Zhu Wei 4,066,739RMB common share Tang Lizhu 3,796,200RMB common share§3. Significant events3.1 Particulars about material changes in items of main accounting statement and financial index, and explanations of reasons√Applicable □InapplicableI. Items of balance sheetItem 30 September201031 December2009Balance Changerate%Account receivable 30,555,507.95 18,130,631.4012,424,876.55 68.53% Account paid in advance 25,662,349.19 18,404,268.087,258,081.11 39.44% Interest receivable 2,460,821.92-2,460,821.92 -100.00% Inventory 3,964,678.35 5,886,392.39-1,921,714.04 -32.65% Financial assets availablefor sales919,347.45 3,843,571.87-2,924,224.42 -76.08% Investment real estate 589,742,487.06 442,502,999.44147,239,487.62 33.27% Fixed assets 59,900,235.76 189,516,718.30-129,616,482.54 -68.39% Construction in progress 1,679,702.07 26,192,075.55-24,512,373.48 -93.59%Intangible assets 679,703.79 4,756,432.31-4,076,728.52 -85.71% Account payable 5,550,801.94 8,225,509.02-2,674,707.08 -32.52% Wages payable 1,426,221.82 4,261,476.99-2,835,255.17 -66.53% Tax payable 12,617,672.44 24,421,758.66-11,804,086.22 -48.33% Dividend payable 1,295,963.57 921,420.73374,542.84 40.65%1. Main reasons for the increase of account receivable: account receivable of self-operating and joint venture from “Buy-it” store increased.2. Main reasons for the increase of account paid in advance: account paid in advance of self-operating and joint venture from “Buy-it” store increased.3. Main reasons for the increase of interest receivable: bank deposit interest receivable of year-beginning has been received.4. Main reasons for decrease of inventory: in the report period, the inventory decreased by the operating mode transforming from self-operating to joint venture of the “Buy-it” store.5. Main reasons for the decrease of financial assets available for sale: in the report period, the Company sold 470,000 shares of Shenzhen Zero-Seven Co., Ltd. (hereinafter referred to as “ST Zero-Seven”) that reduced RMB 3.3041 million correspondingly.6. Main reasons for the increase of investment real estate: in the report period, the Changsha SEG Building under the name of Changsha SEG Development Co., Ltd. (hereinafter referred to as “Changsha SEG”) –controlled subsidiary of the Company, have been in operation. The Company transfers the item from fixed assets to investment real estate for calculation accordingly to the accounting standard.7. Main reasons for the decrease of fixed assets: in the report period, the Changsha SEG Building has been in operation. The Company transfers the item from fixed assets to investment real estate for calculation accordingly to the accounting standard.8. Main reasons for the decrease of construction in progress: in the report period, the decoration project of Changsha SEG Electronics Market has been completed, the item transfers to investment real estate and long-term deferred expenses separately which reduced the items of contraction in progress.9. Main reasons for the decrease of intangible assets: in the report period, Changsha SEG Building has been in operation after decoration, the Company transfers the land-use right of the item to investment real estate from intangible assets for calculation accordingly to the accounting standard.10. Main reasons for the increase of long-term deferred expenses: in the report period, after completing the decoration of Changsha SEG Electronics Market, the item has transferred from construction in progress to long-term deferred expenses.11. Main reasons for the decrease of account payable: in the report period, the engineering payment payable at the year-beginning has been paid after the decoration of Changsha SEG Building.12. Main reasons for the decrease of wages payable: in the report period, salary and year-end bonus of the end of 2009 have been paid to employees.13. Main reasons for the decrease of tax payable: the enterprise income tax that accrued in 2009 has been gathered and paid tax bureau for RMB 25.87 million in the report period.14. Main reasons for the increase of dividend payable: although the subsidiary announced dividend distribution to shareholders in the report period, unpaid dividend increased the item.II. Items of profit statementItem This periodSame period oflast yearBalance Change rate % Operating income 282,093,078.90 207,531,519.4874,561,559.4235.93%Operating cost 191,533,671.99 124,263,257.7567,270,414.24 54.14%Sales expenses 2,501,896.14 1,870,791.51631,104.63 33.73%Financial expense -2,825,264.12 -7,244,756.604,419,492.48 -61.00%Assets impairment loss -1,677,190.071,677,190.07 Investment income -2,733,552.46 -205,523,356.85202,789,804.39 Operating profit 52,132,376.06-151,324,134.55203,456,510.61 Non-operating income 953,064.46 2,131,072.31-1,178,007.85 -55.28%Non-operating expenditure 480,938.62 259,970.62220,968.0085.00%Total profit 52,604,501.90 -149,453,032.86202,057,534.76 Income tax expenses 13,010,936.32 27,662,817.32-14,651,881.00 -52.97%Net profit 39,593,565.58 -177,115,850.18216,709,415.761. Main reasons for the increase of operating income: ①the Changsha SEG and Shenzhen Mellow Orange Business Hotel Management Co., Ltd. (hereinafter referred to as “Mellow orange”) started in operation in this period and increased the operating income. ② compared with that of the same period of last year, the income of “Buy-it” store with self-operating and joint venture increased.2. Main reasons for the increase of operating cost: ①operating income increased in this period, the operating cost increased correspondingly. ② in this period, new business of the Company was still in the early stage with lower gross profit rate, so the operating cost increased higher than the operating income.3. Main reasons for the increase of sales expenses: operating income increased in this period, the sales expense increased correspondingly.4. Main reason for the changes of financial expenses: the interest income decreased in this period, monetary capital this period are saved as fixed deposit partially with due date of October 2010 – December 2010 mostly. No corresponding interest was received in the period, so no interest income was recognized.5. Main reason for the changes of assets impairment loss: there was no assets impairment loss in this report period. The bad debt loss of account receivable accrued in the same period of last year of RMB 3.9 million has been received through litigation.6. Main reasons for the increase of investment income: Shenzhen SEG Sumsung Glass Co., Ltd. (hereinafter referred to as “ST Sumsung”), 22.45% equity stock-jointly by the Company, has a sharp decline in deficit compared with the same period of last year.7. Main reasons for the increase of operating profit: ST Sumsung , 22.45% equity held by the Company, has a sharp decline in losses compared with the same period of last year8. Main reason for the decrease of non-operating income: due to the switched-back in the same period of last year, the Company should not pay the account payable. However, there is no switched-back of this account payable in this period.9. Main reason for the increase of non-operating expenditure: approved by the Board, RMB 0.3 million were donated to the poverty alleviation project of Zhanjiang ecological culture.10. Main reason for the increase of total profit: ST Sumsung, 22.45% equity stock-jointly by the Company, has a sharp decline this report period in losses compared with the same period of last year.11. Main reason for the decrease of income tax expenses: at the same period of last year, the Company reduced the equity of ST Sumsung and Shenzhen SEG GPS Scientific Co., Ltd. (hereinafter referred to as “SEG GPS”) held, sold the equity of Shenzhen SEG Communication Co., Ltd. (hereinafter referred to as “SEG Communication”) and Chongqing SEG Electronics Market Co., Ltd. (hereinafter referred to as “Chongqing SEG”), obtained major income tax payable. However, the income from equity selling decreased in this period, lowered down the taxable income tax.12. Main reason for the increase of net profit: ST Sumsung , 22.45% equity held by the Company, has a sharp decline this report period in losses compared with the same period of last year.III. Items of cash flow statementItem This periodSame period oflast yearBalanceChanged rate%Other cash received concerningoperating activities255,785,350.51 119,356,205.53136,429,144.98 114.30%Various taxes and fees paid 100,180,562.7562,501,960.9637,678,601.79 60.28%Other cash paid concerningoperating activities212,330,566.08 125,175,644.9687,154,921.12 69.63%Cash received from disposal ofinvestment0.00 88,192,419.25-88,192,419.25 -100.00%Cash received from returns oninvestments4,386,402.77 11,440,899.88-7,054,497.11-61.66%Net cash received from disposal of fixed assets, intangible assets and other long-term assets4,547,915.77435,620.004,112,295.77 944.01%Net cash received from disposal 24,511,448.87-24,511,448.87-100.00%of subsidiaries and otherbusiness entitiesNet cash paid for acquisition ofsubsidiaries and other business67,801,287.47-67,801,287.47 -100.00% entitiesOther cash paid relating to2,228,261.00-2,228,261.00 -100.00% investing activitiesCash paid for dividend andprofit distributing or interest4,596,996.5523,123,489.44-18,526,492.89 -80.12% paying①1. Main reason for the increased of other cash received concerning operating activities: Changsha SEG and Mellow Orange Hotel newly operating in this period together with “Buy-it” store that newly added in last May have②electronics market increased the account of goods more increase in this item. the collected cashier business ofreceived from clients.2. Main reason for the increase of various taxes and fees paid: the enterprise income tax paid in this period was higher than the same period of last year.①3. Main reason for the increased of other cash paid concerning operating activities: Changsha SEG and Mellow Orange Hotel newly operating in this period together with “Buy-it” store that newly added in last May have more②electronics market increased the account of goods refunded increase in this item. the collected cashier business ofto clients.4. Main reason for the decreased of cash received from disposal of investment: at the same period of last year, the Company reduced the equity of ST Sumsung, SEG GPS and ST Zero-Seven held, received RMB 88,192,400 in total. While no equity reduced in this period.5. Main reason for the decreased of cash received from returns on investment: in this report period, dividend from jointly invested enterprise received is lower than the same period of last year.6. Main reason for the increased of net cash received from disposal of fixed assets, intangible assets and other long-term assets: in this report period, the cash received from fixed assets disposal is more than the same period of last year.7. Net cash received from disposal of subsidiaries and other business entities: equity amount from selling the original subsidiary – SEG Telecommunication and Chongqing SEG received in the same period of last year. However, no subsidiary was sold in this report period.8. Main reason for the decreased of net cash paid for acquisition of subsidiaries and other business entities: purchased 46% equity of Changsha Xinxing Development Co., Ltd.( renamed as “Changsha SEG Development Co., Ltd.”) in the same period of last year, while no equity purchased in this period.9. Main reason for the decreased of other cash paid relating to investing activities: RMB 2.23 million of municipal affiliated charge that paid in the same period of last year for the industrial plant of Tower B, Baohua Building—owned by the Shenzhen SEG Baohua Enterprise Development Co., Ltd.(controlled enterprise of the Company), that temporarily changed the purpose of use to business-used. No such expenses happened in this period.10. Main reason for the decreased of cash paid for dividend and profit distributing or interest paying: the Company and invested enterprises shares lower dividend than the same period of last year.3.2 Progress of significant events, their influences, and analysis and explanation of their solutions3.2.1 Qualified opinion□Applicable √Inapplicable3.2.2 Particular about fund offers to controlling shareholders or associated parties and external guarantee that against the regulation.□Applicable √Inapplicable3.2.3 Particular about signing and implementing significant contracts of ordinary management.√Applicable □Inapplicable1. On 27 September 2010, the 3rd Meeting of 5th Board of Directors approved the Proposal of Renewing RMB 36 Million Loans Offered to Changsha SEG Development Co., Ltd. The Company and Changsha SEG continually entered into a loan contract on 30 September 2010, the new loan contract will come into effect from 25 October2010.2. On 29 September 2010, the 3rd extraordinary Meeting of 5th Board of Directors approved the Proposal of Offering Performance Guarantee to Shenzhen SEG Electronics Market Management Co., Ltd. by Shenzhen SEG Industry Development Co., Ltd.— Controlled Subsidiary of the Company. Shenzhen SEG Industry Development Co., Ltd. and Shenzhen SEG Electronics Market Management Co., Ltd. entered into an agreement of performance guarantee on 30 September 2010, the agreement is still in performed strictly at present.3.2.4 Others□Applicable √Inapplicable3.3 Implementations of commitments by the Company, shareholders and actual controller√Applicable □InapplicableCommitments Promiser Content of commitments Implementation Commitments for ShareMerger Reform-- -- -- Commitments made inAcquisition Report orReports on Change inInterests-- -- --Commitments made inmaterial assetsreorganization-- -- --Commitments made in issuing ShenzhenSEGGroupArticle 5 of the Equity Transfer Agreement whichthe Company had signed with Shenzhen SEGGroup(hereinafter referred to as “SEG Group”) atthe time of the Company’s listing stipulated: SEGGroup permits the Company, as well as subsidiariesof the Company and affiliated companies to use the8 registered trademarks that SEG Group haspresently registered at the State Trademark Office; italso permits the Company to take the aforesaidtrademarks and symbols that are similar to thesemarks as the symbol of the Company, as well as touse the aforesaid symbols or symbols that aresimilar to these symbols during the operationprocess; the Company doesn’t have to pay SEGGroup any fee for the use of the aforesaidtrademarks or symbols.In the reportperiod, thiscommitment wasstill implementedaccording to thecommitment.Other commitments (including additional commitments) SEGGroup(1) According to the problem of “Your company’sexisting same industry competition in the electronicsmarket business with SEG Group” appointed byShenzhen Securities Regulatory Bureau in 2007 atthe spot investigation of the Company, the Companyreceived SEG Group’s Consent Letter on Sep.14,2007, with the content as follows: Our company’sfamiliar business in electronics market of Shenzhenwith Shenzhen SEG Group Co. Ltd. occurred on thebasis of historical reasons and had objective marketdeveloping background. Our Group promised thatwe will not have business single in the same citywith Shenzhen SEG. The matter has been disclosedon China Securities, Securities Times, Hong KongWen Wei Po and datedSep. 18, 2007. Controlling shareholdersimplemented the abovementioned commitment inthe report period.Controllingshareholdersimplemented theabovementionedcommitment inthe report period.(2) On Oct. 18th of 2007, SEG Group, the firstlargest shareholder of the Company, issuedCommitment Letter on Strengthening Managementover Non-public Information to the Company andShenzhen Securities Regulatory Bureau, in which itwas promised that our company would establish andperfect the internal control management over theacquired non-public information of listedcompanies; supervise the relevant informationinsider in our company and the actual controllers ofthe company not to buy the securities of yourcompany taking advantage of the non-publicinformation of your company; not suggest others totrade the securities of your company; not to leak thenon-public information of your company and offerthe list of insider in our company and actualcontrollers of our company knowing the non-publicinformation of your company and your company canhand this name list to Shenzhen SecuritiesRegulatory Bureau and Shenzhen Stock Exchangefor records. SEG Group implemented thecommitment in the report period.3.4 Estimation of accumulative net profit from the beginning of the year to the end of next report period to be loss probably or the warning of its material change compared with the corresponding period of the last year and explanation of reason√Applicable □InapplicableForecast of performances LossesYear-beginning to the end of next report period Same period of lastyearChange of increase/decrease (%)Estimated amount ofaccumulative netprofit(RMB’0000)5,800.00 -- 6,200.00-31,209.21-- --Basic earnings pershare(RMB/Share)0.0739 -- 0.0790-0.3977-- --Explanations on forecast of performances (1) ST Samsung—stock-jointly by the Company of 22.45% equity, estimating to gained accumulative profit of RMB 12 million to RMB 16 million from the year-beginning to the end of next report period.(2) The performance forecast has not been pre-audited by CPAs.3.5 Particulars about the other significant events which need explanations3.5.1 Particular about security investment□Applicable √Inapplicable3.5.2 Activities on receiving research, communication and interview in the report periodDate Place Way The receivedpartiesContents discussed andmaterials supplied21 July 2010 The CompanyTelephonecommunicationInvestorGet to know the basic informationof the Company12 August 2010 The CompanyTelephonecommunicationInvestorGet to know the basic informationof the Company30 August 2010 The CompanyTelephonecommunicationInvestorGet to know the basic informationof the Company7 September 2010 The Company Telephone Investor Get to know the basic informationcommunication of the Company3.6 Particulars about derivatives investment□Applicable √Inapplicable3.6.1 Particulars about the positions of derivatives investment at the end of report period□Applicable √Inapplicable§4. Appendix4.1 Balance sheetPrepared by Shenzhen SEG Co., Ltd. 30 September 2010 Unit: RMB YuanBalance at period-end Balance at year-beginning ItemsConsolidation Parent Company Consolidation Parent Company Current assets:Monetary funds 542,256,260.68420,592,703.75485,135,270.94 375,350,393.53 provisionsSettlementlentCapitalTransactional financeassetsreceivableNotesAccounts receivable 30,555,507.95400,000.0018,130,631.40 1,134,357.47Accounts paid in25,662,349.19321,570.0118,404,268.08 8,035,295.00 advancereceivableInsuranceReinsurancereceivablesContract reserves ofreinsurance receivableInterests receivable 2,460,821.92 2,460,821.92Dividends receivableOther receivables 12,415,281.4841,384,858.0811,971,998.74 45,306,466.00 Purchase restitutedfinance assetsInventor 4,144,123.505,886,392.39 Non-current assets duewithin one yearassetscurrentOtherTotal current assets 615,033,522.80462,699,131.84541,989,383.47 432,287,333.92 Non-current assets:Granted loans andadvancesFinance assets available919,347.450.003,843,571.87 3,304,100.00 for salesHeld-to-maturityinvestmentLong-term accountsreceivableLong-term equity122,236,328.82303,333,827.86119,732,099.86 300,829,598.90 investmentInvestment property 589,742,487.06339,872,587.51442,502,999.44 347,797,315.91 Fixed assets 59,900,235.7622,560,066.12189,516,718.30 23,314,450.93 Construction in progress1,679,702.0726,192,075.55EngineeringmaterialsDisposal of fixed assetsProductive biologicalassetsOil and gas assetsIntangible assets 679,703.79528,013.414,756,432.31 651,865.38Expenses on researchand developmentGoodwill 10,328,927.820.0010,328,927.82Long-term expenses to15,149,670.911,442,785.7013,041,779.82 1,165,451.06 be apportionedDeferred incomes tax9,140,144.475,994,015.937,586,398.99 5,994,015.93 assetassetsOthernon-currentTotal non-current assets 809,776,548.15673,731,296.53817,501,003.96 683,056,798.11Total assets 1,424,810,070.951,136,430,428.371,359,490,387.43 1,115,344,132.03Current liabilities:Short-term loans 0.00Loans from central bankAbsorbing deposits andinter-bank depositsborrowedCapitalTransaction financialliabilitiesNotespayableAccounts payable 5,550,801.942,358,565.128,225,509.02 2,178,169.12Accounts received in122,727,696.7559,130,592.72105,563,890.39 65,801,272.52 advanceSelling financial assetsof repurchaseCommission charge andcommission payableWages payable 1,426,221.8299,311.124,261,476.99 2,065,724.98Taxes payable 12,617,672.4410,984,839.9924,421,758.66 24,773,634.49payableInterestsDividends payable 1,295,963.57153,403.29921,420.73 153,403.29Other accounts payable107,736,805.8938,477,457.9486,454,289.91 41,932,495.62payablesReinsuranceInsurance contractreserveSecurities trading ofagencySecurity sales of agencyNon-current liabilitiesdue within 1 yearliabilitiescurrentOtherTotal current liabilities 251,355,162.41111,204,170.18229,848,345.70 136,904,700.02Non-current liabilities:loansLong-termBondspayableLong-term accountspayableSpecial accountspayableliabilitiesProjectedDeferred income tax21,864,786.8023,160,034.29 547,125.71 liabilitiesnon-currentOtherliabilitiesTotal non-current liabilities 21,864,786.800.0023,160,034.29 547,125.71Total liabilities 273,219,949.21111,204,170.18253,008,379.99 137,451,825.73Owner’s equity (orshareholders’ equity):Paid-in capital (or share784,799,010.00784,799,010.00784,799,010.00 784,799,010.00 capital)Capital public reserve 407,751,952.12404,980,399.08396,922,482.95 394,348,208.41Less: Inventory sharesReasonable reserveSurplus public reserve 102,912,835.67102,912,835.67102,912,835.67 102,912,835.67Provisions of generalriskRetained profits -232,468,306.89-267,465,986.56-268,431,923.52 -304,167,747.78Balance difference of-466,174.06-542,916.63foreign currency translationTotal owner’s equity1,062,529,316.841,025,226,258.191,015,659,488.47 977,892,306.30 attributable to parentcompanyMinority interests 89,060,804.900.0090,822,518.97Total owner’s equity 1,151,590,121.741,025,226,258.191,106,482,007.44 977,892,306.30Total liabilities and owner’s1,424,810,070.951,136,430,428.371,359,490,387.43 1,115,344,132.03 equity4.2 Profit statement in the report periodPrepared by Shenzhen SEG Co., Ltd. July-September 2010 Unit: RMB YuanAmount of this period Amount of last period ItemsConsolidation Parent company Consolidation Parent company I. Total operating incomes 103,795,650.7027,114,911.9769,649,034.41 24,901,333.58 Thereinto: Operating income103,795,650.7027,114,911.9769,649,034.41 24,901,333.58 Interest income 0.000.000.00 0.00 Insurance gained 0.000.000.00 0.00Commission charge and0.000.000.00 0.00 commission incomeII. Total operating costs 90,879,968.7017,769,010.7160,930,535.31 18,733,355.32 Thereinto: Operating cost 76,000,224.3811,327,546.4745,631,991.25 10,528,239.12 Interest expense 0.000.000.00 0.00Commission charge and0.000.000.00 0.00 commission expenseCash surrender value 0.000.000.00 0.00Net amount of expense0.000.000.00 0.00 of compensationNet amount of0.000.000.00 0.00 withdrawal of insurancecontract reserveBonus expense of0.000.000.00 0.00 guarantee slipReinsurance expense 0.000.000.00 0.00 Operating tax and extras4,536,412.382,342,511.743,098,039.40 1,515,160.09 Sales expenses -13,493.250.00517,742.59 0.00Administration10,677,413.134,739,865.4010,424,300.72 4,604,674.13 expensesFinancial expenses -320,587.94-640,912.90-1,018,648.58 -191,827.95Losses of devaluation of0.000.002,277,109.93 2,277,109.93 assets。
2010年第三季度工作分析报告各位领导;同仁大家好,新的一年第一季度工作已结束,现就第一季度销售情况向大会做一回报。
一;销售及资金回笼情况;本季度共计签订预收合同万吨,共计出库吨,预付款出库吨,预付款结余未提吨。
内部调用吨,其中中宁公司吨,银川公司吨,灵武公司吨,本季度共计预收资金万元。
1. 销量:吨、泥有限吨,宁夏瀛海银川建材公司吨。
预收款发放中区内吨,区外吨。
二;销售情况;这两年来水泥一直处于供不应求,高价位运行阶段,市场状态良好。
水泥、熟料市场行情旺盛。
第一季度由于水泥出库量的减少,及周边低价熟料的冲击,我们熟料价格有所回落,需求也有相应的减少,冬季冬储我们共计预售13万吨,现在我们还共计库存吨,预付款未拉吨,现在每天生产吨,本公司每天调运吨,外卖吨左右。
三;周边熟料价格对比及情况分析;现在对我们熟料销售市场略有影响的是平凉海螺熟料,冬储价格为220元,现在调到240元,该厂熟料到银川周边粉磨站运费为55元,就已金马水泥公司为列冬储到现场价为275元。
山西冀东熟料,现售价215元,运费90元,到宁夏现场价为310元左右。
萌城水泥;除了满足自身及下属粉磨站需要外,外卖不多售价为270元,现在九连山在购买。
其它无外卖。
胜金关熟料280元,同时赛马,西夏水泥2500吨生产线投产后也是以满足自身需求为主,外卖占较少比例。
另一方面,随着我们熟料产能的加大,熟料若想向周边省份销售,将会面临更加激烈的竞争,比如陕北地区水泥市场历来是兵家必争之地,当前榆林地区粉磨站主要以蒙西以及山西冀东熟料为主,从熟料价格及运费方面看我们无优势可言。
棋盘井周边粉磨站主要以西水,蒙西为主。
所以我们销售始终坚持以“空白市场,无竞争或竞争较少市场”为主要目标客户。
同时在冬储时我们采取冬储量与全年需求量相挂钩预留保证金的办法,分别签订了三家用量大资金好的客户,在销售旺季我们保证客户量的需求,客户保证我们资金以确保我们每月生产资金需求。
宏观经济景气动向分析(2010年3季度)中国网时间:2010-11-01[9月] 经济增速继续放缓价格水平再现高点一、宏观经济预警分析宏观经济预警指数2010年9月份,宏观经济预警指数为28.4点,比上月下降0.8个点,从第二季度开始一直保持在“绿灯区”。
9月份,国家继续落实房地产调控、加大节能减排力度、合理安排信贷投放进度等政策,受此影响,除消费和居民消费价格指数外,其余主要经济指标均出现不同程度的下调。
从构成预警指数的指标上看,大部分指标较上月没有发生灯号变化,其具体数值呈现“六降四升”的格局,其中,进出口总额和工业企业利润下降幅度较大。
宏观预警灯号图9月份,在预警指数的10个构成指标(经季节调整去除季节因素和随机因素的影响)中,1个指标处于“黄灯区”——社会消费品零售总额;2个指标处于“浅蓝灯区”——进出口总额、财政收入;1个指标处于“深蓝灯区”——商品房销售额;其余6个指标均处于“绿灯区”——工业增加值、固定资产投资、城镇居民人均可支配收入、金融机构各项贷款、居民消费价格指数和工业企业利润。
3季度,我国经济增速继续呈现趋缓态势,GDP实际同比增长9.6%,前3季度累计实际增速为10.6%,全年经济增长呈现“前高后低”走势。
9月份,国家积极推进淘汰落后产能、限制高能耗产业工作,意图按计划完成节能减排任务,在此影响下,工业生产增速难以走出下降通道。
9月份,规模以上工业增加值实际同比增速为13.3%,比8月下降0.6个百分点;1-9月份实际累计增速为16.3%。
可喜的是,中国制造业采购经理指数(PMI) 连续两个月保持上升,9月份达到53.8%,较之上月再次上升2.1个百分点。
这预示拉动工业增长的市场力量逐步增强,从而经济增长的回调过程趋稳,工业生产的各个方面仍处于良好状态。
综合各方面因素来看,近期,工业增加值仍将保持在“绿灯区”内运行。
拉动宏观经济的三大需求的运行状况良好。
9月份,房地产新政效果进一步显现,房地产开发投资额累计增速已连续数月下降;而对落后和过剩产能的调控也进一步抑制了工业投资的增长。
证券代码:000529 证券简称:广弘控股公告编号:2010-22 广东广弘控股股份有限公司2010年第三季度季度报告正文§1 重要提示1.1 本公司董事会、监事会及董事、监事、高级管理人员保证本报告所载资料不存在任何虚假记载、误导性陈述或者重大遗漏,并对其内容的真实性、准确性和完整性负个别及连带责任。
1.2除下列董事外,其他董事亲自出席了审议本次季报的董事会会议未亲自出席董事姓名未亲自出席董事职务未亲自出席会议原因被委托人姓名黄广伟副董事长出差在外黄湘晴1.3 公司第三季度财务报告未经会计师事务所审计。
1.4 公司负责人崔河、主管会计工作负责人陈增玲及会计机构负责人(会计主管人员)李旺声明:保证季度报告中财务报告的真实、完整。
§2 公司基本情况2.1 主要会计数据及财务指标单位:元2010.9.30 2009.12.31 增减幅度(%)总资产(元)945,743,408.11931,334,130.01 1.55%归属于上市公司股东的所有者权益(元)688,673,548.79643,112,196.38 7.08%股本(股)583,790,330.00583,790,330.00 0.00%归属于上市公司股东的每股净资产(元/股)1.1797 1.1016 7.09%2010年7-9月比上年同期增减(%)2010年1-9月比上年同期增减(%)营业总收入(元)271,006,399.7315.22%815,659,793.22 13.38%归属于上市公司股东的净利润(元)17,760,412.1935.51%45,911,352.41 11.87%经营活动产生的现金流量净额(元)- - -2,587,211.7594.12%每股经营活动产生的现金流量净额(元/股)- - -0.004494.16%基本每股收益(元/股)0.030435.11%0.0786 11.81%稀释每股收益(元/股)0.030435.11%0.0786 11.81%加权平均净资产收益率(%) 2.62%20.18% 6.86% 0.44%扣除非经常性损益后的加权平均净资产收益率(%)1.86%-14.68% 4.78% -25.43%非经常性损益项目年初至报告期末金额附注非流动资产处置损益-383,174.45对外委托贷款取得的损益9,309,227.78除上述各项之外的其他营业外收入和支出9,869,270.99所得税影响额-4,698,831.08少数股东权益影响额-1,910,562.07合计12,185,931.17 - 2.2 报告期末股东总人数及前十名无限售条件股东持股情况表单位:股报告期末股东总数(户)71,387前十名无限售条件流通股股东持股情况股东名称(全称)期末持有无限售条件流通股的数量种类崔玉梅2,570,247人民币普通股黄小梅1,450,883人民币普通股张海清1,074,040人民币普通股陈小华1,001,966人民币普通股葛新兰939,897人民币普通股汤维中800,000人民币普通股朱大力669,000人民币普通股李临临658,500人民币普通股蔡延延650,000人民币普通股吴勇志600,000人民币普通股§3 重要事项3.1 公司主要会计报表项目、财务指标大幅度变动的情况及原因√适用□不适用1、预付款项比年初减少 41,114,964.75元,减幅82%,主要是本期购置物业完成过户手续转出和将预付账款结转库存商品所致;2、存货比年初增加31,406,957.90元,增幅31%,主要是本期教育书店教辅书的发行量增加和贸易企业的贸易规模扩大所致;3、在建工程比年初增加 41,894,730.43元,增幅1175%,主要是购置物业转入装修增加和下属企业新上工程项目所致;4、短期借款比年初增加 10,000,000.00元,增幅100%,主要是本期增加银行借款所致;5、应付职工薪酬比年初减少 2,859,071.11元,减幅37%,主要是本期发放了上年度计提的效益工资所致;6、应交税费比年初减少 11,592,628.64元,减幅63%,主要是本年度缴纳了上年度12月计提企业所得税和营业税所致;7、专项应付款比年初减少 551,763.36元,减幅100%,主要是拆迁补偿款使用减少所致;8、财务费用比去年同期减少 10,856,093.11元,减幅1208%,主要是本期增加委托贷款利息收入和存款利息收入所致;9、资产减值损失比去年同期减少 1,218,035.79元,减幅86%,主要是本期计提坏账准备减少所致;10、投资收益比去年同期增加 1,865,256.30元,增幅169%,主要是投资联营企业收益增加所致;11、营业外收入比去年同期增加 7,886,934.56元,增幅56%,主要是本期增加拆迁补偿收益所致;12、营业外支出比去年同期增加 1,633,626.79元,增幅301%,主要是本期增加捐赠支出和处置固定资产支出所致;13、所得税费用比去年同期增加 5,653,916.15元,增幅52%,主要是本期增加计提政府储备补贴和委托贷款收益应交企业所得税所致;14、少数股东损益比去年同期减少 541,073.92元,减幅44%,主要是本期少数股东投资的企业利润减少所致。
桂林广陆数字测控股份有限公司2010年第三季度报告全文§1 重要提示1.1 本公司董事会、监事会及董事、监事、高级管理人员保证本报告所载资料不存在任何虚假记载、误导性陈述或者重大遗漏,并对其内容的真实性、准确性和完整性负个别及连带责任。
1.2 公司第三季度财务报告未经会计师事务所审计。
1.3 公司负责人彭朋、主管会计工作负责人刘素萍及会计机构负责人(会计主管人员) 唐梅芳声明:保证季度报告中财务报告的真实、完整。
§2 公司基本情况2.1 主要会计数据及财务指标单位:元2010.9.30 2009.12.31 增减幅度(%)总资产(元)405,406,042.81 397,760,302.16 1.92% 归属于上市公司股东的所有者权益(元)253,660,151.65 258,925,256.38 -2.03% 股本(股)85,398,288.00 85,398,288.00 0.00% 归属于上市公司股东的每股净资产(元/2.973.03 -1.98%股)2010年7-9月比上年同期增减(%)2010年1-9月比上年同期增减(%)营业总收入(元)33,348,476.38 91.02% 97,595,693.04 13.21% 归属于上市公司股东的净利润(元)608,112.61 -11.27% 4,013,518.72 5.52% 经营活动产生的现金流量净额(元)- - -1,642,955.57 -126.26%每股经营活动产生的现金流量净额(元/- - -0.02 -128.57% 股)基本每股收益(元/股)0.01 0.00% 0.05 25.00% 稀释每股收益(元/股)0.01 0.00% 0.05 25.00% 加权平均净资产收益率(%)0.24% -11.11% 1.57% 6.08%扣除非经常性损益后的加权平均净资产0.19% -12.50% 1.52% 23.58%收益率(%)非经常性损益项目年初至报告期末金额附注计入当期损益的政府补助,但与公司正常经营业务密切相关,符合139,863.41国家政策规定、按照一定标准定额或定量持续享受的政府补助除外除上述各项之外的其他营业外收入和支出-1,565.27所得税影响额-20,756.82合计117,541.32 -2.2 报告期末股东总人数及前十名无限售条件股东持股情况表单位:股报告期末股东总数(户)12,334前十名无限售条件流通股股东持股情况股东名称(全称)期末持有无限售条件流通股的数量种类中国银行-招商行业领先股票型证券投资基金3,155,600 人民币普通股李晓东1,786,032 人民币普通股梁亚辉1,140,584 人民币普通股中信信托有限责任公司-年金2005第0001号731,000 人民币普通股刘虹668,409 人民币普通股上海源岛置业有限公司619,851 人民币普通股中国银行-招商先锋证券投资基金525,303 人民币普通股刘丹478,681 人民币普通股施蕊425,906 人民币普通股陈聪300,000 人民币普通股§3 重要事项3.1 公司主要会计报表项目、财务指标大幅度变动的情况及原因√适用□不适用3.1.1 报告期内公司资产负债表项目大幅度变动及原因:单位:人民币(元)项目2010年1-9月年初数增减比例原因应收票据9,044,568.902,310,000.05 291.54% 主要是国内销售承兑票据的增加。
预付账款12,516,490.55 19,482,543.48 -35.76%主要是尚未支付供应商货款。
其他应收款6,040,787.09 2,132,980.34 183.21% 主要原因是代垫出口货物运费、网销广告费及出国费用。
在建工程1,115,835.45 10,635,644.03 -89.51% 主要是1、60万套防水项目改造工程完工的减少;2、高精度进口设备安装使用,自制专用设备投入使用的减少。
预收账款4,809,360.64 2,012,927.94 138.92% 主要是内销预收经销商货款的增加。
应付职工薪酬247,246.46 628,041.96 -60.63% 主要是支付职工养老保险减少。
外币报表折算差价-2,359,313.22 -1,620,518.57 45.59% 主要是汇率变动影响。
3.1.2 报告期公司利润表项目大幅度变动及原因:单位:人民币(元)项目2010年1-9月上年同期增减比例原因资产减值损失641,165.78158,086.70305.58% 主要是计提应收账款坏账准备金的增加。
营业外收入142,423.41 804,673.73 -82.30% 主要是政府补助的减少。
营业外支出4,125.27 14,145.45 -70.84% 主要是处置固定资产的减少。
所得税费用787,349.58 1,129,338.60 -30.28% 主要是预交所得税比去年同期减少。
3.1.3 报告期公司现金流量表项目大幅度变动及原因:单位:人民币(元)项目2010年1-9月上年同期增减比例原因经营活动产生的现金流量净额-1,642,955.576,256,562.15-126.26%主要是1、收到承兑汇票增加;2、为职工支付的现金增加。
投资活动产生的现金流量净额-7,435,011.86 -13,846,869.52 -46.31% 主要是收到欧洲子公司投资款。
筹资活动产生的现金流量净额-5,621,043.55 29,952,522.35 -118.77%主要是1、银行借款收现减少和偿还债务付现减少;2、支付年度现金分红股利。
3.2 重大事项进展情况及其影响和解决方案的分析说明3.2.1 非标意见情况□适用√不适用3.2.2 公司存在向控股股东或其关联方提供资金、违反规定程序对外提供担保的情况□适用√不适用3.2.3 日常经营重大合同的签署和履行情况□适用√不适用3.2.4 其他□适用√不适用3.3 公司、股东及实际控制人承诺事项履行情况√适用□不适用承诺事项承诺人承诺内容履行情况股改承诺无无无收购报告书或权益变动报告书中所作承诺无无无重大资产重组时所作承诺无无无发行时所作承诺彭朋、黄迪公司实际控制人及第一大股东彭朋先生、第二大股东黄迪先生承诺:自公司股票上市之日起三十六个月内,不转让或者委托他人管理其持有的本次发行前公司的股份,也不由公司回购该部分股份。
公司股东深圳市招商局科技投资有限公司和北京佳源通汇科技发展有限公司承诺:自公司上市之日起十二个月至二十四个月报告期内以上承诺严格执行。
内,出售公司股份不超过其所持股数的20%;自上市之日起十二个月至三十六个月内,出售公司股份累计不超过其所持股份的50%。
公司其余股东持有的公司股份根据《公司法》相关规定自公司股票在证券交易所上市交易之日起一年内不得转让。
其他承诺(含追加承诺)彭朋、黄迪、刘素萍2007年1月23日,持有公司5%以上股权的股东彭朋、黄迪、刘素萍、分别出具了《关于避免同业竞争的承诺函》,郑重承诺如下:1、本人保证现时不存在经营与股份公司相同或相似业务的情况。
2、本人保证将不在任何地方以任何方式直接或间接经营、参与投资生产、研究和开发任何对股份公司构成或可能构成直接或间接竞争的相同或相似或可替代的产品,并愿意对违反上述承诺而给股份公司造成的经济损失承担赔偿责任。
3、本保证、承诺持续有效,直至本人不再作为股份公司股东为止。
4、自本函出具之日起,本函及本函项下的保证、承诺即为不可撤销。
目前正在履行中,报告期内未发生同业竞争。
3.4 对2010年度经营业绩的预计2010年度预计的经营业绩归属于上市公司股东的净利润比上年同期增长幅度小于50%2010年度净利润同比变动幅度的预计范围归属于上市公司股东的净利润比上年同期增长幅度为:5.00% ~~10.00%2009年度经营业绩归属于上市公司股东的净利润(元):4,564,024.67 业绩变动的原因说明市场逐渐回暖,销售订单有所增加,从而提升效益。
3.5 其他需说明的重大事项3.5.1 证券投资情况□适用√不适用§4 附录4.1 资产负债表编制单位:桂林广陆数字测控股份有限公司2010年09月30日单位:元期末余额年初余额项目合并母公司合并母公司流动资产:货币资金75,424,676.49 75,006,803.94 90,132,956.78 89,319,374.25 结算备付金拆出资金交易性金融资产应收票据9,044,568.90 7,254,568.90 2,310,000.05 2,310,000.05 应收账款57,492,179.11 55,584,003.94 46,564,103.17 51,868,684.70 预付款项12,516,490.55 12,277,177.41 19,482,543.48 19,148,780.34 应收保费应收分保账款应收分保合同准备金应收利息应收股利其他应收款6,040,787.09 14,327,609.92 2,132,980.34 15,065,035.74 买入返售金融资产存货70,889,487.75 66,032,033.68 64,656,912.26 62,135,639.76 一年内到期的非流动资产其他流动资产流动资产合计231,408,189.89 230,482,197.79 225,279,496.08 239,847,514.84 非流动资产:发放贷款及垫款可供出售金融资产持有至到期投资长期应收款长期股权投资50,647,150.00 63,696,200.00 投资性房地产固定资产127,167,786.82 89,828,488.18 112,285,083.11 72,795,593.30 在建工程1,115,835.45 1,115,835.45 10,635,644.03 10,635,644.03 工程物资固定资产清理生产性生物资产油气资产无形资产41,924,305.61 33,851,584.36 46,074,150.23 34,011,998.88 开发支出2,480,568.35 2,480,568.35 2,176,572.02 2,176,572.02 商誉长期待摊费用递延所得税资产1,309,356.69 926,038.20 1,309,356.69 926,038.20 其他非流动资产非流动资产合计173,997,852.92 178,849,664.54 172,480,806.08 184,242,046.43 资产总计405,406,042.81 409,331,862.33 397,760,302.16 424,089,561.27 流动负债:短期借款99,810,000.00 97,000,000.00 92,000,000.00 90,500,000.00 向中央银行借款吸收存款及同业存放拆入资金交易性金融负债应付票据应付账款15,707,718.27 19,326,873.11 13,895,245.27 37,752,116.25 预收款项4,809,360.64 4,698,913.18 2,012,927.94 1,902,480.48 卖出回购金融资产款应付手续费及佣金应付职工薪酬247,246.46 244,959.70 628,041.96 526,731.02 应交税费-548,682.14 -730,265.19 -454,736.85 -704,439.54 应付利息应付股利其他应付款6,542,014.28 1,542,538.28 5,507,830.31 2,022,822.77 应付分保账款保险合同准备金代理买卖证券款代理承销证券款一年内到期的非流动负债其他流动负债流动负债合计126,567,657.51 122,083,019.08 113,589,308.63 131,999,710.98 非流动负债:长期借款23,678,233.65 20,000,000.00 23,945,737.15 20,000,000.00 应付债券长期应付款专项应付款预计负债递延所得税负债其他非流动负债1,500,000.00 3,377,333.26 1,300,000.00 3,705,333.29 非流动负债合计25,178,233.65 23,377,333.26 25,245,737.15 23,705,333.29 负债合计151,745,891.16 145,460,352.34 138,835,045.78 155,705,044.27 所有者权益(或股东权益):实收资本(或股本)85,398,288.00 85,398,288.00 85,398,288.00 85,398,288.00 资本公积104,101,243.28 104,101,243.28 104,101,243.28 104,101,243.28 减:库存股专项储备盈余公积17,807,457.47 17,743,222.13 17,807,457.47 17,743,222.13一般风险准备未分配利润48,712,476.12 56,628,756.58 53,238,786.20 61,141,763.59 外币报表折算差额-2,359,313.22 -1,620,518.57归属于母公司所有者权益合计253,660,151.65 263,871,509.99 258,925,256.38 268,384,517.00 少数股东权益所有者权益合计253,660,151.65 263,871,509.99 258,925,256.38 268,384,517.00 负债和所有者权益总计405,406,042.81 409,331,862.33 397,760,302.16 424,089,561.274.2 本报告期利润表编制单位:桂林广陆数字测控股份有限公司2010年7-9月单位:元本期金额上期金额项目合并母公司合并母公司一、营业总收入33,348,476.38 32,665,103.73 17,457,801.85 24,952,529.93 其中:营业收入33,348,476.38 32,665,103.73 17,457,801.85 24,952,529.93 利息收入已赚保费手续费及佣金收入二、营业总成本32,721,615.74 31,857,867.04 16,707,090.06 23,115,654.02 其中:营业成本24,046,354.87 24,065,307.59 9,042,634.32 17,573,529.79 利息支出手续费及佣金支出退保金赔付支出净额提取保险合同准备金净额保单红利支出分保费用营业税金及附加312,486.48 274,995.46 340,887.35 238,996.34 销售费用1,776,285.48 1,717,636.74 1,234,349.73 825,846.02 管理费用4,737,047.23 3,973,290.15 4,712,802.74 3,143,413.60 财务费用1,849,441.68 1,826,637.10 1,376,415.92 1,333,868.27 资产减值损失加:公允价值变动收益(损失以“-”号填列)投资收益(损失以“-”号填列)其中:对联营企业和合营企业的投资收益汇兑收益(损失以“-”号填列)三、营业利润(亏损以“-”号填626,860.64 807,236.69 750,711.79 1,836,875.91 列)加:营业外收入104,037.67 104,037.67 123,488.34 167,346.24 减:营业外支出3,033.05 3,033.05 7,419.91 13,682.10其中:非流动资产处置损失四、利润总额(亏损总额以“-”727,865.26 908,241.31 866,780.22 1,990,540.05 号填列)减:所得税费用119,752.65 161,828.88 181,412.34 310,807.06五、净利润(净亏损以“-”号填608,112.61 746,412.43 685,367.88 1,679,732.99 列)归属于母公司所有者的净608,112.61 746,412.43 685,367.88 1,679,732.99 利润少数股东损益六、每股收益:(一)基本每股收益0.01 0.01 0.01 0.02 (二)稀释每股收益0.01 0.01 0.01 0.02七、其他综合收益八、综合收益总额608,112.61 746,412.43 685,367.88 1,679,732.99归属于母公司所有者的综608,112.61 746,412.43 685,367.88 1,679,732.99 合收益总额归属于少数股东的综合收益总额4.3 年初到报告期末利润表编制单位:桂林广陆数字测控股份有限公司2010年1-9月单位:元本期金额上期金额项目合并母公司合并母公司一、营业总收入97,595,693.04 95,755,939.75 86,204,223.22 90,998,625.54其中:营业收入97,595,693.04 95,755,939.75 86,204,223.22 90,998,625.54利息收入已赚保费手续费及佣金收入二、营业总成本92,924,418.40 91,611,174.51 82,061,980.01 85,568,474.80其中:营业成本69,186,086.74 70,371,477.11 57,967,787.14 67,289,728.68利息支出手续费及佣金支出退保金赔付支出净额提取保险合同准备金净额保单红利支出分保费用营业税金及附加870,594.45 761,846.52 1,219,703.11 846,287.18 销售费用4,659,636.29 4,457,004.23 5,067,670.65 3,681,666.65 管理费用12,780,291.66 10,506,503.17 13,214,248.51 9,241,677.62 财务费用4,786,643.48 4,719,075.42 4,434,483.90 4,285,949.29 资产减值损失641,165.78 795,268.06 158,086.70 223,165.38 加:公允价值变动收益(损失以“-”号填列)投资收益(损失以“-”号-8,704.48 531,060.07填列)其中:对联营企业和合营企业的投资收益汇兑收益(损失以“-”号填列)三、营业利润(亏损以“-”号填4,662,570.16 4,675,825.31 4,142,243.21 5,430,150.74 列)加:营业外收入142,423.41 142,423.41 804,673.73 687,431.62 减:营业外支出4,125.27 4,077.35 14,145.45 13,682.10 其中:非流动资产处置损失四、利润总额(亏损总额以“-”4,800,868.30 4,814,171.37 4,932,771.49 6,103,900.26 号填列)减:所得税费用787,349.58 787,349.58 1,129,338.60 966,927.88五、净利润(净亏损以“-”号填4,013,518.72 4,026,821.79 3,803,432.89 5,136,972.38 列)归属于母公司所有者的净4,013,518.72 4,026,821.79 3,803,432.89 5,136,972.38 利润少数股东损益六、每股收益:(一)基本每股收益0.05 0.05 0.04 0.06 (二)稀释每股收益0.05 0.05 0.04 0.06七、其他综合收益八、综合收益总额4,013,518.72 4,026,821.79 3,803,432.89 5,136,972.38归属于母公司所有者的综4,013,518.72 4,026,821.79 3,803,432.89 5,136,972.38 合收益总额归属于少数股东的综合收益总额4.4 年初到报告期末现金流量表编制单位:桂林广陆数字测控股份有限公司2010年1-9月单位:元本期金额上期金额项目合并母公司合并母公司一、经营活动产生的现金流量:销售商品、提供劳务收到的90,882,678.49 88,582,398.00 97,768,994.19 94,169,787.17 现金客户存款和同业存放款项净增加额向中央银行借款净增加额向其他金融机构拆入资金净增加额收到原保险合同保费取得的现金收到再保险业务现金净额保户储金及投资款净增加额处置交易性金融资产净增加额收取利息、手续费及佣金的现金拆入资金净增加额回购业务资金净增加额收到的税费返还927,964.61 927,964.61 1,975,886.20 1,142,314.79 收到其他与经营活动有关1,748,617.07 1,845,225.58 2,384,580.81 1,888,450.44 的现金经营活动现金流入小计93,559,260.17 91,355,588.19 102,129,461.20 97,200,552.40购买商品、接受劳务支付的55,172,813.31 57,005,429.29 55,680,669.79 57,144,223.35 现金客户贷款及垫款净增加额存放中央银行和同业款项净增加额支付原保险合同赔付款项的现金支付利息、手续费及佣金的现金支付保单红利的现金支付给职工以及为职工支24,195,546.94 20,460,437.90 23,846,449.09 19,766,724.76 付的现金支付的各项税费6,741,148.15 5,495,197.39 8,326,436.18 6,021,670.57支付其他与经营活动有关9,092,707.34 8,466,913.26 8,019,343.99 7,094,205.26 的现金经营活动现金流出小计95,202,215.74 91,427,977.84 95,872,899.05 90,026,823.94经营活动产生的现金-1,642,955.57 -72,389.65 6,256,562.15 7,173,728.46 流量净额二、投资活动产生的现金流量:收回投资收到的现金3,392,900.00取得投资收益收到的现金处置固定资产、无形资产和3,395,100.00 2,200.00 1,000.00 1,000.00 其他长期资产收回的现金净额处置子公司及其他营业单位收到的现金净额收到其他与投资活动有关的现金投资活动现金流入小计3,395,100.00 3,395,100.00 1,000.00 1,000.00购建固定资产、无形资产和10,830,111.86 10,770,921.86 13,847,869.52 12,920,560.96 其他长期资产支付的现金投资支付的现金质押贷款净增加额取得子公司及其他营业单位支付的现金净额支付其他与投资活动有关的现金桂林广陆数字测控股份有限公司2010年第三季度报告全文11投资活动现金流出小计 10,830,111.86 10,770,921.86 13,847,869.52 12,920,560.96 投资活动产生的现金流量净额-7,435,011.86-7,375,821.86-13,846,869.52-12,919,560.96三、筹资活动产生的现金流量:吸收投资收到的现金其中:子公司吸收少数股东投资收到的现金取得借款收到的现金 81,310,000.0080,000,000.00153,000,000.00153,000,000.00发行债券收到的现金收到其他与筹资活动有关的现金16,613,413.0216,613,413.02 筹资活动现金流入小计 81,310,000.00 80,000,000.00 169,613,413.02 169,613,413.02 偿还债务支付的现金 73,500,000.00 73,500,000.00 134,213,568.99 134,000,000.00 分配股利、利润或偿付利息支付的现金13,431,043.5513,364,358.805,447,321.685,286,751.23其中:子公司支付给少数股东的股利、利润支付其他与筹资活动有关的现金筹资活动现金流出小计 86,931,043.55 86,864,358.80 139,660,890.67 139,286,751.23 筹资活动产生的现金流量净额-5,621,043.55-6,864,358.8029,952,522.35 30,326,661.79四、汇率变动对现金及现金等价物的影响-9,269.31-27,190.22五、现金及现金等价物净增加额 -14,708,280.29 -14,312,570.31 22,335,024.76 24,580,829.29 加:期初现金及现金等价物余额90,132,956.78 89,319,374.25 64,264,721.69 60,873,423.70 六、期末现金及现金等价物余额75,424,676.4975,006,803.9486,599,746.4585,454,252.994.5 审计报告审计意见: 未经审计桂林广陆数字测控股份有限公司董事长:彭朋 二〇一〇年十月二十九日。