《SAS数据分析范例》(SAS数据集)
- 格式:doc
- 大小:6.20 MB
- 文档页数:48
sas数据分析报告摘要:本文介绍了基于SAS软件进行的数据分析报告。
首先,对数据进行了简要的介绍和处理,并对数据进行了可视化处理。
然后我们使用SAS建立了模型,并对模型进行了评估。
最后,我们对结果进行了解释和分析,并提出了相关的建议。
关键词:SAS,数据分析,模型建立,可视化,结果解释1. 简介SAS是一款广泛应用于数据分析领域的统计软件,其丰富的统计函数和数据可视化功能使得它成为了数据分析师不可或缺的工具。
本文使用SAS对某公司的销售数据进行分析,以帮助公司管理者更好地了解企业的经营情况和预测未来的发展趋势。
2. 数据处理与可视化我们先对数据进行了初步的清理和整理,去除了缺失值和异常值,并对数据进行了标准化处理。
然后,我们使用SAS的数据可视化功能对数据进行了可视化处理,包括制作散点图、直方图和箱线图等,以便更好地了解数据的分布情况和相关性。
3. 模型建立与评估我们基于数据建立了模型,并使用SAS对模型进行了评估。
在模型建立过程中,我们采用了多元线性回归模型,考虑了各个变量之间的相互关系和影响。
在模型评估过程中,我们采用了交叉验证和R方值等指标,对模型的预测能力进行了评估。
4. 结果解释与分析根据模型的预测结果,我们对数据进行了解释和分析,并提出了相关的建议。
我们确定了销售额、广告投放、促销活动等因素对销售额的影响,根据模型结果提出了优化销售策略的建议。
同时,我们进一步分析了销售额的趋势,预测了未来的销售情况,为公司的经营决策提供了有力的支持。
结论:本文基于SAS进行了数据分析报告,利用SAS的数据处理、可视化、模型建立和评估等功能,全面分析了某公司的销售数据。
通过对数据的解释和分析,我们提出了相关的建议,为公司的经营决策提供了参考。
这表明SAS在数据分析领域的应用效果显著,对于企业的发展和决策具有重要的意义。

About the T utorialSAS is a leader in business analytics. Through innovative analytics, it caters to business intelligence and data management software and services. SAS transforms data into insight which can give a fresh perspective to business.Unlike other BI tools available in the market, SAS takes an extensive programming approach to data transformation and analysis rather than a drag-drop-connect approach. This makes it stand out from the crowd with enhanced control over data manipulation. SAS has a very large number of components customized for specific industries and data analysis tasks.AudienceThis tutorial is designed for all those readers who want to read and transform raw data to produce insights for business using SAS. Readers who aspire to become Data Analysts or Data Scientists can also draw benefits from this tutorial.PrerequisitesBefore proceeding with this tutorial, you should have a basic understanding of Computer Programming terminologies. A basic understanding of any of the programming languages will help you understand the SAS programming concepts. Familiarity with SQL will be an added benefit.Disclaimer & CopyrightCopyright 2016 by Tutorials Point (I) Pvt. Ltd.All the content and graphics published in this e-book are the property of Tutorials Point (I) Pvt. Ltd. The user of this e-book is prohibited to reuse, retain, copy, distribute or republish any contents or a part of contents of this e-book in any manner without written consent of the publisher.We strive to update the contents of our website and tutorials as timely and as precisely as possible, however, the contents may contain inaccuracies or errors. Tutorials Point (I) Pvt. Ltd. provides no guarantee regarding the accuracy, timeliness or completeness of our website or its contents including this tutorial. If you discover any errors on our website or inthistutorial,******************************************.T able of ContentsAbout the Tutorial (i)Audience (i)Prerequisites (i)Disclaimer & Copyright (i)Table of Contents (ii)1.SAS – Overview (1)Uses of SAS (1)Types of SAS Software (3)Libraries in SAS (4)2.SAS – Environment (5)Download SAS University Edition (5)The SAS Environment (14)3.SAS – User Interface (15)SAS Main Window (15)Code Autocomplete (16)Program Execution (16)Program Log (17)Program Result (17)Program Tabs (18)4.SAS – Program Structure (22)SAS Program Structure (22)DATA Step (22)PROC Step (23)The OUTPUT Step (23)The Complete SAS Program (24)Program Output (24)5.SAS – Basic Syntax (26)SAS Statements (26)SAS Variable Names (26)SAS Data Set (27)SAS File Extensions (27)Comments in SAS (28)6.SAS – Data Sets (29)SAS Built-In Data Sets (29)Importing External Data Sets (31)7.SAS – Variables (35)SAS Variable Types (35)Use of Variables in SAS Program (36)Using the Variables (37)8.SAS – Strings (39)Declaring String Variables (39)String Functions (40)Accessing Array Values (44)Using the OF operator (44)Using the IN operator (45)10.SAS – Numeric Formats (47)Reading Numeric formats (47)Displaying Numeric formats (48)11.SAS – Operators (50)Arithmetic Operators (50)Logical Operators (51)Comparison Operators (52)Minimum/Maximum Operators (53)Concatenation Operator (54)Operators Precedence (55)12.SAS – Loops (56)Flow Diagram (56)SAS – DO Index Loop (57)SAS – DO WHILE Loop (58)SAS – DO UNTIL Loop (59)13.SAS – Decision Making (60)SAS – IF Statement (61)SAS − IF THEN ELSE Statement (63)SAS − IF THEN ELSE IF Statement (65)SAS − IF-THEN-DELETE Statement (66)14.SAS − Functions (68)Function Categories (68)Mathematical Functions (68)Date and Time Functions (69)Character Functions (70)Truncation Functions (71)Miscellaneous Functions (72)15.SAS − Input Methods (74)List Input Method (74)Named Input Method (75)Column Input Method (76)Formatted Input Method (77)16.SAS – Macros (79)Macro Variables (79)Local Macro Variable (80)Macro Programs (81)Commonly Used Macros (82)Macro % RETURN (83)Macro % END (84)SAS Date Informat (86)SAS Date output format (87)SAS DATA SET OPERATIONS (88)18.SAS − Read Raw Data (89)Reading ASCII (Text) Data Set (89)Reading Delimited Data (90)Reading Excel Data (91)Reading Hierarchical Files (92)19.SAS − Write Data Sets (94)PROC EXPORT (94)Writing a CSV file (95)Writing a Tab Delimited File (96)20.SAS − Concatenate Data Sets (97)21.SAS − Merge Data Sets (103)Data Merging (103)22.SAS − Subsetting Data Sets (107)Subsetting Variables (107)Subsetting Observations (109)23.SAS − Sort Data Sets (111)Reverse Sorting (112)Sorting Multiple Variables (113)24.SAS − Format Data Sets (115)Using PROC FORMAT (116)25.SAS − SQL (118)SQL Create Operation (118)SQL Read Operation (119)SQL SELECT with WHERE Clause (120)SQL UPDATE Operation (121)SQL DELETE Operation (123)26.SAS − ODS (124)Creating HTML Output (124)Creating PDF Output (126)Creating TRF(Word) Output (127)27.SAS − Simulations (129)SAS DATA REPRESENTATION (130)28.SAS − Histograms (131)Simple Histogram (131)Histogram with Curve Fitting (132)29.SAS − Bar Charts (134)Simple Bar chart (134)Stacked Bar chart (135)Clustered Bar chart (136)30.SAS − Pie Charts (138)Simple Pie Chart (138)Pie Chart with Data Labels (140)Grouped Pie Chart (142)31.SAS − Scatter Plots (144)Simple Scatterplot (144)Scatterplot with Prediction (145)Scatter Matrix (147)32.SAS − Boxplots (148)Simple Boxplot (148)Boxplot in Vertical Panels (150)Boxplot in Horizontal Panels (150)SAS BASIC STATISTICAL PROCEDURE (152)33.SAS ─ Arithmetic Mean (153)Mean of a Dataset (153)Mean of Select Variables (154)Mean by Class (155)34.SAS ─ Standard Deviation (156)Using PROC MEANS (156)Using PROC SURVEYMEANS (157)Using BY Option (159)35.SAS ─ Frequency Distributions (161)Single Variable Frequency Distribution (161)Multiple Variable Frequency Distribution (163)Frequency Distribution with Weight (164)36.SAS ─ Cross Tabulations (165)Cross Tabulation of 3 Variables (166)Cross Tabulation of 4 Variables (167)37.SAS ─ T-tests (169)Paired T-test (170)Two Sample T-test (172)38.SAS ─ Correlation Analysis (173)Correlation Between All Variables (175)Correlation Matrix (176)39.SAS ─ Linear Regression (177)40.SAS ─ Bland-Altman Analysis (180)Enhanced Model (182)41.SAS ─ Chi-Square (184)Two-Way Chi-Square (186)42.SAS ─ Fisher's Exact Tests (188)Applying Fisher Exact Test (188)43.SAS ─ Repeated Measure Analysis (190)44.SAS — One Way Anova (193)Applying ANOVA (193)Applying ANOVA with MEANS (194)45.SAS ─ Hypothesis Testing (196)1.SASSAS stands for Statistical Analysis Software. It was created in the year 1960 by the SAS Institute. From 1st January 1960, SAS was used for data management, business intelligence, Predictive Analysis, Descriptive and Prescriptive Analysis etc. Since then, many new statistical procedures and components were introduced in the software.With the introduction of JMP (Jump) for statistics, SAS took advantage of the graphical user interface (GUI) which was introduced by the Macintosh. Jump is basically used for applications like Six Sigma, designs, quality control and engineering and scientific analysis. SAS is platform independent which means you can run SAS on any operating system either Linux or Windows. SAS is driven by SAS programmers who use several sequences of operations on the SAS datasets to make proper reports for data analysis.Over the years SAS has added numerous solutions to its product portfolio. It has solution for Data Governance, Data Quality, Big Data Analytics, Text Mining, Fraud management, Health science etc. We can say that SAS has a solution for every business domain.To have a glance at the list of products available you can visit SAS Components. Uses of SASSAS is basically worked on large datasets. With the help of SAS software, you can perform various operations on data. Some of the operations include:∙Data management∙Statistical analysis∙Report formation with perfect graphics∙Business planning∙Operations research and project management∙Quality improvement∙Application development∙Data extraction∙Data transformation∙Data updation and modificationIf we talk about the components of SAS, then more than 200 components are available in SAS.T ypes of SAS SoftwareLet us now understand the different types of SAS software.∙Windows or PC SAS∙SAS EG (Enterprise Guide)∙SAS EM (Enterprise Miner i.e. for Predictive Analysis)∙SAS Means∙SAS StatsWe use Windows SAS in large organizations and also in training institutes. A few organizations also use Linux but there is no graphical user interface so you have to write code for every query. In Window SAS, there are a lot of utilities available that help the programmers and also reduce the time of writing the codes.A SaS Window has 5 parts.SASLibraries in SASLibraries are storage locations in SAS. You can create a library and save all the similar programs in that library. SAS provides you the facility to create multiple libraries. A SAS library is only 8 characters long.There are two types of libraries available in SAS:2.SASSAS Institute Inc. has released a free SAS University Edition. This provides a platform for learning SAS programming. It provides all the features that you need to learn in BASE SAS programming which in turn enables you to learn any other SAS component.The process of downloading and installing SAS University Edition is very simple. It is available as a virtual machine which needs to be run on a virtual environment. You need to have virtualization software already installed in your PC before you can run the SAS software. In this tutorial, we will be using VMware. The following are the details of the steps to download, setup the SAS environment and verify the installation.Download SAS University EditionSAS University Edition is available for download at the URL SAS University Edition. Please scroll down to read the system requirements before you begin the download. The following screen appears on visiting this URL.Setup virtualization softwareScroll down on the same page to locate the installation step 1. This step provides the links to get the suitable virtualization software. In case you already have any one of these software installed in your system, you can skip this step.Quick start virtualization softwareIn case you are completely new to the virtualization environment, you can familiarize yourself with it by going through the following guides and videos available as step 2. You can skip this step in case you are already familiar.Download the Zip fileIn step 3, you can choose the appropriate version of the SAS University Edition compatible with the virtualization environment you have. It downloads as a zip file with the name similar to unvbasicvapp__9411005__vmx__en__sp0__1.zipUnzip the Zip fileThe zip file above needs to be unzipped and stored in an appropriate directory. In our case, we have chosen the VMware zip file which shows the following files after unzipping.Start the VMware player (or workstation) and open the file which ends with an extension. vmx. The following screen appears. Please notice the basic settings like memory and hard disk space allocated to the vm.Click the Power on this virtual machine alongside the green arrow mark to start the virtual machine. The following screen appears.The following screen appears when the SAS vm is in the state of loading after which the running vm gives a prompt to go to a URL location that will open the SAS environment.Starting SAS studioOpen a new browser tab and load the above URL (which differs from one PC to another). The following screen appears indicating the SAS environment is ready.SASThe SAS EnvironmentOn clicking the Start SAS Studio, we get the SAS environment which by default opens in the visual programmer mode as shown in the following screenshot.We can also change it to the SAS programmer mode by clicking on the dropdown.We are now ready to write the SAS Programs.3.SASSAS Programs are created using a user interface known as SAS Studio. In this chapter, we will discuss the various windows of SAS User Interface and their usage.SAS Main WindowThis is the window you see on entering the SAS environment. The Navigation Pane is to the left. It is used to navigate various programming features. The Work Area is to the right. It is used for writing the code and executing it.Code AutocompleteThis feature helps in getting the correct syntax of the SAS keywords and also provides link to the documentation for the keywords.Program ExecutionThe execution of code is done by pressing the run icon, which is the first icon from left or the F3 button.Program LogThe log of the executed code is available under the Log tab. It describes the errors, warnings or notes about the program’s execution. This is the window where you get all the clues to troubleshoot your code.Program ResultThe result of the code execution is seen in the RESULTS tab. By default, they are formatted as html tables.End of ebook previewIf you liked what you saw…Buy it from our store @ https://。
SAS数据分析工具介绍随着数字化时代的到来,数据分析成为了企业和组织的必修课。
其中,SAS数据分析工具作为全球最为知名的商业分析软件之一,备受广大企业和分析师的青睐。
本文将对SAS数据分析工具进行介绍,包括其特点、应用领域以及使用技巧等方面。
一、SAS数据分析工具特点SAS数据分析工具全称Statistical Analysis System,是由SAS 公司开发的商业分析软件。
其最为显著的特点是其全面的功能性,包括数据管理、统计分析、建模和数据可视化等多个方面。
SAS公司提供多种产品包,以满足不同行业用户的需求。
同时,SAS数据分析工具的语法清晰、规范,并且具有高度的灵活性,能够快速响应用户的分析需求。
基于这些优点,SAS数据分析工具成为了金融、保险、医疗、航空航天等多个行业的分析工具之一。
二、SAS数据分析工具应用领域1. 金融领域金融行业是SAS数据分析工具的主要应用领域之一。
通过SAS 的数据管理、预测建模和可视化等功能,可以实现金融产品的风险管理和营销等方面的应用。
例如,银行可以利用SAS数据分析工具进行授信风险评估、客户身份识别等工作;投资机构可以通过SAS数据分析工具对市场波动进行预测,为投资策略做出决策。
2. 医疗领域医疗行业是另一个SAS数据分析工具的主要应用领域。
医疗机构可以利用SAS数据分析工具对大量的病历数据进行分析,在医疗管理、疾病预测等方面提供帮助。
例如,一些医疗保险公司可以利用SAS数据分析工具进行预测分析,提前预测疾病风险,避免大量的医疗费用支出。
3. 交通领域在航空和铁路等交通领域也有SAS数据分析工具的应用。
航空公司可以利用SAS数据分析工具对飞行数据进行分析,预测飞行状态,并且提高飞行效率。
铁路公司可以利用SAS数据分析工具对列车状态进行监控,在列车故障和延误时作出快速处理。
三、SAS数据分析工具的使用技巧1.了解基础知识使用SAS数据分析工具需要具备相应的基础知识,包括统计学、数学和计算机等相关的知识。
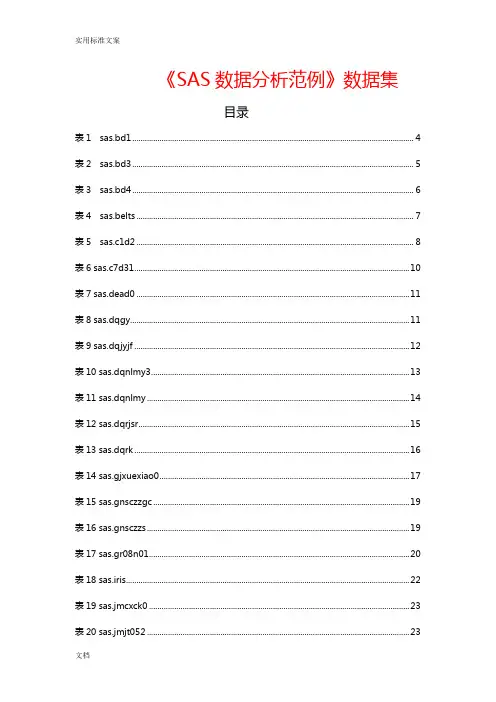
《SAS数据分析范例》数据集目录表1 sas.bd1 (4)表2 sas.bd3 (5)表3 sas.bd4 (6)表4 sas.belts (7)表5 sas.c1d2 (8)表6 sas.c7d31 (10)表7 sas.dead0 (11)表8 sas.dqgy (11)表9 sas.dqjyjf (12)表10 sas.dqnlmy3 (13)表11 sas.dqnlmy (14)表12 sas.dqrjsr (15)表13 sas.dqrk (16)表14 sas.gjxuexiao0 (17)表15 sas.gnsczzgc (19)表16 sas.gnsczzs (19)表17 sas.gr08n01 (20)表18 sas.iris (22)表19 sas.jmcxck0 (23)表20 sas.jmjt052 (23)表22 sas.jmjt054 (25)表23 sas.jmjt055 (26)表24 sas.jmxfsps (27)表25 sas.jmxfspzs0 (28)表26 sas.jmxfzss (29)表27 sas.jmxfzst (30)表28 sas.kscj2 (31)表29 sas.modeclu4 (33)表30 sas.ms8d1 (33)表31 sas.nlmyzzs (34)表32 sas.plates (36)表33 sas.poverty (37)表34 sas.rjnycpcl0 (38)表35 sas.rjsrs (38)表36 sas.sanmao (40)表37 sas.sczz1 (41)表38 sas.sczz06s (41)表39 sas.sczz (43)表40 sas.sczzgc1 (44)表41 sas.sczzgc (45)表42 sas.slgong (46)表44 sas.wire (48)表45 sas.xucps (48)表46 sas.zyncpcl1s (48)表47 sas.zyncpcl2 (49)表48 sas.zyncpcl3 (49)表1 sas.bd1表2 sas.bd3表3 sas.bd4表4 sas.belts表5 sas.c1d2表6 sas.c7d31表7 sas.dead0表8 sas.dqgy表9 sas.dqjyjf表10 sas.dqnlmy3表11 sas.dqnlmy表12 sas.dqrjsr表13 sas.dqrk表14 sas.gjxuexiao0表15 sas.gnsczzgc表16 sas.gnsczzs表17 sas.gr08n01表18 sas.iris表19 sas.jmcxck0表20 sas.jmjt052表21 sas.jmjt053表22 sas.jmjt054表23 sas.jmjt055表24 sas.jmxfsps表25 sas.jmxfspzs0表26 sas.jmxfzss表27 sas.jmxfzst表28 sas.kscj2表29 sas.modeclu4表30 sas.ms8d1表31 sas.nlmyzzs表35 sas.rjsrs表36 sas.sanmao表37 sas.sczz1表38 sas.sczz06s表39 sas.sczz表45 sas.xucps表46 sas.zyncpcl1s表47 sas.zyncpcl2表48 sas.zyncpcl3。
SAS数据分析实验报告摘要:本文使用SAS软件对一组数据集进行了分析。
通过数据清洗、数据变换、数据建模和数据评估等步骤,得出了相关的结论。
实验结果表明,使用SAS软件进行数据分析可以有效地处理和分析大型数据集,得出可靠的结论。
1.引言数据分析在各个领域中都扮演着重要的角色,可以帮助人们从大量的数据中提取有用信息。
SAS是一种常用的数据分析软件,被广泛应用于统计分析、商业决策、运营管理等领域。
本实验旨在探究如何使用SAS软件进行数据分析。
2.数据集描述本实验使用了一个包含1000个样本的数据集。
数据集包括了各个样本的性别、年龄、身高、体重等多种变量。
3.数据清洗在进行数据分析之前,首先需要对数据进行清洗。
数据清洗包括缺失值处理、异常值处理和重复值处理等步骤。
通过使用SAS软件中的相应函数和命令,我们对数据集进行了清洗,确保数据的质量和准确性。
4.数据变换在进行数据分析之前,还需要对数据进行变换。
数据变换包括数据标准化、数据离散化和数据归一化等操作。
通过使用SAS软件中的变换函数和操作符,我们对数据集进行了变换,使其符合分析的需要。
5.数据建模数据建模是数据分析的核心过程,包括回归分析、聚类分析和分类分析等。
在本实验中,我们使用SAS软件的回归、聚类和分类函数,对数据集进行了建模分析。
首先,我们进行了回归分析,通过拟合回归模型,找到了自变量对因变量的影响。
通过回归模型,我们可以预测因变量的值,并分析自变量的影响因素。
其次,我们进行了聚类分析,根据样本的特征将其分类到不同的群组中。
通过聚类分析,我们可以发现样本之间的相似性和差异性,从而做出针对性的决策。
最后,我们进行了分类分析,根据样本的特征判断其所属的类别。
通过分类分析,我们可以根据样本的特征预测其所属的类别,并进行相关的决策。
6.数据评估在进行数据分析之后,还需要对结果进行评估。
评估包括模型的拟合程度、变量的显著性和模型的稳定性等。
通过使用SAS软件的评估函数和指标,我们对数据分析的结果进行了评估。

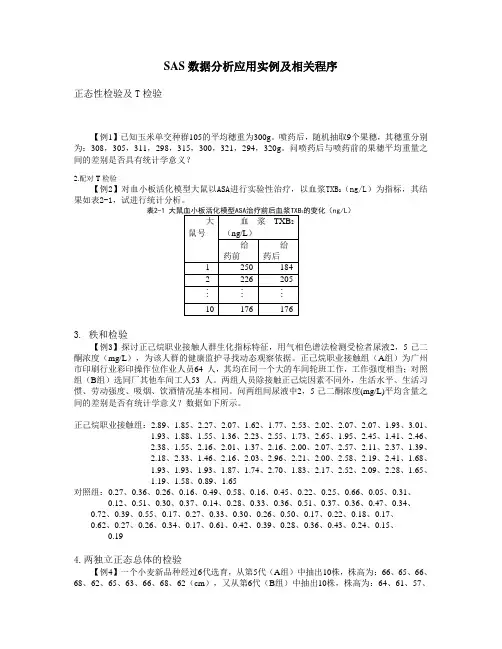
SAS数据分析应用实例及相关程序正态性检验及T检验【例1】已知玉米单交种群105的平均穗重为300g。
喷药后,随机抽取9个果穗,其穗重分别为:308,305,311,298,315,300,321,294,320g。
问喷药后与喷药前的果穗平均重量之间的差别是否具有统计学意义?2.配对T检验【例2】对血小板活化模型大鼠以ASA进行实验性治疗,以血浆TXB2(ng/L)为指标,其结果如表2-1,试进行统计分析。
表2-1 2的变化(ng/L)3. 秩和检验【例3】探讨正己烷职业接触人群生化指标特征,用气相色谱法检测受检者尿液2,5-己二酮浓度(mg/L),为该人群的健康监护寻找动态观察依据。
正己烷职业接触组(A组)为广州市印刷行业彩印操作位作业人员64 人,其均在同一个大的车间轮班工作,工作强度相当;对照组(B组)选同厂其他车间工人53 人。
两组人员除接触正己烷因素不同外,生活水平、生活习惯、劳动强度、吸烟、饮酒情况基本相同。
问两组间尿液中2,5-己二酮浓度(mg/L)平均含量之间的差别是否有统计学意义?数据如下所示。
正己烷职业接触组:2.89、1.85、2.27、2.07、1.62、1.77、2.53、2.02、2.07、2.07、1.93、3.01、1.93、1.88、1.55、1.36、2.23、2.55、1.73、2.65、1.95、2.45、1.41、2.46、2.38、1.55、2.16、2.01、1.37、2.16、2.00、2.07、2.57、2.11、2.37、1.39、2.18、2.33、1.46、2.16、2.03、2.96、2.21、2.00、2.58、2.19、2.41、1.68、1.93、1.93、1.93、1.87、1.74、2.70、1.83、2.17、2.52、2.09、2.28、1.65、1.19、1.58、0.89、1.65对照组:0.27、0.36、0.26、0.16、0.49、0.58、0.16、0.45、0.22、0.25、0.66、0.05、0.31、0.12、0.51、0.30、0.37、0.14、0.28、0.33、0.36、0.51、0.37、0.36、0.47、0.34、0.72、0.39、0.55、0.17、0.27、0.33、0.30、0.26、0.50、0.17、0.22、0.18、0.17、0.62、0.27、0.26、0.34、0.17、0.61、0.42、0.39、0.28、0.36、0.43、0.24、0.15、0.194.两独立正态总体的检验【例4】一个小麦新品种经过6代选育,从第5代(A组)中抽出10株,株高为:66、65、66、68、62、65、63、66、68、62(cm),又从第6代(B组)中抽出10株,株高为:64、61、57、65、65、63、62、63、64、60(cm),问株高性状是否已经达到稳定?5.单因素K(K≥3)水平方差分析【例5】从津丰小麦4个品系中分别随机抽取10株,测量其株高(cm),数据如下所示,问不同品系津丰小麦的平均株高之间的差别是否具有统计学意义?品系0-3-1:63、65、64、65、61、68、65、65、63、64品系0-3-2:56、54、58、57、57、57、60、59、63、62品系0-3-3:61、61、67、62、62、60、67、66、63、65品系0-3-4:53、58、60、56、55、60、59、61、60、596. 双因素无重复试验的方差分析【例6】某医生欲研究回心草各单体成分对试验性心肌缺血血流动力学的影响,选取健康新西兰家兔若干只,体重(2.0±0.3)kg,雌雄不计,将其随机分成9组:胡椒碱高剂量组(100nmol/L)、胡椒碱中剂量组(10nmol/L)、胡椒碱低剂量组(1nmol/L)、胡椒酸甲酯高剂量组(100nmol/L)、胡椒酸甲酯中剂量组(10nmol/L)、胡椒酸甲酯低剂量组(1nmol/L)、咖啡酸甲酯高剂量组(100nmol/L)、咖啡酸甲酯中剂量组(10nmol/L)、咖啡酸甲酯低剂量组(1nmol/L)。

第一课SAS系统简介一.SAS系统1SAS系统的功能SAS系统是大型集成应用软件系统,具有完备的以下四大功能:●数据访问●数据管理●数据分析●数据呈现它是美国软件研究所(SAS Institute Inc.)经多年的研制于1976年推出。
目前已被许多国家和地区的机构所采用。
SAS系统广泛应用于金融、医疗卫生、生产、运输、通信、政府、科研和教育等领域。
它运用统计分析、时间序列分析、运筹决策等科学方法进行质量管理、财务管理、生产优化、风险管理、市场调查和预测等等业务,并可将各种数据以灵活多样的各种报表、图形和三维透视的形式直观地表现出来。
在数据处理和统计分析领域,SAS系统一直被誉为国际上的标准软件系统。
2SAS系统的支持技术在当今的信息时代中,如何有效地利用业务高度自动化所产生的巨量宝贵数据,挖掘出对预测和决策有用的信息,就成为掌握竞争主导权的关键因素。
因此,SAS系统始终致力于应用先进的信息技术和计算机技术对业务和历史数据进行更深层次的加工。
经过二十多年的发展,SAS系统现在是以下三种技术的主要提供者:●数据仓库技术(Data Warehouse)数据仓库是用于支持管理决策过程的面向主题的、集成的、随时间而变化的、持久的(非易失的)数据集合。
通俗的说,可以将数据仓库理解为“将多个生产数据源中的数据按一定规则统一集中起来,并提供灵活的观察分析数据手段,从而为企业制定决策提供事实数据的支持。
”数据仓库最大的用途是能够提供给用户一种全新的方式从宏观或微观的角度来观察多年积累的数据,从而使用户可以迅速地掌握自己企业的经营运转状况、运营成本、利润分布、市场占有率、发展趋势等对企业发展和决策有重要意义的信息,使用户能制定更加准确科学的决策迅速对市场做出反应。
利用数据仓库技术可以使大企业运作的像小企业一样灵活,也可以使小企业像大企业一样规范。
从目前情况来看,许多企业和机构已经建立了相对完善的生产数据库系统。
随着时间的推移,这些系统中积累了大量的历史数据,其中蕴含了许多重要的信息。
SAS统计软件应用案例分析一、概述1966年美国North Carolina州立大学的两位统计学研究生开始研制SAS系统,直至1976年成立了SAS软件研究所,正式推出了SAS软件,1985年推出了微机版SAS。
SAS是用于决策支持的大型集成信息系统,软件系统最早的功能限于统计分析,逐渐成为一个用来管理、分析数据和编写报告的大型集成应用软件系统,具有完备的数据访问、管理、分析、呈现及应用开发等功能,完全超出了单纯统计应用的功能。
SAS系统是一个模块化的组合软件系统,它提供了约20多个模块,各个模块之间既相互独立又相互交融补充。
而我们常用的是以下五个模块:描述统计、假设t检验、单因素方差分析、多因素方差分析和相关与回归分析。
二、案例分析1.描述统计短乳杆菌发酵实验中,为绘制其菌种的生长曲线,在发酵不同时间测定其光密度值。
实验选取了发酵0h、1h、2h、12h、24h这五个生长点,对不同的发酵液进行了光密度值测定如下表:表1.短乳杆菌不同发酵时间光密度值时间/h 光密度值(OD)0 0.1588 0.1599 0.1587 0.1586 0.15891 0.1759 0.1803 0.1818 0.1725 0.18012 0.1745 0.1774 0.1807 0.1886 0.176012 0.6894 0.7106 0.7099 0.7098 0.716024 0.7488 0.7590 0.7392 0.7571 0.7353根据每段时间测定的五个重复平行OD值,计算平均值及标准差、标准误,并相应绘制生长曲线图。
利用SAS软件中的描述统计模块计算,其结果如下:The MEANS ProcedureAnalysis Variable : OD时间样本数Mean Std Dev Std Error Variance CoeffofVariation0 5 0.159 0.0005 0.0002 0.000000277 0.33105291 5 0.178 0.0038 0.0017 0.000014682 2.15119572 5 0.179 0.0056 0.0025 0.000031473 3.126437912 5 0.707 0.0102 0.0045 0.000104968 1.448848824 5 0.748 0.0105 0.0047 0.000110777 1.4073201根据以上数据可以看出,每一组测定值的方差及变异系数都较小,而方差不仅仅表达了样本偏离均值的程度,更是揭示了样本内部彼此波动的程度及每组数据测定时的组内差异,这五组数据其方差都小于0.001,说明可以排除因测量误差带来的组内差异的影响,其数据具有可靠性;变异系数同样是来衡量每组数据中的离散程度,它可以消除单位或者平均数不同对两个或多个数据变异程度比较的影响,更加客观描述了每组数据的可靠性。
【问题设定】能源消耗和固定资产投资是支持一国经济增长的重要因素,而经济增长可以用国内生产总值来表示,所有一国的国内生产总值应分别与其能源消耗量及固定资产投资有正的相关性。
选取中国1980年到2000年各年的国内生产总值、能源消耗量和全社会固定资产投资的数据作为样本。
[分析与解答]国内生产总值Y和能源消耗量E的关系可以用一元线性函数表示为:Y=β0+β1E 其中β1应大于0国内生产总值Y和能源消耗量E及固定资产投资额I的关系可以用二元线性函数表示为:Y=β2+β3E+β4I 其中β3、β4应大于0<!--[if !supportLists]-->1.<!--[endif]-->名称:国内生产总值单位:亿元人民币<!--[if !supportLists]-->2.<!--[endif]-->名称:能源消耗量单位:万吨标准煤<!--[if !supportLists]-->3.<!--[endif]-->名称:全社会固定资产投资额单位:亿元人民币<!--[if !supportLists]-->4.<!--[endif]-->一元线性方程:Y=β0+β1E + ε二元线性方程:Y=β2+β3E+β4I +ε[SAS程序]proc print data=homework;title "Table: Y Data";run;proc gplot data=homework;plot Y*E=1;symbol1 v=dot I=none c=black;title "Scatter Point Plot";run;proc gplot data=homework;plot Y*I=1;symbol1 v=dot I=none c=black;title "Scatter Point Plot";run;proc gplot data=homework;plot Y*year=1 E*year=2 I*year=3/overlay; symbol1 v=dot I=line c=blue;symbol2 v=dot I=line c=black;symbol2 v=dot I=line c=red;title "Time series Plot";run;proc reg data=homework;model Y=E;output out=outcome p=y1;title "Regression";run;proc reg data=homework;model Y=E I;output out=outcome p=y1;title "Regression";run;data simula;merge homework outcome;keep y1 Y E;run;proc gplot data=simula;plot Y*E=1 y1*E=2/overlay;symbol1 v=dot I=none c=blue;symbol2 v=dot I=r c=black;title "Simulation Plot ";run;[程序说明]一元回归结果<!--[if !supportLists]-->l <!--[endif]-->经济合理性检验:β0=0.95863 > 0能源对经济增长的贡献率大于0,故此回归结果符合经济理论解释变差占总变差的82.61%,即拟合值对观测值的拟合程度达到82.61%,故此回归结果拟合优度较好。
《SAS数据分析范例》数据集目录表1 sas.bd1 (3)表2 sas.bd3 (4)表3 sas.bd4 (5)表4 sas.belts (6)表5 sas.c1d2 (7)表6 sas.c7d31 (8)表7 sas.dead0 (9)表8 sas.dqgy (10)表9 sas.dqjyjf (11)表10 sas.dqnlmy3 (12)表11 sas.dqnlmy (13)表12 sas.dqrjsr (14)表13 sas.dqrk (15)表14 sas.gjxuexiao0 (16)表15 sas.gnsczzgc (17)表16 sas.gnsczzs (18)表17 sas.gr08n01 (19)表18 sas.iris (20)表19 sas.jmcxck0 (21)表20 sas.jmjt052 (22)表21 sas.jmjt053 (23)表22 sas.jmjt054 (24)表23 sas.jmjt055 (25)表24 sas.jmxfsps (26)表25 sas.jmxfspzs0 (27)表26 sas.jmxfzss (28)表27 sas.jmxfzst (29)表28 sas.kscj2 (30)表29 sas.modeclu4 (31)表30 sas.ms8d1 (32)表31 sas.nlmyzzs (33)表32 sas.plates (34)表33 sas.poverty (35)表34 sas.rjnycpcl0 (36)表35 sas.rjsrs (37)表36 sas.sanmao (38)表37 sas.sczz1 (39)表38 sas.sczz06s (40)表39 sas.sczz (41)表40 sas.sczzgc1 (42)表41 sas.sczzgc (43)表42 sas.slgong (44)表43 sas.spls0 (45)表44 sas.wire (46)表45 sas.xucps (47)表46 sas.zyncpcl1s (47)表47 sas.zyncpcl2 (48)表48 sas.zyncpcl3 (48)表1 sas.bd1表2 sas.bd3表3 sas.bd4表4 sas.belts表5 sas.c1d2表6 sas.c7d31表7 sas.dead0表8 sas.dqgy表9 sas.dqjyjf表10 sas.dqnlmy3表11 sas.dqnlmy表12 sas.dqrjsr表13 sas.dqrk表14 sas.gjxuexiao0表15 sas.gnsczzgc表16 sas.gnsczzs表17 sas.gr08n01表18 sas.iris表19 sas.jmcxck0表20 sas.jmjt052表21 sas.jmjt053表22 sas.jmjt054表23 sas.jmjt055表24 sas.jmxfsps表25 sas.jmxfspzs0表26 sas.jmxfzss表27 sas.jmxfzst表28 sas.kscj2表29 sas.modeclu4表30 sas.ms8d1表31 sas.nlmyzzs表32 sas.plates表33 sas.poverty表34 sas.rjnycpcl0表35 sas.rjsrs表36 sas.sanmao表37 sas.sczz1表38 sas.sczz06s表39 sas.sczz表40 sas.sczzgc1表41 sas.sczzgc表42 sas.slgong表43 sas.spls0表44 sas.wire表45 sas.xucps表46 sas.zyncpcl1s表47 sas.zyncpcl2 表48 sas.zyncpcl3。
SAS统计分析程序范例proc iml;t={11.1 13.3 20.2};m3=orpol(t,2);print m3;run;Data aa;Input group $ level $ value @@;Cards;B 1 1.920279933B 1 1.994526316B 1 2.362389023B 1 2.276282528B 1 2.261029412B 2 1.962594458B 2 1.825117986B 2 1.881757169B 2 1.782291667B 2 1.909411765B 2 1.88030751B 2 2.154036458B 3 1.846367656B 3 1.904365904B 3 1.787766878B 3 1.779214781B 3 1.729896907B 3 1.823794997A 1 1.979061785A 1 1.752841868A 1 1.754926511A 1 1.882359081A 1 2.103314572A 1 2.13045085A 1 1.820079863A 2 1.846532218A 2 1.878964401A 2 1.678232216A 2 1.704280557A 2 1.673333333A 2 1.920341258A 3 1.65288075A 3 1.571456217A 3 1.564559216A 3 1.663129252A 3 1.671637816A 3 1.747802787;run;一.数据的正态性检验A.SAS统计分析程序------------------------------------------------------------------------------------------------------------------------------------------ title'三种不同添加剂饲喂动物后尿中氨氮的排出量';options ps=500 ls=100;proc import datafile="D:\三种不同添加剂饲喂动物后尿中氨氮的排出量.xls" out=a dbms=excel replace;run;data ax; set a;proc print;proc UNIVARIATE normal; var x; by group;run;-----------------------------------------------------------------------------------------------------------------------------------------B.SAS统计分析相关数据文件三种不同添加剂饲喂动物后尿中氨氮的排出量.xls注:数据文件中group为三种不同的添加剂处理,x为动物尿中氨氮排出量。
SAS数据集SAS系统使用的数据文件称为SAS数据集。
1.SAS的工作环境与SAS程序的结构1.1SAS的工作环境主要有四个窗口:PROGRAM EDIT窗口:用于程序的编写、运行和调试。
LOG窗口:用于监视程序的执行过程,提示程序运行过程的各种信息。
记录了SAS程序运行的全部情况,如程序语句的语法错误,运行中的逻辑错误和警告信息,运行时使用的数据集,建立的库文件,以及运行时间等。
OUTPUT窗口:用于显示程序运行的结果。
显示程序的统计分析结果,还可以在窗口对计算结果进行输入、输出、编辑、修改,以及文件格式的转换等操作。
GRAPH窗口:用于图形展示。
还可以在窗口对图形进行输入、输出、编辑、修改,以及图形格式的转换等操作。
另外,Explorer窗口用于显示SAS库(SAS系统命名的库名与磁盘某文件夹间的关联)及其SAS数据集。
Results窗口用于显示SAS程序运行成功时程序输出结果的目录。
SAS系统还有许多窗口,每个窗口都有其特定功能。
根据需要可以关闭窗口,也可以通过主菜单View的下拉菜单打开或切换窗口。
运行程序的方式有:Submit:运行全部程序。
Submit top line:运行程序的前n行。
程序运行后系统自动删除已经运行完毕的语句,运行结果显示在OUTPUT窗口,执行过程的各种信息显示在LOG窗口。
程序全部运行完毕后PROGRAM EDIT窗口的内容被清除,如果用户希望继续修改或调试该程序,可通过主菜单Locals项下的Recall text选项重新取出程序。
1.2SAS程序的结构SAS程序采用模块化结构,模块之间相互独立,每个模块完成一个任务。
模块可分为两种类型:一种类型是数据模块,数据模块以英文单词data作为开始语句。
另一种是程序模块,程序模块以proc(即英文单词procedure的前四个字母)作为开始语句。
模块中的语句用“;”分隔,同一个语句的不同项之间用一个以上的空格分隔。
《SAS数据分析范例》数据集
目录
表1 sas.bd1 (3)
表2 sas.bd3 (4)
表3 sas.bd4 (5)
表4 sas.belts (6)
表5 sas.c1d2 (7)
表6 sas.c7d31 (8)
表7 sas.dead0 (9)
表8 sas.dqgy (10)
表9 sas.dqjyjf (11)
表10 sas.dqnlmy3 (12)
表11 sas.dqnlmy (13)
表12 sas.dqrjsr (14)
表13 sas.dqrk (15)
表14 sas.gjxuexiao0 (16)
表15 sas.gnsczzgc (17)
表16 sas.gnsczzs (18)
表17 sas.gr08n01 (19)
表18 sas.iris (20)
表19 sas.jmcxck0 (21)
表20 sas.jmjt052 (22)
表21 sas.jmjt053 (23)
表22 sas.jmjt054 (24)
表23 sas.jmjt055 (25)
表24 sas.jmxfsps (26)
表25 sas.jmxfspzs0 (27)
表26 sas.jmxfzss (28)
表27 sas.jmxfzst (29)
表28 sas.kscj2 (30)
表29 sas.modeclu4 (31)
表30 sas.ms8d1 (32)
表31 sas.nlmyzzs (33)
表32 sas.plates (34)
表33 sas.poverty (35)
表34 sas.rjnycpcl0 (36)
表35 sas.rjsrs (37)
表36 sas.sanmao (38)
表37 sas.sczz1 (39)
表38 sas.sczz06s (40)
表39 sas.sczz (41)
表40 sas.sczzgc1 (42)
表41 sas.sczzgc (43)
表42 sas.slgong (44)
表43 sas.spls0 (45)
表44 sas.wire (46)
表45 sas.xucps (47)
表46 sas.zyncpcl1s (47)
表47 sas.zyncpcl2 (48)
表48 sas.zyncpcl3 (48)
表1 sas.bd1
表2 sas.bd3
表3 sas.bd4
表4 sas.belts
表5 sas.c1d2
表6 sas.c7d31
表7 sas.dead0
表8 sas.dqgy
表9 sas.dqjyjf
表10 sas.dqnlmy3
表11 sas.dqnlmy
表12 sas.dqrjsr
表13 sas.dqrk
表14 sas.gjxuexiao0
表15 sas.gnsczzgc
表16 sas.gnsczzs
表17 sas.gr08n01
表18 sas.iris
表19 sas.jmcxck0
表20 sas.jmjt052
表21 sas.jmjt053
表22 sas.jmjt054
表23 sas.jmjt055
表24 sas.jmxfsps
表25 sas.jmxfspzs0
表26 sas.jmxfzss
表27 sas.jmxfzst
表28 sas.kscj2
表29 sas.modeclu4
表30 sas.ms8d1
表31 sas.nlmyzzs
表32 sas.plates
表33 sas.poverty
表34 sas.rjnycpcl0
表35 sas.rjsrs
表36 sas.sanmao
表37 sas.sczz1
表38 sas.sczz06s
表39 sas.sczz
表40 sas.sczzgc1
表41 sas.sczzgc
表42 sas.slgong
表43 sas.spls0
表44 sas.wire
表45 sas.xucps
表46 sas.zyncpcl1s
表47 sas.zyncpcl2 表48 sas.zyncpcl3。