半导体器件原理第三章
- 格式:ppt
- 大小:1.41 MB
- 文档页数:61


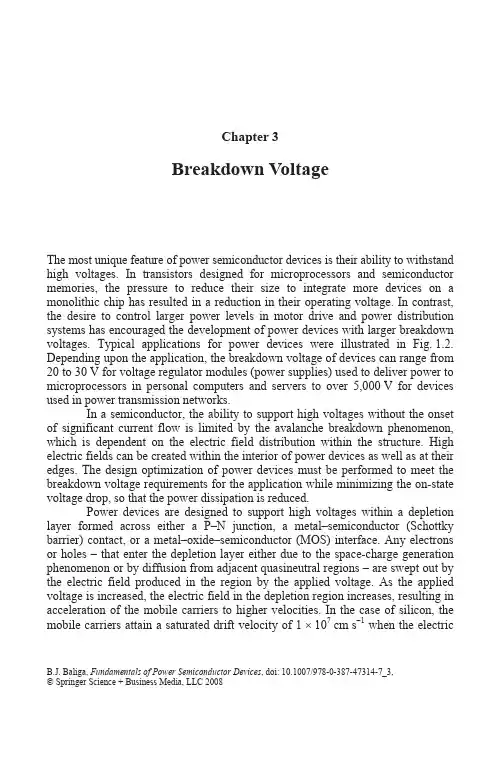
Chapter 3Breakdown VoltageThe most unique feature of power semiconductor devices is their ability to withstand high voltages. In transistors designed for microprocessors and semiconductor memories, the pressure to reduce their size to integrate more devices on a monolithic chip has resulted in a reduction in their operating voltage. In contrast, the desire to control larger power levels in motor drive and power distribution systems has encouraged the development of power devices with larger breakdown voltages. Typical applications for power devices were illustrated in Fig. 1.2. Depending upon the application, the breakdown voltage of devices can range from 20 to 30 V for voltage regulator modules (power supplies) used to deliver power to microprocessors in personal computers and servers to over 5,000 V for devices used in power transmission networks.In a semiconductor, the ability to support high voltages without the onset of significant current flow is limited by the avalanche breakdown phenomenon, which is dependent on the electric field distribution within the structure. High electric fields can be created within the interior of power devices as well as at their edges. The design optimization of power devices must be performed to meet the breakdown voltage requirements for the application while minimizing the on-state voltage drop, so that the power dissipation is reduced.Power devices are designed to support high voltages within a depletion layer formed across either a P–N junction, a metal–semiconductor (Schottky barrier) contact, or a metal–oxide–semiconductor (MOS) interface. Any electrons or holes – that enter the depletion layer either due to the space-charge generation phenomenon or by diffusion from adjacent quasineutral regions – are swept out by the electric field produced in the region by the applied voltage. As the applied voltage is increased, the electric field in the depletion region increases, resulting in acceleration of the mobile carriers to higher velocities. In the case of silicon, the mobile carriers attain a saturated drift velocity of 1 × 107 cm s−1 when the electric B.J. Baliga, Fundamentals of Power Semiconductor Devices, doi: 10.1007/978-0-387-47314-7_3,© Springer Science + Business Media, LLC 200892 FUNDAMENTALS OF POWER SEMICONDUCTOR DEVICESfield exceeds 1 × 10⁵ V cm −1 as discussed in Chap. 2. With further increase in the electric field, the mobile carriers gain sufficient kinetic energy from the electric field, so that their interaction with the lattice atoms produces the excitation of electrons from the valence band into the conduction band. The generation of electron–hole pairs due to energy acquired from the electric field in the semiconductor is referred to as the impact ionization . Since the electron–hole pairs created by impact ionization also undergo acceleration by the electric field in the depletion region, they participate in the creation of further pairs of electrons and holes. Consequently, impact ionization is a multiplicative phenomenon, which produces a cascade of mobile carriers being transported through the depletion region leading to a signi-ficant current flow through it. Since the device is unable to sustain the application of higher voltages due to a rapid increase in the current, it is considered to undergo avalanche breakdown . Thus, avalanche breakdown limits the maximum operating voltage for power devices. In this chapter, the physics of avalanche breakdown is analyzed in relation to the properties of the semiconductor region that is supporting the voltage. After treating the one-dimensional junction, the edge terminations for power devices are described. Power devices require special edge terminations due to their finite area. The electric field at the edges usually becomes larger than in the middle of the device leading to a reduction of the breakdown voltage. Significant effort has been undertaken to develop a good understanding of the electric field enhancement at the edges, and methods have been proposed to mitigate the increase in the electric field. Various edge termination approaches are discussed in detail in this chapter because of their importance to maximizing the performance of power devices.3.1 Avalanche BreakdownThe maximum voltage that can be supported by a power device before the onset of significant current flow is limited by the avalanche breakdown phenomenon. In power devices, the voltage is supported across depletion regions. As discussed in Chap. 2, mobile carriers are accelerated in the presence of a high electric field until they gain sufficient energy to create hole–electron pairs upon collision with the lattice atoms. This impact ionization process determines the current flowing through the depletion region in the presence of a large electric field. An impact ionization coefficient was defined in Chap. 2 as the number of electron–hole pairs created by a mobile carrier traversing 1 cm through the depletion region along the direction of the electric field. The impact ionization coefficients for electrons and holes are a strong function of the magnitude of the electric field as shown in Fig. 2.10.3.1.1 Power Law Approximations for the Impact Ionization CoefficientsIt is convenient to use a power law, referred to as the Fulop’s approximation 1:357F (Si) 1.810E α−=×(3.1)Breakdown Voltage93for the impact ionization coefficients even though they actually increase exponentially with increasing electric field, when performing analytical derivations pertinent to the performance of silicon power devices. The impact ionization coefficient obtained by using this approximation is shown in Fig. 3.1 by the dashed line together with the impact ionization coefficient for electrons in silicon as governed by the Chynoweth’s law (shown by the solid line). In the same manner, it is convenient to use the Baliga’s power law approximation 2 for the impact ionization coefficients for 4H-SiC for analytical derivations:427B (4H-SiC) 3.910.E α−=×(3.2)The impact ionization coefficient obtained by using this approximation is also shown in Fig. 3.1 by the dashed line together with the impact ionization coefficient for holes in 4H-SiC as governed by the Chynoweth’s law (shown by a solid line).various edge terminations on the breakdown voltage. These analytical solutions the design of improved device structures.provide insight into the physics determining the breakdown phenomenon, enabling94 FUNDAMENTALS OF POWER SEMICONDUCTOR DEVICES3.1.2 Multiplication CoefficientThe avalanche breakdown condition is defined by the impact ionization rate becoming infinite. To analyze this, consider a one-dimensional reverse-biased N +/P junction with a depletion region extending primarily in the P-region. If an electron–hole pair is generated at a distance x from the junction, the hole will be swept toward the contact to the P-region, while the electron is simultaneously swept toward the junction with the N + region. If the electric field in the depletion region is large, these carriers will be accelerated until they gain sufficient energy to create electron–hole pairs during collisions with the lattice atoms. Based upon the definitions for the impact ionization coefficients, the hole will create [αp d x ] electron–hole pairs when traversing a distance d x through the depletion region. Simultaneously, the electron will create [αn d x ] electron–hole pairs when traversing a distance d x through the depletion region. The total number of electron–hole pairs created in the depletion region due to a single electron–hole pair initially generated at a distance x from the junction is given by 3,4n p 0()1()d ()d ,x WxM x M x x M x x αα=++∫∫(3.3)where W is the width of the depletion layer. A solution for this equation is given byn p 0()(0)exp ()d ,xM x M x αα⎡⎤=−⎢⎥⎣⎦∫ (3.4)where M (0) is the total number of electron–hole pairs at the edge of the depletionregion. Using this expression in (3.3) with x = 0 provides a solution for M (0):{}1p n p 00(0)1exp ()d d .Wx M x xααα−⎡⎤=−−⎢⎥⎣⎦∫∫ (3.5)Using this expression in (3.4) givesn p 0p n p 00exp ()d ().1exp ()d d xW xx M x x x ααααα⎡⎤−⎢⎥⎣⎦=⎡⎤−−⎢⎥⎣⎦∫∫∫ (3.6)This expression for M (x ), referred to as the multiplication coefficient , allowscalculation of the total number of electron–holes pairs created as a result of the generation of a single electron–hole pair at a distance x from the junction if the electric field distribution along the impact ionization path is known. The avalanche breakdown condition, defined to occur when the total number of electron–hole pairs generated within the depletion region approaches infinity, corresponds to M becoming equal to infinity. This condition is attained by setting the denominator of (3.6) to zero:Breakdown Voltage95{}p n p 0exp ()d d 1.Wxx x ααα⎡⎤−=⎢⎥⎣⎦∫∫(3.7)The expression on the left-hand side of (3.7) is known as the ionization integral .During the analysis of avalanche breakdown in power devices, it is common practice to find the voltage at which the ionization integral becomes equal to unity. If the impact ionization coefficients for electrons and holes are assumed to be equal, the avalanche breakdown condition can be written asd 1.Wx α=∫(3.8)This approach to the determination of the breakdown voltage is valid for power rectifiers and MOSFETs where the current flowing through the depletion region is not amplified. In devices, such as thyristors and IGBTs, the current flowing through the depletion region becomes amplified by the gain of the internal transistors. In these cases, it becomes necessary to solve for the multiplication coefficient instead of using the ionization integral. The multiplication coefficient for a high-voltage P +/N diode is given by 5p 61,1(/BV)M V =− (3.9)where V is the applied reverse bias voltage and BV is the breakdown voltage, while that for an N +/P diode is given byn 41.1(/BV)M V =−(3.10)Thus, the reverse current for a P +/N diode approaches infinity at a faster rate with increasing voltage than for an N +/P diode. This has been related to the diffusion current due to holes from the N-region in the P +/N diode.3.2 Abrupt One-Dimensional DiodePower devices are designed to support high voltages across a depletion layer formed at either a P–N junction, a metal–semiconductor (Schottky barrier) contact, or a metal–oxide–semiconductor (MOS) interface. The onset of the avalanche breakdown condition can be analyzed for all these cases, by assuming that the voltage is supported across only one side of the structure. This holds true for an abrupt P–N junction with a very high doping concentration on one side when compared with the other side. In junctions formed with a shallow depth and a high surface concentration with a lightly doped underlying region of opposite conductivity type, the depletion region extends primarily in the lightly doped region allowing their treatment as abrupt junctions.96 FUNDAMENTALS OF POWER SEMICONDUCTOR DEVICESThe analysis of a one-dimensional abrupt junction can be used to understand the design of the drift region within power devices. The case of a P +/N junction is illustrated in Fig. 3.2 where the P + side is assumed to be very highly doped, so that the electric field supported within it can be neglected. When this junction is reverse biased by the application of a positive bias to the N-region, a depletion region is formed in the N-region together with the generation of a strong electric field within it that supports the voltage. The Poisson’s equation for the N-region is then given by2D 2S Sd d (),d d V EQ x qN x x εε=−=−=−(3.11)where Q (x ) is the charge within the depletion region due to the presence of ionizeddonors, εS is the dielectric constant for the semiconductor, q is the electron charge, and N D is the donor concentration in the uniformly doped N-region.Integration of (3.11) with the boundary condition that the electric field must go to zero at the edge of the depletion region (i.e., at x = W D ) provides the electric field distribution:DD S()().qN E x W x ε=−−(3.12)Breakdown Voltage97The electric field has a maximum value of E m at the P +/N junction (x = 0) and decreases linearly to zero at x = W D . Integration of the electric field distribution through the depletion region provides the potential distribution:2D D S ().2qN x V x W x ε⎛⎞=−⎜⎟⎝⎠(3.13)This equation is obtained by using the boundary condition that the potential is zeroat x = 0 within the P + region. The potential varies quadratically as illustrated in the figure. The thickness of the depletion region (W D ) can be related to the applied reverse bias (V a ) by using the boundary condition:D a (),V W V =(3.14) D W =(3.15)Using these equations, the maximum electric field at the junction can be obtained:m E =(3.16)When the applied bias increases, the maximum electric field approaches values at which significant impact ionization begins to occur. The breakdown voltage is determined by the ionization integral becoming equal to unity:d 1,Wx α=∫(3.17)where α is the impact ionization coefficient discussed in Chap. 2. To obtain a closed-form solution for the breakdown voltage, it is convenient to use the power law for the impact ionization coefficient in place of Chynoweth’s law. Substituting the Fulop’s power law into (3.17) with the electric field distribution given by (3.12), analytical solutions for the breakdown voltage and the corresponding maximum depletion layer width can be derived for silicon:133/4PP DBV (Si) 5.3410N −=× (3.18) and107/8PP D (Si) 2.6710.W N −=×(3.19)In a similar manner, substituting the Baliga’s power law into (3.17) with theelectric field distribution given by (3.12), analytical solutions for the breakdown voltage and the corresponding maximum depletion layer width can be derived for 4H-SiC:98 FUNDAMENTALS OF POWER SEMICONDUCTOR DEVICES153/4PP DBV (4H-SiC) 3.010N −=× (3.20)and117/8PP D (4H-SiC) 1.8210.W N −=×(3.21)The breakdown voltage is plotted in Fig. 3.3 as a function of the doping concentration on the lightly doped side of the junction. It can be seen that the breakdown voltage decreases with increasing doping concentration. It is worth pointing out that it is possible to support a much larger voltage in 4H-SiC when compared with silicon for any given doping concentration. The ratio of the breakdown voltage in 4H-SiC to that in silicon for the same doping concentration is found to be 56.2. It is also obvious from this figure that for a given breakdown voltage, it is possible to use a much higher doping concentration in the drift region for 4H-SiC devices when compared with silicon devices. The ratio of the doping concentration in the drift region for a 4H-SiC device to that for a silicon device with the same breakdown voltage is found to be 200. The maximum depletion width reached at the onset of breakdown is shown in Fig. 3.4 for silicon and 4H-SiC. It can be seen that the thickness of the lightly doped side of the junction must be increased to support larger voltages. For the same doping concentration, the maximum depletion width in 4H-SiC is 6.8 times larger than that in silicon because it can sustain a much larger electric field. However, for a given breakdown voltage, the depletion width in 4H-SiC is smaller than for a silicon device because of the much larger doping concentration in the drift region. This smaller depletion width, in conjunction with the far larger dopingBreakdown Voltage 99 concentration, results in an enormous reduction in the specific on-resistance of the drift region in 4H-SiC when compared with silicon.The onset of the avalanche breakdown for an abrupt parallel-plane junction, as defined by the above equations, is accompanied by a maximum electric field at the junction referred to as the critical electric field for breakdown.100 FUNDAMENTALS OF POWER SEMICONDUCTOR DEVICESCombining (3.16) and (3.18), the critical electric field for breakdown in silicon is given by1/8C D (Si)4010,E N =(3.22)while that for 4H-SiC is given by41/8C D (4H-SiC) 3.310.E N =× (3.23)The critical electric field for 4H-SiC can be compared with that for silicon inFig. 3.5. In both cases, the critical electric field is a weak function of the doping concentration. For the same doping concentration, the critical electric field in 4H-SiC is 8.2 times larger than in silicon. The larger critical electric field in 4H-SiC results in a much larger Baliga’s Figure of Merit (see Chap. 1). The critical electric field is a useful parameter for identifying the onset of avalanche breakdown in power device structures. Due to the very strong dependence of the impact ionization coefficients on the electric field strength, avalanche breakdown can be usually assumed to occur when the electric field within any local region of a power device approaches the critical electric field. However, it is important to note that this provides only an indication of the onset of breakdown and the exact breakdown voltage must be determined by extracting the ionization integral. This is particularly true for devices where the electric field deviates from the triangular shape pertinent to an abrupt parallel-plane junction.3.3 Ideal Specific On-ResistanceThe specific on-resistance of the drift region is related to the breakdown voltage by (1.11) which is repeated here for discussion:2on,sp3S n C4BV .R E εµ= (3.24)An accurate modeling of the specific on-resistance requires taking into account the dependence of the critical electric field and mobility on the doping concentration, which varies as the breakdown voltage is changed. It is possible to do this by computing the doping concentration for achieving a given breakdown voltage and then using the equations for the depletion width and mobility as a function of doping concentration to obtain the specific on-resistance:PPon,sp n D.W R q N µ=(3.25)The specific on-resistance projected for the drift region in 4H-SiC devices by using the above method is compared with that for silicon devices in Fig. 3.6. The values for 4H-SiC are about 2,000 times smaller than for silicon devices for the samebreakdown voltage. This has encouraged the development of unipolar power devices,2 such as Schottky rectifiers and MOSFETs, from 4H-SiC.3.4 Abrupt Punch-Through DiodeIn the case of some power devices, such as P-i-N rectifiers, the resistance of the drift region is greatly reduced during on-state current flow by the injection of a large concentration of minority carriers. In these cases, the doping concentration of the drift region does not determine the resistance to the on-state current flow. Consequently, it is preferable to use a thinner depletion region with a reduceddoping concentration to support the voltage. This configuration for the drift region is called the punch-through design .The electric field distribution for the punch-through design is shown in Fig. 3.7. In comparison with the triangular electric field distribution shown in Fig. 3.2, the electric field for the punch-through design takes a trapezoidal shape. The electric field varies more gradually through the drift region due to its lower doping concentration and then very rapidly with distance within the N + end region due to its very high doping concentration. The electric field at the interface between the drift region and the N + end region is given byDP1m P S ,qN E E W ε=− (3.26)where E m is the maximum electric field at the junction, N DP is the doping concentration in the N-type drift region, and W P is the width of the N-type drift region.The voltage supported by the punch-through diode is given bym 1PT P 2E E V W +⎛⎞=⎜⎟⎝⎠ (3.27)if the small voltage supported within the N + end region is neglected. The punch-through diode undergoes avalanche breakdown when the maximum electric field (E m ) becomes equal to the critical electric field (E C ) for breakdown. Using this condition in (3.27) together with the field distribution in (3.26), the breakdown voltage for the punch-through diode is given by2DP P PT C P S BV .2qN W E W ε=− (3.28)The breakdown voltages calculated using this relationship are shown in Fig. 3.8 for silicon punch-through diodes with various thicknesses for the drift region. In performing these calculations, the change in the critical electric field with doping concentration was taken into account. For any doping concentration for the drift region, the breakdown voltage for the punch-through diode is reduced due to the truncation of the electric field at the N + end region. The breakdown voltage becomes smaller as the thickness of the drift region is reduced. From the point of view of designing the drift region for a P-i-N rectifier, it is possible to obtain a breakdown voltage of 1,000 V with a drift region thickness of about 50 µm. In contrast, a drift region thickness of 80 µm would be required in the nonpunch-through case. This reduced drift region thickness with the punch-through design is beneficial not only for reducing the on-state voltage drop but also for reducing the stored charge and consequently the reverse recovery power loss as discussed later in the book.A similar analysis for the breakdown voltages can be performed for punch-through diodes fabricated from 4H-SiC with various thicknesses for the drift region (Fig. 3.9). In performing these calculations, the change in the critical electric field with doping concentration, as described by (3.23), must be taken into account. In comparison with silicon punch-through diodes, a much higher (∼10 times) doping concentration can be used in the drift region for 4H-SiC to achievethe punch-through design with a given thickness for the drift region. From the point of view of designing the drift region for a P-i-N rectifier, it is possible to obtain a breakdown voltage of 10,000 V with a drift region thickness of about 50 µm in 4H-SiC. In contrast, a drift region thickness of 80 µm would be required in the nonpunch-through case. This reduced drift region thickness with the punch-through design is beneficial for reducing the on-state voltage drop. However, the minority carrier lifetime in 4H-SiC has been found to be low resulting in poor conductivity modulation of the drift region. It is therefore advisable to maintain a high doping concentration in the drift region for P-i-N rectifiers fabricated from 4H-SiC.3.5 Linearly Graded Junction DiodePower devices fabricated using junctions with high surface doping concentration and shallow thickness tend to behave like the abrupt junction diodes that were discussed in the previous sections. Power devices, such as thyristors, that are designed to support very high voltages (above 2,000 V) rely upon junctions with low surface concentration and large depth to enhance the blocking voltage capability. In addition, power devices with low (<50 V) blocking voltages, such as low-voltage power MOSFETs, require drift regions with relatively high doping concentrations that are comparable with the doping level on the diffused side of thejunction. A significant fraction of the reverse bias voltage is supported within the diffused side of the junction in this case as well.These types of junctions can be analyzed by assuming a linearly graded doping profile in the vicinity of the junction. A typical doping profile for a diffused junction diode is illustrated in Fig. 3.10. For diffused junctions, it is customary to plot the profile with the doping concentration displayed using a logarithmic scale as shown in the upper part of the figure. Due to the compensation of the N-region by the P-type dopant in the vicinity of the junction, the profile has a linear net doping distribution as illustrated in the lower portion of the figure. The diffused junction can therefore be treated as a combination of a linearly graded junction and a uniformly doped junction.If the linear doping grading is sufficiently steep, the maximum electric field at the junction can reach the critical electric field with the depletion region confined to this portion of the doping profile. The linearly graded junction is illustrated in Fig. 3.11 together with the electric field and potential distributions. Note that the depletion region extends to both side of the metallurgical junction by a distance W. With a positive voltage applied to the N-region, the junction becomes reverse biased with a net negative charge on the P-side due to the ionized acceptors having a greater concentration than the donors, while a net positive charge develops on the N-side due to the ionized donors having a greater concentration than the acceptors. The concentration of the net charge varies linearly with distance with a grade constant G.The breakdown voltage of this linearly graded junction can be analyzed by using the following charge distribution profile in Poisson’s equation:().Q x qGx = (3.29) Applying this charge distribution to the Poisson’s equation gives2S S d d ().d d V E Q x qGx x x εε−=−=−= (3.30)Integration of this equation with the boundary condition that the electric field must be zero at the edge of the depletion region (x = W ) provides the electric field distribution:22S()().2qG E x x W ε=− (3.31) The electric field varies parabolically with distance with its maximum value at the junction given by2m S .2qGW E ε= (3.32)Integration of the electric field distribution through the depletion region with the boundary conditions that the potential is zero at x = −W on the P-side of the junction yields323S ().326qG W W x x V x ε⎛⎞=+−⎜⎟⎝⎠ (3.33)This voltage distribution is shown at the bottom of Fig. 3.11. The depletion layer width (W ) on both sides of the junction can be obtained by using the boundary condition that the voltage on the N-side of the junction is equal to the applied bias (V a ):1/3S a 3.V W qG ε⎛⎞=⎜⎟⎝⎠ (3.34)In the case of devices, such as power MOSFETs, the extension of the depletion layer on the diffused side of the junction can lead to reach-thorough breakdown at well below the avalanche breakdown voltage. The depletion width calculated by using (3.34), based upon approximation of the diffused junction by a linearly graded junction, provides an analytical approach to designing the width of the P-base region.A closed-form analytical solution for the breakdown voltage of the linearly graded junction can be obtained by determination of the voltage at which theimpact ionization integral becomes equal to unity. Using the ionization integral given by (3.17) with Fulop’s approximation for the impact ionization coefficients and the electric field distribution given by (3.31),73522S 1.810()d 1.2W W qG x W x ε−−⎡⎤×−=⎢⎥⎣⎦∫ (3.35)The solution for this equation provides the depletion width at the point of breakdown for the linearly graded junction:57/15CL 9.110.W G −=× (3.36)Using this depletion width in (3.34), the breakdown voltage for the linearly graded junction is found to be given by92/5L BV 9.210.G −=× (3.37)As illustrated by the electric field distribution in Fig. 3.10, the diffused junction diode usually behaves as a combination of a linearly graded junction and an abrupt junction with uniform doping on the lightly doped side. The extension of the depletion region into the diffused side of the junction enhances the breakdown voltage to above that derived earlier for the abrupt parallel-plane junction because of the additional voltage that is supported on the diffused side of the junction. This can be taken advantage of during the design of low-voltage (<30 V) power MOSFETs.3.6 Edge TerminationsAll semiconductor devices have a finite size, which is achieved by sawing through the wafers to produce the chips that go into packages. The sawing of wafers, performed by using diamond-coated blades, produces severe damage to the crystal. In the case of power devices, if the sawing is performed through the junction that must support a high voltage, the crystal damage creates a high leakage current that degrades the breakdown voltage and its stability with respect to time. This problem can be addressed by using special junction terminations around the edges of the power devices, so that the depletion regions of the high-voltage junctions do not intersect with the saw lanes where the damage is located. Another approach that can be used to control and preserve a high breakdown voltage is by shaping the surface of the edges of the device. The earliest method for shaping the edges was by mesa etching. Subsequently, the beveling of the edges of wafers was found to be very effective in preserving the breakdown voltage of high-voltage power rectifiers and thyristors. With the widespread availability of ion implantation for the fabrication of power devices in the 1980s, the use of a lightly doped zone at the edges of junctions has been found to be effective in achieving high breakdown。


第3章 半导体超晶格3.1 半导体超晶格基本结构3.2 超晶格的应用举例3.1 半导体超晶格基本结构所谓的超晶格,是由几种成分不同或掺杂不同的超薄层周期性地堆叠起来而构成地一种特殊晶体。
超薄层堆叠地周期(称为超晶格地周期)要小于电子的平均自由程,各超薄层的宽度要与电子的德布罗意波长相当。
其特点为在晶体原来的周期性势场之上又附加了一个可以人为控制的超晶格周期势场,是一种新型的人造晶体。
超晶格的分类(一)复合超晶格利用异质结构,重复单元是由组分不同的半导体薄膜形成的超晶格称为复合超晶格,又称为组分超晶格。
按照能带不连续结构的特点可将这个类型超晶格分为四类:第Ⅰ类超晶格、第Ⅱ类错开超晶格、第Ⅱ类倒转型超晶格和第Ⅲ类超晶格。
(1) 第Ⅰ类超晶格(GaAs/AlGaAs)GaAs 材料的见地完全包含在AlGaAs 的能隙之中,电子和空穴都位于窄带隙材料的势阱中v c g E E E ∆+∆=∆x 247.1E g =∆,与Al 的组分x 成正比。
(2) 第Ⅱ类 —— 错开型超晶格(GaSbAs/InGaAs )两个带隙互相错开,一个价带底在另一个价带底的下面。
电子和空穴分别处于两个不同的材料中形成了真实空间的间接带隙半导体(3) 第Ⅱ类 —— 倒转型超晶格(InAs/GaSb )一个导带底下降到另一个价带底之下。
电子和空穴可能并存于同一个能区中,形成电子-空穴系统Ec1与Ec2能量相差一个Es ,前者的导带与后者的价带部分重叠,从而可能发生从半导体到金属的转变(4) 第Ⅲ类超晶格(HgTe/CdTe)宽带隙半导体CdTe 和零带隙半导体HgTe 构成的超晶格。
只有当超晶格的周期小于某一定值时才具有半导体特性,否则具有半金属特性。
超晶格能隙差由最低导带子能带和价带子能带的间距决定,价带能量不连续值近似为零,导带能量不连续值近似等于两种材料能隙之差。
(二)掺杂超晶格利用超薄层材料外延技术(MBE 或MOCVD )生长具有量子尺寸效应的同一种半导体材料时,交替地改变掺杂类型的方法(即一层掺入N 型杂质,一层掺入P 型杂质),即可得到掺杂超晶格,又称为调制惨杂超晶格。