Weibull 分布
- 格式:docx
- 大小:31.89 KB
- 文档页数:1
weibull函数Weibull函数是一种常见的概率分布函数,在工程、生物学、环境科学等领域都有广泛的应用。
本文将围绕Weibull函数展开详细的讲解。
一、Weibull函数的概念Weibull函数是von Weibull于1951年提出的一种数学函数,具有如下公式:f(x) = (k/λ) * [(x/λ)^(k-1)] * exp[-(x/λ)^k] (x>=0)其中,k和λ是Weibull函数的参数,k称为形状参数,反映随机变量的分布形状;λ称为尺度参数,反映随机变量的尺度大小。
二、Weibull函数的特点1、Weibull函数是典型的右偏分布,也称为正倾斜分布,这是由于右侧长尾的存在导致的。
2、Weibull函数可用于刻画各种不同类型的现象,如失效时间、断裂强度等。
3、Weibull函数在实际应用中具有广泛的应用领域,如可靠性分析、质量控制、产品寿命预测等。
三、Weibull函数的参数估计在实际应用中,我们需要估算Weibull函数的参数,目前常用的方法有极大似然估计和最小二乘估计。
1、极大似然估计极大似然估计是一种常用的参数估计方法,其原理是在已知样本数的情况下,通过求解最大的似然函数值,来获得Weibull函数的参数估计值。
2、最小二乘估计最小二乘估计是通过最小化误差平方和的方法来获得Weibull函数的参数估计值。
四、Weibull函数的应用Weibull函数是一种常见的概率分布函数,其应用范围非常广泛。
下面列举几个实际应用案例:1、可靠性分析Weibull函数可以用来描述机械零件的失效时间分布,通过对失效时间的估计,可以预测产品的寿命,并制定相关的维修和更换计划。
2、产品寿命预测基于Weibull函数的特点,可以通过对产品失效数据的分析得到不同时间段内的失效概率和相关的可靠性数据,从而预测产品的寿命。
3、质量控制Weibull函数可以用来描述产品的质量控制数据,通过对数据的分析,可以判断产品整体质量水平,及时发现和解决质量问题。
Python威布尔分布曲线拟合1. 介绍威布尔分布是一种描述时间或寿命数据的统计分布,广泛应用于可靠性工程、医学、环境科学等领域。
在实际应用中,我们经常需要对数据进行威布尔分布的拟合,以了解数据的分布特征并进行进一步的分析。
2. 什么是威布尔分布威布尔分布是一种连续概率分布,其概率密度函数为:f(x;λ, k) = (k/λ) * (x/λ)^(k-1) * exp(-(x/λ)^k),其中x≥0,λ>0,k>0。
λ和k 分别为威布尔分布的尺度参数和形状参数,决定了分布的特征。
3. Python中的威布尔分布拟合在Python中,我们可以使用SciPy库中的stats模块来进行威布尔分布的拟合。
我们需要导入相应的库:```pythonimport numpy as npimport matplotlib.pyplot as pltfrom scipy import stats```4. 生成数据为了进行威布尔分布的拟合,我们首先需要准备一组数据。
假设我们有一组寿命数据,我们可以使用NumPy库生成符合威布尔分布的随机数据:```pythondata = np.random.weibull(k, size=1000)```5. 进行拟合有了数据之后,我们就可以使用stats模块中的weibull_min类来进行拟合:```pythonparams = stats.weibull_min.fit(data, loc=0)```6. 绘制拟合曲线我们可以利用拟合得到的参数来绘制威布尔分布的概率密度函数曲线:```pythonx = np.linspace(0, 5, 100)y = stats.weibull_min.pdf(x, *params)plt.plot(x, y, 'r-', lw=2)plt.hist(data, bins=30, density=True, alpha=0.6)plt.show()```7. 结论通过以上步骤,我们就可以在Python中实现对威布尔分布的数据拟合,并得到拟合曲线。

威布尔概率分布及应用威布尔概率分布是一种常用的统计分布模型,适用于描述正向偏斜的连续随机变量的概率分布。
在工程学中,威布尔分布经常用来模拟和分析可靠性和寿命数据。
下面将详细介绍威布尔概率分布及其应用。
1. 威布尔概率分布的定义与特性:威布尔概率密度函数的表达式为:f(x) = (a/b)((x/b)^(a-1)) * exp(-(x/b)^a)其中,a和b均为正实数,是概率分布的参数。
该概率密度函数主要用来描述随机变量X的寿命分布。
威布尔分布的累积分布函数为:F(x) = 1 - exp(-(x/b)^a)威布尔分布具有如下特性:(1) 当a=1时,威布尔分布退化为指数分布。
(2) 当a>1时,威布尔分布具有右偏斜的特性。
(3) 威布尔分布的均值为b * Γ(1 + 1/a),其中Γ表示伽玛函数。
(4) 威布尔分布的方差为b^2 * (Γ(1 + 2/a) - (Γ(1 + 1/a))^2)。
2. 威布尔概率分布的应用:(1) 可靠性分析:威布尔分布常用于可靠性分析中,可以通过威布尔分布来描述产品的寿命分布。
通过分析得到的威布尔分布,可以计算产品在某个时间点的可靠性,确定其在给定时间段内的失效概率,并进一步寻找改进措施,提高产品的可靠性。
(2) 寿命数据分析:威布尔分布也广泛应用于对某些机械设备、材料或系统的寿命数据进行建模与分析。
通过对实际寿命数据进行威布尔分布拟合,可以更准确地预测设备或系统在未来某个时间段内的失效概率,帮助制定相应的维修和更换计划。
(3) 临床试验:在医学和生物学中,临床试验数据经常具有右偏性,且描述的是某种事件或现象的寿命。
因此,威布尔分布在临床试验数据分析中的应用十分常见。
通过拟合试验数据得到的威布尔分布可以为研究人员提供反映疾病发展或治疗效果的信息,从而指导临床实践和决策。
(4) 金融风险管理:在金融领域,威布尔分布可以用来对风险事件的发生概率进行建模,如市场波动、信用违约等。
威布尔分布的概率密度函数
威布尔分布是概率统计学中一种重要的概率分布,它常用于描述可靠性分析、生存分析等领域。
威布尔分布的概率密度函数为:
f(x) = (a/λ) * (x/λ)^(a-1) * e^(-(x/λ)^a) 其中,a和λ是分布的参数,a称为形状参数,λ称为尺度参数。
威布尔分布的累积分布函数为:
F(x) = 1 - e^(-(x/λ)^a)
威布尔分布的特点是随着x的增大,概率密度逐渐减小,但是减小的速率逐渐变缓。
因此,威布尔分布常用于描述在使用寿命较长的物品中,设备失效的概率随时间增加的规律。
在可靠性分析中,威布尔分布常用于估计设备的失效概率曲线和寿命分布。
- 1 -。
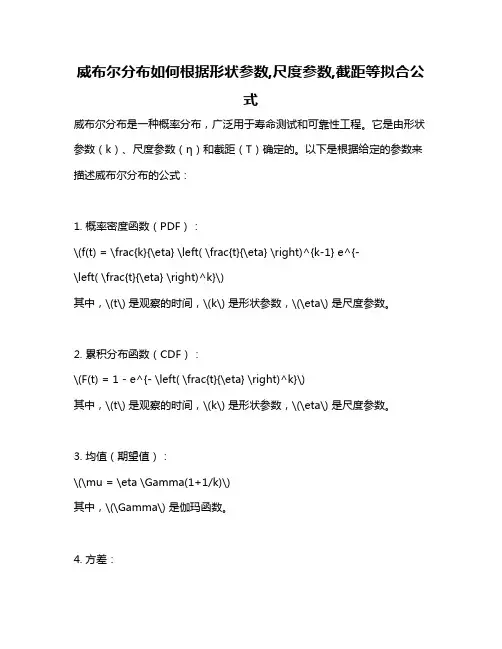
威布尔分布如何根据形状参数,尺度参数,截距等拟合公
式
威布尔分布是一种概率分布,广泛用于寿命测试和可靠性工程。
它是由形状参数(k)、尺度参数(η)和截距(T)确定的。
以下是根据给定的参数来描述威布尔分布的公式:
1. 概率密度函数(PDF):
\(f(t) = \frac{k}{\eta} \left( \frac{t}{\eta} \right)^{k-1} e^{-
\left( \frac{t}{\eta} \right)^k}\)
其中,\(t\) 是观察的时间,\(k\) 是形状参数,\(\eta\) 是尺度参数。
2. 累积分布函数(CDF):
\(F(t) = 1 - e^{- \left( \frac{t}{\eta} \right)^k}\)
其中,\(t\) 是观察的时间,\(k\) 是形状参数,\(\eta\) 是尺度参数。
3. 均值(期望值):
\(\mu = \eta \Gamma(1+1/k)\)
其中,\(\Gamma\) 是伽玛函数。
4. 方差:
\(\sigma^2 = \eta^2 \left[ \Gamma(1+2/k) - \Gamma^2(1+1/k)
\right]\)
其中,\(\Gamma\) 是伽玛函数。
这些公式可以根据给定的参数(形状参数、尺度参数和截距)进行拟合。
在实践中,通常会使用最大似然估计法(MLE)或其它统计方法来估计这些参数。
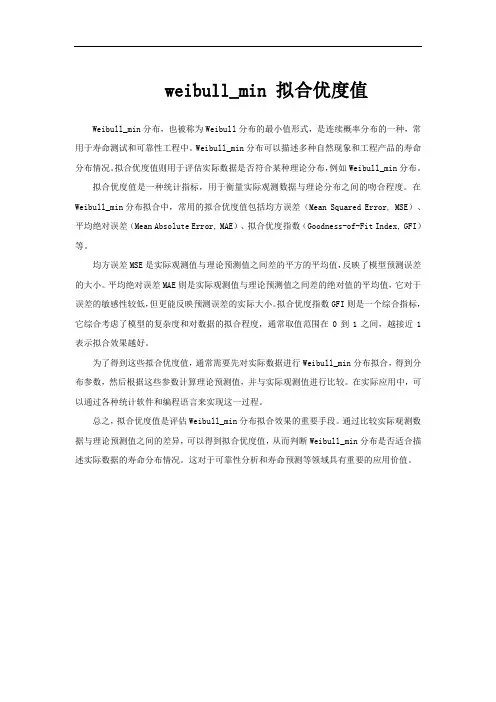
weibull_min 拟合优度值Weibull_min分布,也被称为Weibull分布的最小值形式,是连续概率分布的一种,常用于寿命测试和可靠性工程中。
Weibull_min分布可以描述多种自然现象和工程产品的寿命分布情况。
拟合优度值则用于评估实际数据是否符合某种理论分布,例如Weibull_min分布。
拟合优度值是一种统计指标,用于衡量实际观测数据与理论分布之间的吻合程度。
在Weibull_min分布拟合中,常用的拟合优度值包括均方误差(Mean Squared Error, MSE)、平均绝对误差(Mean Absolute Error, MAE)、拟合优度指数(Goodness-of-Fit Index, GFI)等。
均方误差MSE是实际观测值与理论预测值之间差的平方的平均值,反映了模型预测误差的大小。
平均绝对误差MAE则是实际观测值与理论预测值之间差的绝对值的平均值,它对于误差的敏感性较低,但更能反映预测误差的实际大小。
拟合优度指数GFI则是一个综合指标,它综合考虑了模型的复杂度和对数据的拟合程度,通常取值范围在0到1之间,越接近1表示拟合效果越好。
为了得到这些拟合优度值,通常需要先对实际数据进行Weibull_min分布拟合,得到分布参数,然后根据这些参数计算理论预测值,并与实际观测值进行比较。
在实际应用中,可以通过各种统计软件和编程语言来实现这一过程。
总之,拟合优度值是评估Weibull_min分布拟合效果的重要手段。
通过比较实际观测数据与理论预测值之间的差异,可以得到拟合优度值,从而判断Weibull_min分布是否适合描述实际数据的寿命分布情况。
这对于可靠性分析和寿命预测等领域具有重要的应用价值。
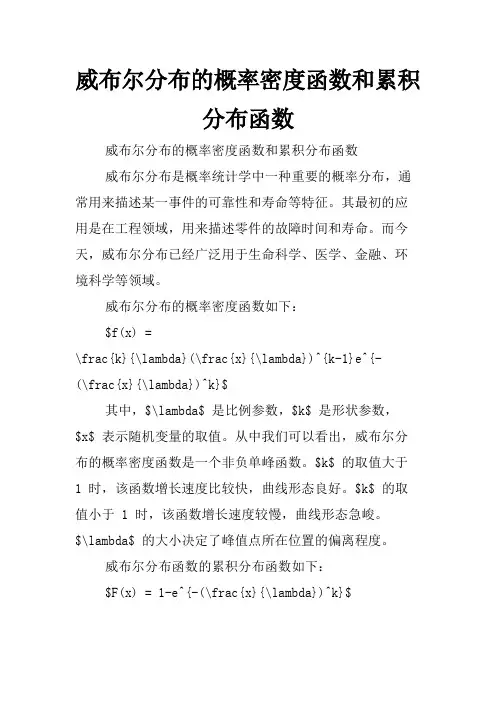
威布尔分布的概率密度函数和累积分布函数 威布尔分布的概率密度函数和累积分布函数 威布尔分布是概率统计学中一种重要的概率分布,通常用来描述某一事件的可靠性和寿命等特征。其最初的应用是在工程领域,用来描述零件的故障时间和寿命。而今天,威布尔分布已经广泛用于生命科学、医学、金融、环境科学等领域。 威布尔分布的概率密度函数如下: $f(x) = \frac{k}{\lambda}(\frac{x}{\lambda})^{k-1}e^{-(\frac{x}{\lambda})^k}$ 其中,$\lambda$ 是比例参数,$k$ 是形状参数,$x$ 表示随机变量的取值。从中我们可以看出,威布尔分布的概率密度函数是一个非负单峰函数。$k$ 的取值大于 1 时,该函数增长速度比较快,曲线形态良好。$k$ 的取值小于 1 时,该函数增长速度较慢,曲线形态急峻。$\lambda$ 的大小决定了峰值点所在位置的偏离程度。 威布尔分布函数的累积分布函数如下: $F(x) = 1-e^{-(\frac{x}{\lambda})^k}$ 我们可以将其解释为,当随机变量小于等于 $x$ 时,其概率为 $F(x)$。由累积分布函数可知,当 $x=0$ 时,$F(0)=0$;当 $x\to \infty$ 时,$F(x)$ 趋近于 1,因此威布尔分布函数是一个右端有界的分布。 威布尔分布的期望和方差分别为: $E(X) = \lambda\Gamma(1+\frac{1}{k})$ $Var(X) = \lambda^2[\Gamma(1+\frac{2}{k})-(\Gamma(1+\frac{1}{k}))^2]$ 其中,$\Gamma(\cdot)$ 是伽马函数。从式子中可以看出,当 $k>1$ 时,期望和方差随着 $\lambda$ 的增加而增加;当 $k<1$ 时,期望和方差随着 $\lambda$ 的增加而减小。 威布尔分布的应用 威布尔分布常常被用来进行寿命分析,特别是在可靠性分析、风险分析方面得到广泛应用。一般而言,威布尔分布可以用来描述由于不同原因而导致的故障或失效,如设备老化、电子器件故障、人体器官失效等。另外,威布尔分布也常被用来描述随机变量之间的关系。 例如,在风险分析方面,威布尔分布常常用来度量时间至故障(或失效)的概率分布。在投资中,威布尔分布则可以用来评估股票、债券等金融产品的风险。在工程领域中,威布尔分布可以被用来评估特定零件或者设备的寿命。 总结 威布尔分布是一种广泛应用于概率统计学中的概率分布,其概率密度函数和累积分布函数形态特别适合用来描述某一事件的可靠性和寿命等特征。威布尔分布的形状参数 $k$ 和比例参数 $\lambda$ 分别影响了其概率密度函数的形态和峰值位置的偏移程度。威布尔分布在可靠性分析、风险分析、股票、债券等金融产品的评估、工程领域等都有广泛应用。
matlab威布尔分布函数代码-回复Matlab威布尔分布函数代码的解释与应用威布尔分布函数(Weibull distribution function)是一种连续概率分布函数,广泛应用于可靠性工程和可靠性分析中。
在Matlab中,我们可以使用内置的威布尔分布函数代码来计算和绘制威布尔分布函数的概率密度函数(Probability Density Function,PDF)、累积分布函数(Cumulative Distribution Function,CDF)以及逆累积分布函数(Inverse Cumulative Distribution Function,ICDF)。
在本文中,我们将一步一步介绍如何使用Matlab中的威布尔分布函数代码,并探讨其在实际应用中的意义和重要性。
首先,我们需要了解威布尔分布函数的数学定义及其参数。
威布尔分布函数的概率密度函数(PDF)可以表示为:f(x) = (k/λ) * (x/λ)^(k-1) * e^(-(x/λ)^k)其中,k和λ是威布尔分布函数的形状参数和尺度参数,分别控制着分布函数的形状和尺度。
为了方便计算和绘制,我们可以使用Matlab中的威布尔分布函数代码。
在Matlab中,我们可以使用" wblpdf "函数计算威布尔分布函数的概率密度函数(PDF)。
下面是一个示例代码:matlabx = 0:0.01:10; 定义x轴的取值范围k = 2; 定义形状参数klambda = 2; 定义尺度参数λy = wblpdf(x, k, lambda); 计算概率密度函数(PDF)plot(x, y) 绘制PDF曲线xlabel('x') x轴标签ylabel('f(x)') y轴标签title('Weibull Distribution PDF') 图表标题上述代码中,我们首先定义了x轴的取值范围,从0到10,并以0.01为步长。
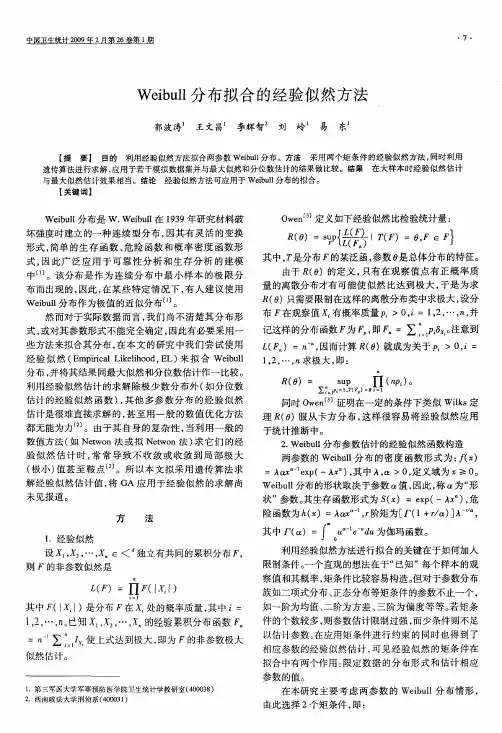
基于Weibull分布的缺口件多轴疲劳寿命模型及可靠性研究基于Weibull分布的缺口件多轴疲劳寿命模型及可靠性研究疲劳寿命是材料工程和结构工程中一个重要的研究方向。
对于需要长时间使用的零部件来说,疲劳失效可能是其最重要的失效方式之一。
而在复杂多轴载荷下,缺口件也会经受着更高强度的应力和更复杂的载荷历程,因此多轴疲劳的研究变得尤为重要。
Weibull分布是一种常用的概率分布函数,广泛应用于可靠性分析和寿命预测。
在研究多轴疲劳寿命时,我们可以将Weibull分布应用于缺口件的失效寿命分析。
而缺口对材料的疲劳寿命有着显著的影响,因为在缺口处应力集中,进而导致应力水平的增加,加剧了疲劳损伤。
在进行多轴疲劳寿命模型建立时,首先需要对材料进行疲劳试验。
通过在实验中引入不同形状和大小的缺口,可以模拟多种多轴载荷下材料的应力状态。
试验结果表明,多轴载荷下的疲劳寿命相较于单轴载荷会显著减少。
因此,建立能够较好预测缺口件多轴疲劳寿命的模型变得重要。
基于Weibull分布的缺口件多轴疲劳寿命模型可以用数学公式来描述。
首先,我们需要确定Weibull分布的参数,即形状参数和尺度参数。
形状参数反映了分布的偏斜程度,而尺度参数则反映了分布的尺度大小。
通过对多个试样进行疲劳试验,我们可以使用最大似然估计法来估计这两个参数。
模型的核心在于将应力加载条件与Weibull分布相结合。
基于已有多轴疲劳试验数据,我们可以建立应力水平与疲劳寿命之间的关系,以此来推导出适用于缺口件多轴疲劳寿命的Weibull分布参数。
除了建立缺口件多轴疲劳寿命模型,我们还可以利用该模型进行可靠性分析。
可靠性分析可以帮助我们评估零部件在特定设计寿命下的可靠性水平,以及预测其失效概率。
通过对Weibull分布进行概率计算,我们可以得到失效概率随时间变化的曲线,进而进行可靠性评估。
总之,基于Weibull分布的缺口件多轴疲劳寿命模型及可靠性研究是一个重要的研究方向。
基于weibull分布的土-结构接触面统计损伤软化本构模型该模型是基于Weibull分布的土-结构接触面统计损伤软化本构模型。
首先,该模型考虑了土-结构接触面的损伤和软化,通过统计学的方法来描述这种损伤过程。
模型采用Weibull分布作为损伤因子的分布函数,以描述损伤因子的概率分布。
其次,模型建立了土-结构接触面的弹塑性本构关系,同时采用损伤软化因子修正了本构关系,使得土-结构接触面的强度随着损伤程度的加剧而逐渐降低。
此外,该模型还考虑了应力状态对土-结构接触面强度的影响,采用应力状态评价指标对应力状态进行分类,然后对每一类应力状态分别建立相应的本构关系和损伤软化因子。
最后,通过数值实验验证了该模型的有效性和适用范围。
模型的应用可以为土-结构接触面的破坏分析和工程设计提供参考。
Package‘weibullness’August8,2023Title Goodness-of-Fit Test for Weibull Distribution(Weibullness)Version1.23.8Date2023-8-8Author Chanseok Park[aut,cre](<https:///0000-0002-2208-3498>)Maintainer Chanseok Park<*****************>Depends R(>=3.5.0)DescriptionPerforms a goodness-of-fit test for Weibull distribution(weibullness test)and provides the pa-rameter estimates of the two-and three-parameter Weibull distributions.Note that the thresh-old parameter is estimated based on the correlation from the Weibull plot.For more de-tails,see<doi:10.23055/ijietap.2017.24.4.2848>,<doi:10.1155/2018/6056975>,and<doi:10.3390/math11143156>.This w ported by the National Research Foundation of Korea(NRF)grant funded by the Korea govern-ment(MSIT)(No.2022R1A2C1091319,RS-2023-00242528).License GPL-2|GPL-3URL https://AppliedStat.GitHub.io/R/BugReports https:///AppliedStat/R/issuesEncoding UTF-8LazyData yesNeedsCompilation noRepository CRANDate/Publication2023-08-0810:10:02UTCR topics documented:print.weibull.estimate (2)print.wp.test.critical (2)Wdata (3)weibull.ic (4)weibull.mle (5)Weibull.Plot.Quantiles (7)12print.wp.test.criticalweibull.rm (8)weibull.threshold (9)weibull.wp (10)wp.plot (11)wp.test (13)wp.test.critical (14)wp.test.pvalue (15)Index17print.weibull.estimatePrint the estimated valuesDescriptionPrinting objects of class"weibull.estimate".See Alsoweibull.mle,weibull.wp,weibull.rm,printprint.wp.test.criticalPrint the critical value for wp.testDescriptionPrinting objects of class"wp.test.critical".See Alsowp.test.critical,printWdata3 Wdata Data setDescriptionbearings:It is from Lieblein and Zelen(1956).These data are deep-groove ball bearings failure times(number of millions of revolutions)in eudurance tests.glassfiber1.5and glassfiber15:They are from Smith and Naylor(1987).These data sets are from experimental data for the strength of glassfiber of length1.5cm and15cm,respectively.urinary:It is from Santiago and Smith(2013).It is about the days in between discharge of males in nosocomial urinary tract infections in patients.radiotherapy and radio.chemotherapy:They are from Finkelstein,D.M.(1986)and Lindsey, J.C.and L.M.Ryan(1998).These data are interval-censored observations from a study of patients with breast cancer.The measurement is the time to cosmetic deterioration of the breast for women who received radiotherapy and women who received radio-chemotherapy.UsageWdataReferencesLieblein,J.and M.Zelen(1956).Statistical Investigation of the Fatigue Life of Deep-Groove Ball Bearings.Journal of Research of the National Bureau of Standards,57(5),273-316.Smith,R.L.and J.C.Naylor(1987).A comparison of maximum likelihood and Bayesian estima-tors for the three-parameter Weibull distribution.Journal of the Royal Statistical Society.Series C (Applied Statistics),36(3),358-369.Santiago,E.and J.Smith(2013).Control Charts Based on the Exponential Distribution:Adapting Runs Rules for the t Chart,Quality Engineering,25(2),85-96.Finkelstein,D.M.(1986),A proportional hazards model for interval-censored failure time data.Biometrics,42,845-865.Lindsey,J.C.and L.M.Ryan(1998).Tutorial in biostatistics:Methods for interval-censored data.Stat.Med.,17,219-238.Examples#Attach data setsattach(Wdata)bearingsglassfiber1.5glassfiber15urinaryradiotherapyradio.chemotherapy4weibull.ic weibull.ic Maximum likelihood estimates with Interval CensoringDescriptionCalculates the maximum likelihood estimates with Interval Censoring Using the EM Algorithm.Usageweibull.ic(X,start=c(1,1),maxits=10000,eps=1E-5)ArgumentsX a numeric matrix(n x2)of observations.start a starting value.maxits the maximum number of iterations.eps the desired accuracy(convergence tolerance).DetailsThe expectation-maximization(EM)algorithm is used for estimating the parameters with interval-censored data.ValueCalculates the maximum likelihood estimates with interval-censored dataAuthor(s)Chanseok ParkReferencesPark,C.(2023).A Note on Weibull Parameter Estimation with Interval Censoring Using the EM Algorithm.Mathematics,11(14),3156.doi:10.3390/math11143156Lawless,J.F.(2003).Statistical Models and Methods for Lifetime Data,2nd ed.;John Wiley& Sons:New York,NY.See Alsoweibull.wp for the parameter estimation using the Weibull plot with full observations.weibull.mle for the parameter estimation using the maximum likelihood method with full observations.Exampleslibrary(weibullness)attach(Wdata)weibull.ic(radio.chemotherapy)#Two-parameter Weibull with full observationsweibull.ic(cbind(bearings,bearings))#Two-parameter Weibull with full observations(using weibull.mle)weibull.mle(bearings,threshold=0)weibull.mle Maximum likelihood estimates of three-parameter Weibull distributionDescriptionCalculates the maximum likelihood estimates of three-parameter Weibull distribution.Usageweibull.mle(x,threshold,interval,interval.threshold,extendInt="downX", a,tol=.Machine$double.eps^0.25,maxiter=1000,trace=0) Argumentsx a numeric vector of observations.threshold the threshold parameter value.interval a vector containing the end-points of the interval to be estimated for the shape parameter.interval.thresholda vector containing the end-points of the interval to be estimated for the thresh-old parameter.extendInt character string specifying if the interval c(left,right)should be extended or di-rectly produce an error when f()has no differing signs at the endpoints.Thedefault,"downX",keep lowering the the left end of the interval so that f()hasdifferent signs.See uniroot.a the offset fraction to be used;typically in(0,1).tol the desired accuracy(convergence tolerance).maxiter the maximum number of iterations.trace integer number;if positive,tracing information is produced.Higher values giv-ing more details.DetailsThe three-parameter Weibull distribution has the cumulative distribution functionF(x)=1−exp−x−θβα,where x>θ.The shape(α)and scale(β)parameters are estimated using the maximum likelihood.The maximum likelihood estimation is performed using the method by Farnum and Booth(1997).If the threshold(θ)is missing,it is estimated by weibull.threshold.If threshold=0,then weibull.mle calculates the maximum likelihood estimates of the two-parameter Weibull distribu-tion.If interval is missing,the interval is given by the method in Farnum and Booth(1997).If interval.threshold is missing,the interval is initally given by(min(x)-sd(x),min(x)).If this interval does not include the estimate,its lower bound is extended(see also uniroot).The choice of a follows ppoints function.Convergence is declared either if f(x)==0or the change in x for one step of the algorithm is less than tol(see also uniroot).If the algorithm does not converge in maxiter steps,a warning is printed and the current approxi-mation is returned(see also uniroot).ValueAn object of class"weibull.estimate",a list with two parameter estimates(if threshold is given)or three-parameter estimates.Author(s)Chanseok ParkReferencesPark,C.(2018).A Note on the Existence of the Location Parameter Estimate of the Three-Parameter Weibull Model Using the Weibull Plot.Mathematical Problems in Engineering,2018, 6056975.doi:10.1155/2018/6056975Park,C.(2017).Weibullness test and parameter estimation of the three-parameter Weibull model using the sample correlation coefficient.International Journal of Industrial Engineering-Theory, Applications and Practice,24(4),376-391.doi:10.23055/ijietap.2017.24.4.2848Farnum,N.R.and P.Booth(1997).Uniqueness of Maximum Likelihood Estimators of the2-Parameter Weibull Distribution.IEEE Transactions on Reliability,46,523-525.See Alsoweibull.wp for the parameter estimation using the Weibull plot.weibull.rm for robust parameter estimation using the repeated median method.weibull.threshold for the estimate of the threshold parameter.fitdistr for maximum-likelihoodfitting of univariate distributions in package MASS.Weibull.Plot.Quantiles7 Exampleslibrary(weibullness)#Three-parameter Weibulldata=c(355,725,884,462,1092,190,166,172,188,224,267,298,355,471,154,101,76,811,80,249,752,305,301,386,667,212,186,127,121,214,242,237,355,210,253,400,401,514,211,285)weibull.mle(data)#Two-parameter Weibullweibull.mle(data,threshold=0)Weibull.Plot.QuantilesWeibull quantile valuesDescriptionQuantiles for the Weibullness Test.They are obtained from the sample correlation from the Weibull plot.The number of Monte Carlo iterations is1E08.Data set representing the quantiles and the associated critical values for the Weibullness test.They were obtained by conducting Monte Carlo simulations where the sample correlation coefficients were calculated based on the Weibull plot.We used1.0E08Monte Carlo iterations in the simulation. UsageWeibull.Plot.QuantilesFormatThis data frame contains998rows and1001columns.ReferencesPark,C.(2017).Weibullness test and parameter estimation of the three-parameter Weibull model using the sample correlation coefficient.International Journal of Industrial Engineering-Theory, Applications and Practice24(4),376-391.doi:10.23055/ijietap.2017.24.4.28488weibull.rm weibull.rm Robust estimate of shape and scale parameters of Weibull using therepeated median methodDescriptionCalculates the estimates of the shape and scale parameters.Usageweibull.rm(x,a)Argumentsx a numeric vector of observations.a the offset fraction to be used;typically in(0,1).See ppoints.Detailsweibull.rm obtains the robust estimates of the shape and scale parameters using the intercept and slope estimates using the repeated median method from the Weibull plot.ValueAn object of class"weibull.estimate",a list with two parameter estimatesAuthor(s)Chanseok ParkReferencesSiegel,A.F.(1982).Robust Regression Using Repeated Medians.Biometrika,69,242-244.See Alsoweibull.mle for the parameter estimation using the maximum likelihood method.weibull.wp for the parameter estimation using the Weibull plot.fitdistr for maximum-likelihoodfitting of univariate distributions in package MASS. Exampleslibrary(weibullness)data=c(355,725,884,462,1092,190,166,172,188,224,267,298,355,471,154,101,76,811,80,249,752,305,301,386,667,212,186,127,121,214,242,237,355,210,253,400,401,514,211,285)weibull.rm(data)weibull.threshold9 weibull.threshold Estimate of threshold parameter of three-parameter Weibull distribu-tionDescriptionCalculates the estimate of the threshold parameter.Usageweibull.threshold(x,a,interval.threshold,extendInt="downX")Argumentsx a numeric vector of observations.a the offset fraction to be used;typically in(0,1).interval.thresholda vector containing the end-points of the interval to be estimated for the thresh-old parameter.extendInt character string specifying if the interval c(left,right)should be extended or di-rectly produce an error when f()has no differing signs at the endpoints.Thedefault,"downX",keep lowering the the left end of the interval so that f()hasdifferent signs.See uniroot.DetailsThe three-parameter Weibull distribution has the cumulative distribution functionF(x)=1−exp−x−θβα,where x>θ.The threshold parameter(θ)is estimated by maximizing the correlation function from the Weibull plot.The choice of a follows ppoints function.If interval.threshold is missing,the interval is initially given by(min(x)-sd(x),min(x)).If this interval does not include the estimate,its lower bound is extended(see also uniroot).Valueweibull.threshold returns a numeric value.Author(s)Chanseok Park10weibull.wpReferencesPark,C.(2018).A Note on the Existence of the Location Parameter Estimate of the Three-Parameter Weibull Model Using the Weibull Plot.Mathematical Problems in Engineering,2018, 6056975.doi:10.1155/2018/6056975Park,C.(2017).Weibullness test and parameter estimation of the three-parameter Weibull model using the sample correlation coefficient.International Journal of Industrial Engineering-Theory, Applications and Practice,24(4),376-391.doi:10.23055/ijietap.2017.24.4.2848See Alsoweibull.mle for the maximum likelihood estimate.weibull.wp for the parameter estimation using the Weibull plot.Exampleslibrary(weibullness)#Datadata=c(355,725,884,462,1092,190,166,172,188,224,267,298,355,471,154,101,76,811,80,249,752,305,301,386,667,212,186,127,121,214,242,237,355,210,253,400,401,514,211,285)weibull.threshold(data)weibull.wp Estimate of shape and scale parameters of Weibull using the WeibullplotDescriptionCalculates the estimates of the shape and scale parameters.Usageweibull.wp(x,n,a)Argumentsx a numeric vector of observations.n The number of observations is needed if there is right-censoring.a the offset fraction to be used;typically in(0,1).See ppoints.Detailsweibull.wp obtains the estimates of the shape and scale parameters using the intercept and slope estimates from the Weibull plot.ValueAn object of class"weibull.estimate",a list with two parameter estimatesAuthor(s)Chanseok ParkReferencesPark,C.(2018).A Note on the Existence of the Location Parameter Estimate of the Three-Parameter Weibull Model Using the Weibull Plot.Mathematical Problems in Engineering,2018, 6056975.doi:10.1155/2018/6056975Park,C.(2017).Weibullness test and parameter estimation of the three-parameter Weibull model using the sample correlation coefficient.International Journal of Industrial Engineering-Theory, Applications and Practice,24(4),376-391.doi:10.23055/ijietap.2017.24.4.2848See Alsoweibull.mle for the parameter estimation using the maximum likelihood method.weibull.rm for robust parameter estimation using the repeated median method.fitdistr for maximum-likelihoodfitting of univariate distributions in package MASS.Exampleslibrary(weibullness)data=c(355,725,884,462,1092,190,166,172,188,224,267,298,355,471,154,101,76,811,80,249,752,305,301,386,667,212,186,127,121,214,242,237,355,210,253,400,401,514,211,285)weibull.wp(data)wp.plot Weibull Probability PlotDescriptionwp.plot produces a Weibull probability plot.Usagewp.plot(x,plot.it=TRUE,a,col.line="black",lty.line=1,xlim=NULL,ylim=NULL,main=NULL,sub=NULL,xlab=NULL,ylab="Probability",...)Argumentsx a numeric vector of data values.Missing values are allowed.plot.it logical.Should the result be plotted?a the offset fraction to be used;typically in(0,1).See ppoints.col.line the color of the straight line.lty.line the line type of the straight line.xlim the x limits of the plot.ylim the y limits of the plot.main a main title for the plot,see also title.sub a sub title for the plot.xlab a label for the x axis,defaults to a description of x.ylab a label for the y axis,defaults to"Probability"....graphical parameters.DetailsThe Weibull probability plot is based on taking the logarithm of the Weibull cumulative distribution function twiceValueA list with the following components:x The sorted datay log(-log(1-ppoints(n,a=a)))Author(s)Chanseok ParkSee Alsoplot,qqnorm,qqplot.Examplesattach(Wdata)wp.plot(bearings)#With cosmetic lineswp.plot(bearings,main="Weibull Probability Plot",col.line="red",xlab="Lifetimes of bearings",lty.line=1,pch=3)hline=log(-log(1-c((1:5)/100,(1:9)/10)))abline(h=hline,col=gray(0.1),lty=3,lwd=0.5)abline(v=seq(15,200,by=5),col=gray(0.1),lty=3,lwd=0.5)wp.test13 wp.test The Weibullness Test from the Weibull PlotDescriptionPerforms the statistical test of Weibullness(Goodness-of-fit test for the Weibull distribution)using the sample correlation from the Weibull plot.Usagewp.test(x,a)Argumentsx a numeric vector of data values.Missing values are allowed,but the number of non-missing values must be between3and1000.a the offset fraction to be used;typically in(0,1).See ppoints().DetailsThe Weibullness test is constructed using the sample correlation which is calculated using the asso-ciated Weibull plot.The critical value is then looked up in Weibull.Plot.Quantiles.There is print method for class"htest".ValueA list with class"htest"containing the following components:statistic the value of the test statistic(sample correlation from the Weibull plot)p.value the p-value for the test.sample.size sample size(missing observations are deleted).method a character string indicating the Weibullness test. a character string giving the name(s)of the data.Author(s)Chanseok ParkReferencesPark,C.(2017).Weibullness test and parameter estimation of the three-parameter Weibull model using the sample correlation coefficient.International Journal of Industrial Engineering-Theory, Applications and Practice,24(4),376-391.doi:10.23055/ijietap.2017.24.4.2848V ogel,R.M.and C.N.Kroll(1989).Low-Flow Frequency Analysis Using Probability-Plot Corre-lation Coefficients.Journal of Water Resources Planning and Management,115,338-357.14wp.test.criticalSee Alsoks.test for performing the Kolmogorov-Smirnov test for the goodness offit test of two samples.shapiro.test for performing the Shapiro-Wilk test for normality.Exampleslibrary(weibullness)#For Weibullness hypothesis test.x=rweibull(10,shape=1)wp.test(x)wp.test.critical Critical value for the Weibullness testDescriptionCalculates the critical value for the Weibullness testUsagewp.test.critical(alpha,n)Argumentsalpha the significance level.n the sample size.DetailsThis function calculates the critical value for the Weibullness test which is constructed using thesample correlation from the associated Weibull plot.The critical value is then looked up in Weibull.Plot.Quantiles.There is print method for class"wp.test.critical".ValueA list with class"wp.test.critical"containing the following components:sample.size sample size(missing observations are deleted).alpha significance level.critical.value critical value. a character string giving the name(s)of the data.Author(s)Chanseok ParkReferencesPark,C.(2017).Weibullness test and parameter estimation of the three-parameter Weibull model using the sample correlation coefficient.International Journal of Industrial Engineering-Theory, Applications and Practice,24(4),376-391.doi:10.23055/ijietap.2017.24.4.2848V ogel,R.M.and C.N.Kroll(1989).Low-Flow Frequency Analysis Using Probability-Plot Corre-lation Coefficients.Journal of Water Resources Planning and Management,115,338-357.See Alsoks.test for performing the Kolmogorov-Smirnov test for the goodness offit test of two samples.shapiro.test for performing the Shapiro-Wilk test for normality.Exampleslibrary(weibullness)#Critical value with alpha(significance level)and n(sample size).wp.test.critical(alpha=0.01,n=10)wp.test.pvalue The p-value for the Weibullness testDescriptionCalculates the p-value for the Weibullness test which is based on the sample correlation from the Weibull plot.Usagewp.test.pvalue(r,n)Argumentsr the sample correlation coefficient from the Weibull plot;r is in(0,1).n the sample size.DetailsThe p-value for the Weibullness test which is based on the sample correlation from the Weibull plot.There is print method for class"htest".ValueA list with class"htest"containing the following components:statistic the value of the test statistic(sample correlation from the Weibull plot)p.value the p-value for the test.method a character string indicating the Weibullness test.Author(s)Chanseok ParkReferencesPark,C.(2017).Weibullness test and parameter estimation of the three-parameter Weibull model using the sample correlation coefficient.International Journal of Industrial Engineering-Theory, Applications and Practice,24(4),376-391.doi:10.23055/ijietap.2017.24.4.2848V ogel,R.M.and C.N.Kroll(1989).Low-Flow Frequency Analysis Using Probability-Plot Corre-lation Coefficients.Journal of Water Resources Planning and Management,115,338-357.See Alsoks.test for performing the Kolmogorov-Smirnov test for the goodness offit test of two samples.shapiro.test for performing the Shapiro-Wilk test for normality.Exampleslibrary(weibullness)#p.value with r(sample correlation from the Weibull plot)and n(sample size).wp.test.pvalue(r=0.6,n=10)Index∗Maximum likelihood estimator(MLE) weibull.ic,4weibull.mle,5∗Weibull plotWeibull.Plot.Quantiles,7weibull.rm,8weibull.threshold,9weibull.wp,10wp.test,13wp.test.critical,14wp.test.pvalue,15∗critical valuewp.test.critical,14∗datasetsWdata,3Weibull.Plot.Quantiles,7∗estimateweibull.ic,4weibull.mle,5weibull.rm,8weibull.threshold,9weibull.wp,10∗interval censoredweibull.ic,4∗p-valuewp.test.pvalue,15∗parameterweibull.ic,4weibull.mle,5weibull.rm,8weibull.threshold,9weibull.wp,10∗printprint.weibull.estimate,2print.wp.test.critical,2∗robustweibull.rm,8bearings(Wdata),3fitdistr,6,8,11glassfiber1.5(Wdata),3glassfiber15(Wdata),3ks.test,14–16plot,12ppoints,6,9,12print,2,13–15print.weibull.estimate,2print.wp.test.critical,2qqnorm,12qqplot,12radio.chemotherapy(Wdata),3radiotherapy(Wdata),3shapiro.test,14–16title,12uniroot,5,6,9urinary(Wdata),3Wdata,3weibull.ic,4weibull.mle,2,4,5,8,10,11Weibull.Plot.Quantiles,7weibull.rm,2,6,8,11weibull.threshold,6,9weibull.wp,2,4,6,8,10,10weibullness(wp.test),13wp.plot,11wp.test,13wp.test.critical,14wp.test.pvalue,1517。
weibull分布 k 检验 matlab下载温馨提示:该文档是我店铺精心编制而成,希望大家下载以后,能够帮助大家解决实际的问题。
文档下载后可定制随意修改,请根据实际需要进行相应的调整和使用,谢谢!并且,本店铺为大家提供各种各样类型的实用资料,如教育随笔、日记赏析、句子摘抄、古诗大全、经典美文、话题作文、工作总结、词语解析、文案摘录、其他资料等等,如想了解不同资料格式和写法,敬请关注!Download tips: This document is carefully compiled by the editor. I hope that after you download them, they can help you solve practical problems. The document can be customized and modified after downloading, please adjust and use it according to actual needs, thank you!In addition, our shop provides you with various types of practical materials, such as educational essays, diary appreciation, sentence excerpts, ancient poems, classic articles, topic composition, work summary, word parsing, copy excerpts, other materials and so on, want to know different data formats and writing methods, please pay attention!Weibull分布是一种常见的概率分布,在工程领域和风险分析中经常被使用。
Weibull 分布
常用于为失效时间数据建模。例如,一个制造商希望计算某个部件在一年、两年
或更多年后失效的概率。此分布广泛地应用于工程、医学研究、金融和气候学。
Weibull 分布由形状、尺度和阈值等参数描述。阈值参数为零的情况称为 2 参
数 Weibull 分布。只为非负变量定义此分布。
取决于参数的值,Weibull 分布可以具有各种形状。
这种分布的主要优点之一在于它可以具有其他类型分布的特征,从而在拟合不同
类型的数据时极其灵活。例如,
· 指数分布是 Weibull 分布的一种特殊情况,常用于研究辐射或风速的散布。
· Weibull 分布是存在偏斜数据时正态分布的备择。
· 如果 X 服从 Weibull 分布,则 Ln(X) 服从极值分布。此分布用于描述极
端情况,如极端阵风、地震期间的极端能量或极端压力。
当形状参数为 2 时,可从 Weibull 分布派生 Rayleigh 分布。