scs模型
- 格式:pdf
- 大小:215.84 KB
- 文档页数:14
基于深度学习的显著性检测方法模型——SCS张洪涛;路红英;刘腾飞;张玲玉;张晓明【期刊名称】《计算机与现代化》【年(卷),期】2018(000)004【摘要】提出一种基于深度学习的图像显著性区域检测方法,该方法对2种视觉注意机制所涉及的低级对比特征和高级语义特征分别进行提取,并结合2类特征进行模型训练最终得到基于分类思想的图像显著性区域检测模型——SCS检测模型.通过对比实验得出:该方法训练得到的检测模型在检测准确度上具有显著的优势.%In this paper,we propose a method of saliency detection based on deep learning.This method extracts the low-level contrast features and high-level semantic features involved in the two visual attention mechanisms,and combines both of them to obtain a classification-based saliency detection model SCS.Through the comparison experiment,it is concluded that the proposed detection model has significant advantages in the accuracy of saliency detection.【总页数】8页(P48-55)【作者】张洪涛;路红英;刘腾飞;张玲玉;张晓明【作者单位】北京交通大学计算机与信息技术学院,北京100044;北京交通大学计算机与信息技术学院,北京100044;北京交通大学计算机与信息技术学院,北京100044;北京交通大学计算机与信息技术学院,北京100044;北京交通大学计算机与信息技术学院,北京100044【正文语种】中文【中图分类】TP391【相关文献】1.一种基于词袋模型的新的显著性目标检测方法 [J], 杨赛;赵春霞;徐威2.一种基于显著性和部件模型的无约束条件人脸检测方法 [J], 孔英会;高超;车辚辚3.基于深度学习的GPR B-SCAN图像双曲线检测方法 [J], 王辉;欧阳缮;廖可非;晋良念4.基于MRDMD模型的噪声图像显著性检测方法 [J], 付优;任芳5.基于深度学习的显著性目标检测方法综述 [J], 罗会兰;袁璞;童康因版权原因,仅展示原文概要,查看原文内容请购买。
SCS模型中CN值的优化率定方法——以天山北坡云杉森林为例李伯騛;常顺利;张毓涛【期刊名称】《中国农村水利水电》【年(卷),期】2018(0)8【摘要】利用SCS模型可以计算出已知CN值流域的径流量,但由于地形条件、降水特性存在差异,适用于不同流域的CN值较难获取。
以乌鲁木齐河流域板房沟林场为试验区,利用2009-2014年的各类径流观测小区降水-径流量观测数据反算出CN值范围,然后以理论产流曲线与实测降水-产流曲线的拟合度对CN值进行优化筛选,最后以留一交叉验证法对CN值进行率定,从而得到各林分条件下径流观测小区的最优CN值。
结果表明:(1)天山林区不同林分条件下的径流观测小区CN值都大于74;(2)CN值与林分郁闭度显著相关(P<0.05)。
提出了一种获取干旱区山地林区CN值的改进型方法,此方法将有助于SCS模型及CN值在我国的应用。
【总页数】5页(P72-76)【关键词】SCS模型;CN值;径流观测小区;云杉森林;天山【作者】李伯騛;常顺利;张毓涛【作者单位】新疆大学资源与环境科学学院绿洲生态教育部重点实验室;新疆林科院森林生态研究所【正文语种】中文【中图分类】TV121【相关文献】1.径流曲线数模型(SCS-CN)参数λ在黄土丘陵区的率定 [J], 张钰娴;穆兴民;王飞2.SCS-CN模型中C N值的空间移用效果研究 [J], 余娇娇;王加虎;王冬;梁菊平;赵永超3.淮河上游流域SCS_CN模型初损取值与CN值确定方法的研究 [J], 黄兆欢;刘阳;张银雪;曾天;王欣;张友静4.黄土丘陵区不同盖度生物结皮对坡面产流及SCS-CN模型CN值的影响 [J], 谷康民;杨凯;赵允格;高丽倩;孙会;郭雅丽5.SCS-CN径流模型中CN值确定方法研究 [J], 符素华;王向亮;王红叶;魏欣;袁爱萍因版权原因,仅展示原文概要,查看原文内容请购买。
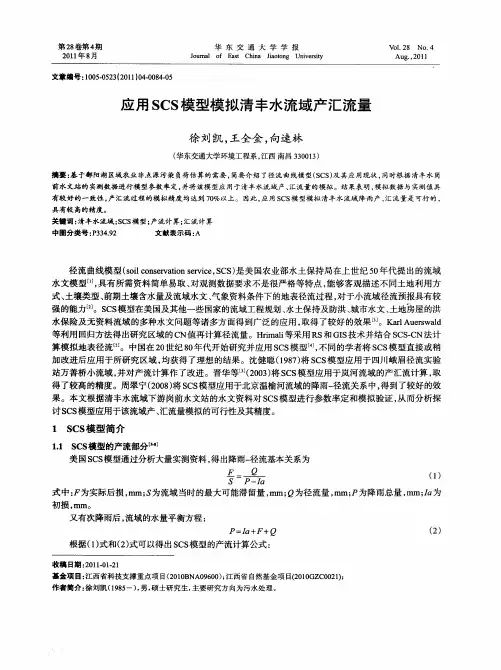
文章编号:1006—2610(2020)06—0057—04基于SCS模型的资料缺乏地区小流域设计洪水计算方法研究戴荣,王琦(中国电建集团西北勘测设计研究院有限公司,西安710065)摘要:文章利用ArcGIS软件,依据数字高程模型(DEM)、土地利用、土壤类型等遥感数据确定SCS模型产、汇流参数,根据设计暴雨资料对研究流域设计洪水进行模拟,并用地区综合法进行结果验证。
结果表明:SCS模型计算结果可靠,对解决资料缺乏地区小流域设计洪水计算具有参考价值。
关键词:SCS模型;设计暴雨;设计洪水;资料缺乏中图分类号:TV122+.3文献标志码:A DOI:10.3969/j.issn.1006-2610.2020. 06. 012Study on Calculation Method of Design Flood for Small River Basinin Areas Lacking Hydrological Data based on SCS ModelDAI Rong,WANG Qi(PowerChina Northwest Engineering Corporation Limited,Xi'an710065,China)Abstract:The article adopts ArcGIS software to determine the output and confluence parameters of the SCS model based on remote sensing data such as digital elevation model(DEM),land use and soil type,simulates the design flood in the study basin based on the design rainstorm data,and uses the regional comprehensive method to verify the results.The results show that the calculation results of the SCS model are reliable and are of reference value for design flood calculation of small river basin in areas with insufficient data.Key words:SCS model;design storm;design flood;lack of hydrological data0前言水利水电工程附近经常分布有小流域,这些小流域常会突发暴雨洪水,该类洪水具有陡涨陡落,汇流时间短等特点,对工程危害性极大,因此,必须进行设计洪水计算,修建防洪工程。
SCS模型的基本原理
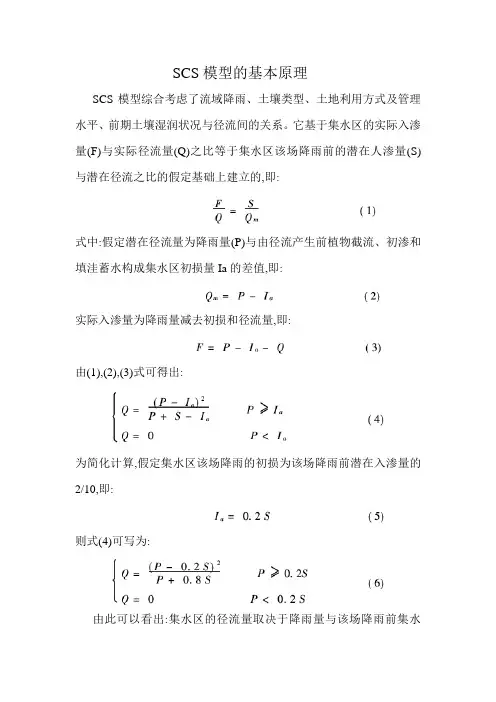
SCS模型综合考虑了流域降雨、土壤类型、土地利用方式及管理水平、前期土壤湿润状况与径流间的关系。
它基于集水区的实际入渗量(F)与实际径流量(Q)之比等于集水区该场降雨前的潜在人渗量(S)与潜在径流之比的假定基础上建立的,即:
式中:假定潜在径流量为降雨量(P)与由径流产生前植物截流、初渗和填洼蓄水构成集水区初损量Ia的差值,即:
实际入渗量为降雨量减去初损和径流量,即:
由(1),(2),(3)式可得出:
为简化计算,假定集水区该场降雨的初损为该场降雨前潜在入渗量的2/10,即:
则式(4)可写为:
由此可以看出:集水区的径流量取决于降雨量与该场降雨前集水
区的潜在入渗量,而潜在入渗量又与集水区的土壤质地、土地利用方式和降雨前的土壤湿度状况有关,SCS模型通过一个经验性的综合反映上述因素的参数CN来推求S值的。
由式(6)可以看出,欲求径流量,只需知道参数CN。
在实际条件下,CN值在30 ~ 100之间变化。
根据土壤特性,将土壤划分为A,B,C,D 四种类型,根据CN值表可以查得不同土地利用条件下,不同土壤类型的CN值。
然后将土壤湿润状况根据径流事件发生前5天的降雨总量(即前期降雨指数API)划分为湿润、中等湿润和干旱三种状态,再调节由查表获得的CN值[1]。
前期土壤湿润程度等级(AMC等级)
前五天总雨量(mm)
休眠季节生长季节
AM CⅠ<12.7 <35.56 AM CⅡ12.7 ~27.94 35.56~53.34 AM CⅢ>27.94 >53.34。

SCS模型及其研究进展一、本文概述随着信息技术的快速发展,供应链管理(Supply Chn Management,SCM)在现代企业中扮演着越来越重要的角色。
供应链复杂性、不确定性和动态性的增加,使得对供应链管理的理论研究和实践应用提出了更高的要求。
在此背景下,供应链协同管理(Supply Chn Coordination,SCC)作为一种新型的管理模式,逐渐受到学者和企业的广泛关注。
本文旨在探讨供应链协同管理(SCC)的核心模型——供应链协同模型(Supply Chn Synchronization Model,SCS)及其研究进展。
我们将首先介绍SCS模型的基本概念、特点和应用场景,然后综述国内外学者在SCS模型研究方面取得的主要成果和进展,包括模型构建、优化方法、实证分析等方面。
我们将展望SCS模型未来的研究方向和应用前景,以期为供应链协同管理领域的理论研究和实践应用提供参考和借鉴。
通过本文的阐述,我们期望能够帮助读者全面了解SCS模型的基本理论和方法,掌握其最新研究动态和发展趋势,为供应链协同管理的实践提供理论支持和实践指导。
二、SCS模型理论基础SCS模型,全称为Surface-Conduit-Storage模型,是一种用于描述和模拟水文过程的数学模型。
其理论基础主要源于水文学、水力学和生态学等多个学科领域的知识融合,旨在为水文学家和生态学家提供一个统一且有效的工具,以理解和预测自然界中的水文过程和生态响应。
SCS模型的理论框架主要包括三个核心组件:地表径流(Surface)、渠道流(Conduit)和储存(Storage)。
地表径流描述的是降雨后直接在地表形成的流动水体,其大小受到地表覆盖、土壤渗透性等多种因素的影响。
渠道流则指的是降雨后通过地表径流汇集到河流或溪流中的水体,其动态变化受到地形、地貌和河网结构等因素的控制。
储存部分则涵盖了地表和地下的水体储存,包括土壤水分、地下水等,是维持水文循环和生态系统稳定的关键环节。
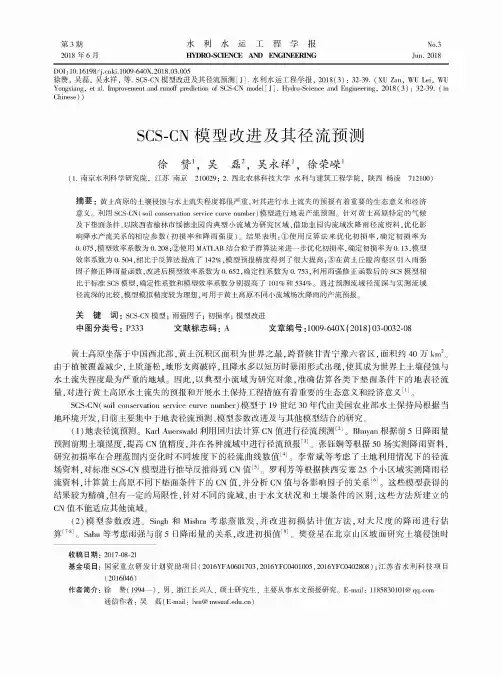
第3期 2018年6月水利水运工程学报H Y D R O-S C IE N C E A N D E N G IN E E R IN GN o.3Jun. 2018D O I:10.16198/j.c n k i.1009-640X.2018.03.005徐赞,吴磊,吴永祥,等.S C S-C N模型改进及其径流预测[J].水利水运工程学报,2018(3):32-39. (X U Z a n,W U L e i,W UY o ng xia ng, et al. Im provem ent and ru n o ff p re d ictio n o f SCS-CN m odel [J].H ydro-S cience and E n g in e e rin g,2018(3):32-39. (i nC h in e s e))S C S-CN模型改进及其径流预测徐赞\吴磊2,吴永祥\徐荣碟1(1.南京水利科学研究院,江苏南京210029; 2.西北农林科技大学水利与建筑工程学院,陕西杨凌712100)摘要:黄土高原的土壤侵蚀与水土流失程度都很严重,对其进行水土流失的预报有着重要的生态意义和经济意义。
利用S C S-C N(s o il conservation service curve n u m b e r)模型进行地表产流预测。
针对黄土高原特定的气候及下垫面条件,以陕西省榆林市绥德韭园沟典型小流域为研究区域,借助韭园沟流域次降雨径流资料,优化影响降水产流关系的相应参数(初损率和降雨强度)。
结果表明:①使用反算法来优化初损率,确定初损率为0. 075,模型效率系数为0. 208;②使用M A T L A B结合粒子群算法来进一步优化初损率,确定初损率为0. 13,模型效率系数为0.504,相比于反算法提高了142%,模型预报精度得到了很大提高;③在黄土丘陵沟壑区引人雨强因子修正降雨量函数,改进后模型效率系数为0. 652,确定性系数为0. 753,利用雨强修正函数后的S C S模型相比于标准S C S模型,确定性系数和模型效率系数分别提高了101%和534%。
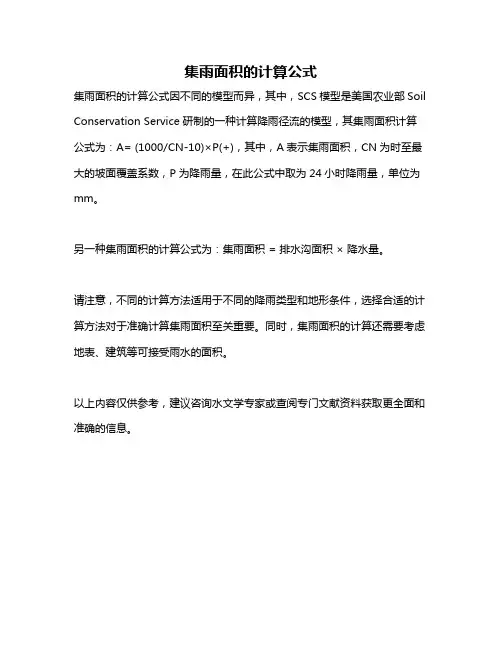
集雨面积的计算公式
集雨面积的计算公式因不同的模型而异,其中,SCS模型是美国农业部Soil Conservation Service研制的一种计算降雨径流的模型,其集雨面积计算公式为:A= (1000/CN-10)×P(+),其中,A表示集雨面积,CN为时至最大的坡面覆盖系数,P为降雨量,在此公式中取为24小时降雨量,单位为mm。
另一种集雨面积的计算公式为:集雨面积 = 排水沟面积× 降水量。
请注意,不同的计算方法适用于不同的降雨类型和地形条件,选择合适的计算方法对于准确计算集雨面积至关重要。
同时,集雨面积的计算还需要考虑地表、建筑等可接受雨水的面积。
以上内容仅供参考,建议咨询水文学专家或查阅专门文献资料获取更全面和准确的信息。
scs水文模型例题水文模型在自然资源管理、环境保护和灾害预防等领域中发挥着重要的作用。
SCS水文模型是一种基于土壤保持的水文模拟方法,广泛应用于水文学研究和工程实践中。
本文将通过一个SCS水文模型的例题,介绍该模型的基本原理和应用方法。
例题背景:某市位于河流上游,面临洪水风险。
为了评估可能的洪水情况,需要使用SCS水文模型来模拟降雨径流过程。
假设该市面积为100平方公里,降雨事件为10年一遇的设计降雨,模型参数已知如下:土壤类型:A植被类型:森林坡度:10%河道长度:10千米通过该例题,我们将逐步展示SCS水文模型的运用方法。
1. 降雨分析:首先,我们需要对设计降雨事件进行分析和处理。
设计降雨通常以单位时间内降水量的形式给出。
根据降雨数据,我们可以计算得到降雨量为100毫米。
假设时间间隔为1小时,我们可以得到单位时间内的降水量为10毫米。
2. SCS曲线:SCS曲线是SCS水文模型的核心部分,它反映了时间和降雨的关系。
曲线的形状由土壤类型、植被类型和坡度等参数决定。
根据给定的参数,我们可以查找SCS手册,找到与之相对应的SCS曲线。
3. 整体时段单位线:整体时段单位线是单位面积产流深度与单位时间内产流过程之间的关系曲线。
它是根据SCS曲线和土地利用数据计算得出的。
在这个例题中,我们可以利用给定的土壤类型和植被类型,结合降雨数据,计算得到整体时段单位线。
4. 普通单位线:普通单位线是单位时间内径流量与单位面积产流深度之间的关系曲线。
它是整体时段单位线的缩放版本。
通过对整体时段单位线进行缩放,我们可以得到普通单位线。
5. 非线性产流:在SCS水文模型中,产流过程被分为初期产流和延时产流两个部分。
初期产流是指在雨水刚降落后,由于土壤无法迅速吸收水分而形成的产流。
延时产流是指在降雨结束后,土壤逐渐释放积水,导致的产流过程。
6. 延时过程:延时过程是指从降雨结束到开始出现流量峰值之间的过程。
它与土地利用、土壤类型和地形等因素有关。
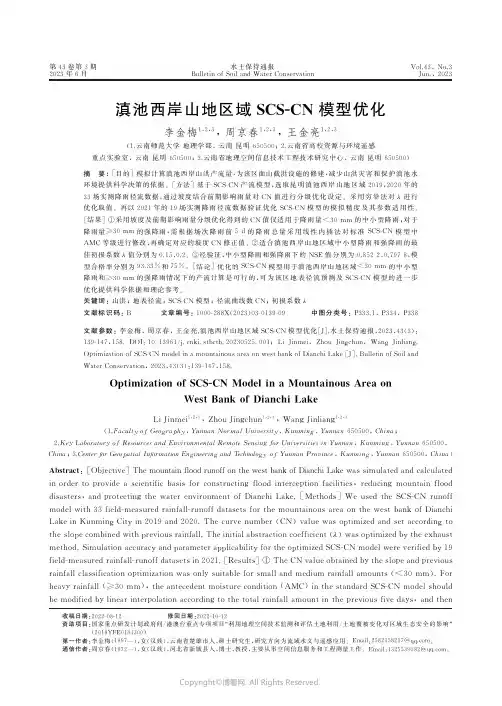
第34卷第4期2023年7月㊀㊀水科学进展ADVANCES IN WATER SCIENCE Vol.34,No.4Jul.2023DOI:10.14042/ki.32.1309.2023.04.008分布式SCS-CN 有效降雨修正模型建立及应用申红彬1,徐宗学2,曹㊀兵3,王海周1(1.华北水利水电大学河南省水圈与流域水安全重点实验室,河南郑州㊀450045;2.北京师范大学城市水循环与海绵城市技术北京市重点实验室,北京㊀100875;3.东营市水务局,山东东营㊀257091)摘要:为解决SCS-CN 模型改进后方程结构复杂的问题,基于SCS-CN 标准模型,经与SCS-CN 改进模型比较,引入有效降雨修正系数建立SCS-CN 有效降雨修正模型,并对城市低影响开发复杂区域综合考虑LID 设施蓄存容积对降雨径流的影响,构建基于水文响应单元的分布式SCS-CN 有效降雨修正模型,以北京双紫园小区为例开展降雨径流模拟与效果检验㊂分析SCS-CN 有效降雨修正模型,当对修正系数取值等于1.0时其等同于标准模型,当对修正系数取值小于1.0时其等效于改进模型;修正系数表征了径流系数随降水量增大而变化趋向稳定的极限值㊂模型应用结果表明,分别对渗透地表有效降雨修正系数取值等于1.0与小于1.0,两者对不同场次降雨径流深的计算值与实测值散点均位于45ʎ线附近㊁符合较好,确定性系数与Nash-Sutcliffe 效率系数值分别为0.91与0.83㊁0.92与0.91,后者效果优于前者,说明对渗透地表有效降雨修正系数取值小于1.0能够有效提高模拟效果㊂关键词:SCS-CN 模型;有效降雨;修正系数;分布式;低影响开发中图分类号:TV121.1㊀㊀㊀文献标志码:A㊀㊀㊀文章编号:1001-6791(2023)04-0553-09收稿日期:2022-12-28;网络出版日期:2023-05-24网络出版地址:https :ʊ /kcms2/detail /32.1309.P.20230523.1809.004.html基金项目:国家自然科学基金资助项目(52239003);城市水循环与海绵城市技术北京市重点实验室开放基金资助项目(HYD2019OF02)作者简介:申红彬(1981 ),男,河南安阳人,讲师,博士,主要从事水文学㊁河流动力学方面的研究工作㊂E-mail:hongbinshen 2012@ 随着城市化的快速发展,特别是低影响开发(Low Impact Development,LID)和海绵城市建设的稳步推进,地表下垫面种类日趋多样,LID 设施作用日渐突出,降雨径流规律更为复杂㊂如何对变化环境下城市的降雨径流过程进行模拟,是当今水文学,特别是城市水文学研究的重点与难点[1]㊂SCS-CN(Soil Conservation Service Curve Number)模型是美国农业部水土保持局于1954年开发研制的一款降雨径流模型[2],因结构简单㊁输入参数较少㊁对观测数据要求不高,在城市降雨径流模拟㊁流域水土保持等多个方面得到了广泛的应用,且特别适用于资料相对缺乏的地区㊂不过,在SCS-CN 模型的应用与发展过程中,如何对其进行改进与完善始终是研究的热点与难点问题㊂SCS-CN 模型形式较多,其标准模型的建立主要基于水量平衡方程以及2个基本假设:地表径流量与可能最大径流量的比例和累计入渗量与当时可能最大滞留量的比例相等;初损值与当时可能最大滞留量成比例关系㊂模型参数主要有当时可能最大滞留量(或曲线数)和初损系数,方程结构相对简单㊂对于SCS-CN 标准模型的改进主要包括:①模型参数的率定与修正㊂如考虑前期降雨㊁坡度等对当时可能最大滞留量(或曲线数)的影响,分析初损系数的变化范围与区域特征等[3-4]㊂②模型的分布式改进与应用㊂如以栅格为基本单元,建立分布式的SCS-CN 模型,并探讨模型参数的尺度效应[5-6]㊂③模型假设条件与内部结构的改进㊂如将累计入渗量分解为静态与动态下渗量,并引入前期土壤水分改进累计入渗量与当时可能最大滞留量的比例关系等[7-10]㊂其中,对SCS-CN 模型的分布式改进与应用是重要的发展方向,更适用于下垫面组成与产流规律复杂的流域㊂模型假设与内部结构的改进有助于进一步增强模型的理论基础,有效提高模型的精度,但往往会使模型参数增加,方程结构形式更趋复杂㊂因此,在SCS-CN 标准模型简单方程结构的基础上,如何通554㊀水科学进展第34卷㊀过引入修正系数即可实现模型改进,并建立相应的分布式模型,成为一个有待研究的问题㊂本文基于SCS-CN 标准模型,经与SCS-CN 改进模型比较,引入有效降雨修正系数,提出建立SCS-CN 有效降雨修正模型;对于城市LID 复杂区域,构建基于水文响应单元的分布式SCS-CN 有效降雨修正模型,以北京双紫园小区为例对其降雨径流过程进行模拟应用㊂1㊀模型建立1.1㊀SCS-CN 标准模型及其改进模型简介SCS-CN 标准模型以水量平衡方程为基础:P =I a +F +R(1)并结合2个基本假设:R P -I a =F S(2)I a =λS (3)联合式(1) 式(3)推导,可以得到地表径流深的计算公式如下:R =(P -I a )2P -I a +S =(P -λS )2P -λS +S (4)式中:P 为降水量,mm;I a 为初损量,mm;F 为累计下渗量,不包括I a ,mm;R 为地表径流深,mm;λ为初损系数,主要取决于地理与气候因子,取值范围为0.1~0.3,一般取均值为0.2;S 为当时可能最大滞留量,是累计下渗量的上限,mm㊂在λ=0.2条件下,由式(4)可知当时可能最大滞留量与降水量㊁径流深具有如下关系:S =5(P +2R -4R 2+5PR )(5)式(5)是利用降雨径流资料对当时可能最大滞留量的反推,最终取算术平均值㊂在实际计算中,由于当时可能最大滞留量数值变化范围很大,为便于取值,引入量纲一参数径流曲线数(CN),两者转换关系为S =25400N C -254(6)式中:N C 为CN 值,受到土壤类型㊁前期湿度㊁植被状况㊁坡度以及土地利用等因素影响,理论取值范围为0~100,实际变化范围为40~98㊂现有对于CN 值取值的主要步骤包括[11]:①根据土壤下渗或产流能力,进行水文组分类(分为A㊁B㊁C㊁D 4类);②结合土地利用类型㊁植被覆盖与水文状况(分为好㊁中㊁差3类)等,查SCS 手册选取CN 值;③考虑土壤前期湿润程度(AMC)影响,引入前期降水指数(API,至少前5d 累计降水量),分级(分为AMC Ⅰ级/干旱㊁AMC Ⅱ级/正常和AMC Ⅲ级/湿润)换算与取值;④考虑坡度影响,对CN 值进行坡度修正㊂不过,由于CN 值变化规律复杂,往往还需调整优化㊂SCS-CN 改进模型是在标准模型式(1)的基础上,进一步将累计下渗量分解为静态下渗量与动态下渗量[2,7-10],如图1所示,并将假设条件式(2)改写为:R P -I a -F c =F d S(7)F c =f c t (8)经过联合推导,可以得到地表径流深的计算公式如下:R =(P -I a -F c )2P -I a -F c +S =(P -λS -F c )2P -λS -F c +S(9)式中:F c 为静态下渗量,mm;F d 为动态下渗量,mm;f c 为静态下渗速率,mm/min;t 为产流后降雨历时,min㊂㊀第4期申红彬,等:分布式SCS-CN 有效降雨修正模型建立及应用555㊀图1㊀SCS 模型比例相等假设示意Fig.1Diagram of the proportionality hypothesis of the SCS model 1.2㊀SCS-CN 有效降雨修正模型的建立比较SCS-CN 标准模型式(4)与改进模型式(9),后者因引入静态下渗量参数而变得复杂㊂不过,从本质上来看,式(4)中的(P -I a )与式(9)中的(P -I a -F c )均可视为有效降雨,后者数值明显小于前者㊂因此,通过引入有效降雨修正系数,可以将两者统一表示如下:R =[κ(P -λS )]2κ(P -λS )+S (10)式中:κ=(P -λS -F c )/(P -λS ),为有效降雨修正系数㊂式(10)即为SCS-CN 有效降雨修正模型㊂其中,当κ=1.0时,式(10)为SCS-CN 标准模型式(4);当κ<1.0时,式(10)等效于SCS-CN 改进模型式(9)㊂基于SCS-CN 有效降雨修正模型式(10),经过推导,可以得到径流系数的变化方程:1α=P κ(P -λS )1+S κ(P -λS )[](11)式中:α为径流系数㊂根据式(11),当P ңɕ时,P /(P -λS )ң1㊁αңκ㊂因此,κ表征了径流系数随降水量增大而变化趋向稳定的极限值㊂实测资料表明[12],对于渗透地表,其径流系数随降水量增大而变化趋向稳定的极限值一般小于1.0㊂如设降雨产流后的平均降雨强度为Iᶄ,则可将式(10)中的κ表示为κ=P -λS -F c P -λS =Iᶄt -f c t Iᶄt =1.0-f c Iᶄ(12)式中:Iᶄ为降雨产流后的平均降雨强度,mm /min㊂对于不同场次降雨,为简化计算,对Iᶄ可取为不同场次降雨产流后平均降雨强度的平均值㊂对于均匀降雨过程,当降雨强度与下渗速率相等时,地表开始产流㊂以产流时刻为初始时刻,结合Hor-ton 土壤下渗模型,有:f =(f 0-f c )exp(-βt )+f c(13)S =ʏ+ɕ0(f 0-f c )exp(-βt )d t =1β(f 0-f c )(14)I =f 0(15)式中:f 为下渗速率,mm /min;f 0为产流开始时下渗速率,mm /min;β为变化速率,1/min;I 为均匀降雨强556㊀水科学进展第34卷㊀度,mm /min㊂考虑到产流时刻I =f 0,相应有:P -λS -F c =It -f c t =ββ+f c /S (P -λS )(16)将式(16)代入式(12),可以得到均匀降雨条件下κ的计算表达式为κ=ββ+f c /S (17)从式(17)可以看出,在均匀降雨条件下,κ主要与下垫面土壤的下渗特性参数有关㊂1.3㊀分布式SCS-CN 有效降雨修正模型的构建对于由多种下垫面组成的复杂流域,为反映降雨㊁下垫面等条件空间分布不均的影响,建立分布式模型是重要的发展方向㊂以往多采用对不同类型下垫面CN 值按面积比例进行加权平均的方法(式(18))[13],并应用于SCS-CN 模型,但最终效果仍为集总式模型,难以深入描述流域不同类型下垫面的产流贡献与变化规律㊂N C,a =ðmj =1A j A N C,j ()(18)式中:N C,a 为流域综合CN 值;N C,j 为不同种类下垫面CN 值,m 2;A 为汇流区域总面积,m 2;A j 为不同种类下垫面面积,m 2;j 为不同种类下垫面编号;m 为下垫面种类数量㊂现有流域离散化的方法主要有单元网格㊁山坡单元㊁自然子流域㊁水文响应单元㊁等流时面积单元㊁典型单元面积㊁分组响应单元及其组合等[14]㊂比较来看,水文响应单元是在自然子流域划分的基础上,进一步结合土地利用方式㊁植被类型和土壤类型,划分为下垫面特征相对单一和均匀的离散响应单元,更为符合SCS-CN 模型CN 取值的分类思路㊂对于城市LID 复杂区域,可以按下垫面种类㊁LID 设施及其组合划分为不同类型的水文响应单元(如需汇流计算还要考虑空间位置进一步细分),构建分布式SCS-CN 有效降雨修正模型㊂其中,需要说明如下:①分别对不透水地表㊁渗透地表及LID 设施进行水文响应单元划分及编号㊂②对于不透水地表,累计下渗量F =0,降雨径流损失主要为地表填洼损失,更宜采用Linsley 公式进行模拟;对于渗透地表及LID 设施,可以构建基于SCS-CN 有效降雨修正模型的分布式模型㊂③对于有些LID 设施,需考虑其蓄存容积对降雨径流的影响[15]㊂例如对下凹绿地等,在计算底部土壤下渗产流后,还需考虑上部下凹容积对产流的蓄存作用,下凹容积蓄满外溢后的水流方为下凹绿地降雨径流㊂④对于有些不透水地表,也需考虑中端蓄水池㊁蓄水罐等蓄水设施对地表径流的蓄存作用㊂具体方程如下:Rᶄ=ðm i =1Aᶄi A P -Δmax,i 1-exp -P Δmax,i ()[]-D i {},㊀㊀P ȡ13Δmax (19)Rᵡ=ðn j =1Aᵡj A [κj (P -λS j )]2κj (P -λS j )+S j -D j{}(20)R =Rᶄ+Rᵡ(21)式中:R ᶄ为不透水地表径流深,mm;R ᵡ为渗透地表及LID 设施径流深,mm;m 与i ㊁n 与j 分别为不透水地表㊁渗透地表及LID 设施划分水文响应单元类型数量㊁编号;Aᶄi 为i 单元面积,m 2;Δmax,i 为i 单元最大填洼损失量,mm;D i 为i 单元蓄水设施蓄存容积,mm;Aᵡj 为j 单元面积,m 2;κj 为j 单元有效降雨修正系数;S j为j 单元当时可能最大滞留量,mm;D j 为j 单元LID 设施蓄存容积,mm㊂2㊀应用案例2.1㊀研究区概况北京双紫园小区是北京市最早开展雨水利用的示范工程之一㊂该小区位于海淀区双紫支渠南侧㊁北洼路㊀第4期申红彬,等:分布式SCS-CN有效降雨修正模型建立及应用557㊀西侧,由3栋塔楼㊁1栋排楼以及一些配套建筑物组成(图2(a)),总面积约2.3hm2,其中建筑屋顶面积约0.6hm2,道路㊁庭院㊁停车场面积约10hm2,绿地面积约0.7hm2(表1)[16],土壤类型为重壤土,稳定下渗率为0.3mm/min㊂小区汇流区域分为屋顶(包括2栋塔楼,汇流面积约1350m2)与道路(包括不透水/透水路面㊁绿地㊁庭院㊁停车场等,汇流面积约15088m2)㊂2004年9月,基于LID理念,小区对地表下垫面进行了升级改造㊂具体改造措施包括:①增铺透水铺装,相应面积由880m2增至4582m2;②绿地下凹改造,将小区内绿地下挖5cm,对于一些下挖难度较大的绿地,则用石埂圈围,使其达到下凹绿地的效果㊂图2㊀小区平面布置与降雨径流监测方案示意Fig.2Plane layout and rainfall-runoff monitoring scheme in the study area表1㊀小区土地利用类型及面积百分比统计表Table1Statistics of land use types and area percentage土地利用类型下垫面属性面积/m2占总面积百分比/%主要建筑物屋顶不透水地表337114.2配套建筑物屋顶不透水地表258811.1道路㊁庭院㊁停车场不透水㊁渗透混合地表1038744.1绿地渗透地表725430.6总面积不透水㊁渗透混合地表23600100.02.2㊀降雨径流监测数据北京双紫园小区在地表下垫面改造前后均开展有降雨径流实际监测㊂其中,降雨监测采用自记式雨量计进行连续监测,仪器安装在住宅楼顶部,相关数据直接记录在存储卡上,记录间隔时间为1min,每隔一定时间人工去现场通过数据线连接电脑读取;径流监测采用 液位计+三角堰 测量方法,分别在屋顶与道路管道末端安装三角堰(图2(b))并配置液位计,对水位及流量过程进行连续监测,液位计数据自动存储在系统内,记录间隔时间为1min,每隔一定时间人工去现场通过数据线连接电脑读取㊂基于液位计量测水位过程数据,通过堰前水位与流量关系曲线换算为流量过程;对不同场次降雨流量过程,通过时间积分,可以得到场次降雨径流量,径流量与汇流面积相除可以转化为径流深㊂图3为收集㊁整理得到的双紫园小区地表下垫面改造前后道路汇流区域的降雨㊁径流监测数据,共计有558㊀水科学进展第34卷㊀51场有效降雨㊁径流数据㊂其中,地表下垫面改造前为18场,降水量为8~51mm,径流深为0~14mm;改造后为33场,降水量为5~88mm,径流深为0~12mm,径流削减效果明显㊂另外,图中还给出根据前5d 累计降水量对不同场次降雨土壤前期湿润程度的判别结果㊂可以看出,除个别情况外,多数情况下土壤前期湿润等级为AMC Ⅰ级㊂图3㊀道路汇流区域降雨㊁径流监测数据Fig.3Rainfall and runoff monitoring data of the road watershed 3㊀模型应用结果3.1㊀模型效果评价指标分别采用确定性系数(R 2)与Nash-Sutcliffe 效率系数(E NS )对模型效果进行量化评价[17-18]㊂其中,确定性系数是评价模拟效果最为基本的评价指标,变化范围为0~1.0;Nash-Sutcliffe 效率系数是判定残差与实测值数据方差相对量的标准化统计值,变化范围为-ɕ~1.0;两者数值越趋近于1.0说明模型精度越高,当E NS ɤ0时说明模拟值与实测值存在较大偏差㊂相应计算公式分别为:R 2=ðn i =1R c,i -1n ðn i =1R c,i ()R o,i -1n ðn i =1R o,i ()[]2ðn i =1R c,i -1n ðni =1R c,i ()2ðn i =1R o,i -1n ðn i =1R o,i ()2(22)E NS =1-ðn i =1(R c,i -R o,i )2ðn i =1R o,i -1n ðn i =1R o,i ()2(23)式中:R o,i 为径流深实测值,mm;R c,i 为径流深计算值,mm;i 为序号;n 为样本容量㊂3.2㊀模拟结果与讨论基于分布式SCS-CN 有效降雨修正模型,并对渗透地表分别取κ=1.0与κ<1.0(具体率定),对双紫园小区不同场次降雨径流进行模拟,包括参数率定㊁模型应用与验证:(1)参数率定㊂以小区地表下垫面改造前道路汇流区域的降雨㊁径流监测数据为基础,开展模型参数率定,结果如表2所示㊂其中,对于曲线数CN 值的率定,首先,根据式(5)反推计算当时可能最大滞留量,并取算术平均值约为50.5mm,相应CN 值约为83;其次,通过查阅SCS 手册,并根据土壤前期湿润等级,㊀第4期申红彬,等:分布式SCS-CN有效降雨修正模型建立及应用559㊀初步选定绿地㊁透水铺装等下垫面CN值;最后,对不同类型下垫面CN值进行优化调整,并要求不同类型下垫面CN值按面积加权平均值在83左右㊂另外,不透水道路最大填洼损失值(Δmax)较大,是由于其相连地下管网末端安装有三角堰,形成一定的蓄水空间,这里进行了综合考虑㊂(2)模型应用与验证㊂基于表2中的模型参数,结合小区地表下垫面改造后道路汇流区域的降雨㊁径流监测数据,开展分布式SCS-CN有效降雨修正模型的应用与验证,结果如图4所示,相应确定性系数与Nash-Sutcliffe效率系数值同列于表2㊂表2㊀模型参数与效果评价统计表Table2Statistics of model parameters and performance evaluation results下垫面种类模型参数模型效果评价指标κ面积比例κ=1.0κ<1.0改造前改造后λN CΔmax/mm D/mm R2E NSκ=1.0κ<1.0κ=1.0κ<1.0不透水道路绿地普通绿地下凹绿地透水铺装 0.390.14 301.00.710.540.540.2721.00.700.070.320.27850100.910.920.830.91图4㊀分布式SCS-CN有效降雨修正模型径流模拟值与实测值比较Fig.4Comparison between the simulated and measured runoff using the distributed SCS-CN model with revised effective precipitation ㊀㊀综合图4与表2可以看出,基于分布式SCS-CN有效降雨修正模型,并对渗透地表有效降雨修正系数分别取值等于1.0与小于1.0,两者对双紫园小区不同场次降雨径流深的模拟值与实测值散点均位于45ʎ线附近㊁符合较好,确定性系数与Nash-Sutcliffe效率系数分别为0.91与0.83㊁0.92与0.91,后者效果优于前者,说明对渗透地表有效降雨修正系数取值小于1.0能够有效提高模拟效果㊂后期,应在前述有效降雨修正系数计算表达式(12)㊁(17)的基础上,进一步深入分析不同降雨与下垫面土壤下渗条件对κ值变化的影响㊂4㊀结㊀㊀论本文基于SCS-CN标准模型,经与SCS-CN改进模型比较,通过引入有效降雨修正系数,构建SCS-CN 有效降雨修正模型及其分布式模型,并开展模型应用与效果检验,得到主要结论如下:(1)对于SCS-CN有效降雨修正模型,当对修正系数取值等于1.0时,其等同于标准模型,当对修正系数取值小于1.0时,其等效于改进模型;修正系数表征了径流系数随降雨量增大而变化趋向稳定的极限值㊂560㊀水科学进展第34卷㊀(2)对于城市低影响开发复杂区域,综合考虑低影响开发设施蓄存容积对降雨径流的影响,构建了基于水文响应单元的分布式SCS-CN有效降雨修正模型㊂(3)应用分布式SCS-CN有效降雨修正模型,分别对渗透地表有效降雨修正系数取值等于1.0与小于1.0,两者对不同场次降雨径流深的模拟值与实测值散点均位于45ʎ线附近㊁符合较好,确定性系数与Nash-Sutcliffe效率系数值分别为0.91与0.83㊁0.92与0.91,后者效果优于前者,说明对渗透地表有效降雨修正系数取值小于1.0能够有效提高模拟效果㊂参考文献:[1]任梅芳,徐宗学,庞博.变化环境下城市洪水演变驱动机理:以北京市温榆河为例[J].水科学进展,2021,32(3): 345-355.(REN M F,XU Z X,PANG B.Driving mechanisms of urban floods under the changing environment:case study in the Wenyu River basin[J].Advances in Water Science,2021,32(3):345-355.(in Chinese))[2]刘家福,蒋卫国,占文凤,等.SCS模型及其研究进展[J].水土保持研究,2010,17(2):120-124.(LIU J F,JIANG W G,ZHAN W F,et al.Processes of SCS model for hydrological simulation:a review[J].Research of Soil and Water Conserva-tion,2010,17(2):120-124.(in Chinese))[3]雷晓玲,邱丽娜,魏泽军,等.基于SCS-CN模型在山地海绵城市不同下垫面径流预测的优化及应用[J].中国农村水利水电,2021(11):49-52,57.(LEI X L,QIU L N,WEI Z J,et al.Optimization and application of SCS-CN model for runoff prediction of different underlying surfaces in mountain sponge cities[J].China Rural Water and Hydropower,2021(11):49-52, 57.(in Chinese))[4]冯憬,卫伟,冯青郁.黄土丘陵区SCS-CN模型径流曲线数的计算与校正[J].生态学报,2021,41(10):4170-4181. (FENG J,WEI W,FENG Q Y.The runoff curve number of SCS-CN method in loess hilly region[J].Acta Ecologica Sinica, 2021,41(10):4170-4181.(in Chinese))[5]李丽,王加虎,郝振纯,等.SCS模型在黄河中游次洪模拟中的分布式应用[J].河海大学学报(自然科学版),2012,40 (1):104-108.(LI L,WANG J H,HAO Z C,et al.Distributed application of SCS model to flood simulation in middle reaches of Yellow River[J].Journal of Hohai University(Natural Sciences),2012,40(1):104-108.(in Chinese))[6]李鑫川,贺巧宁,张友静.SCS-CN模型的改进及其空间尺度效应[J].南水北调与水利科技,2019,17(5):64-70, 130.(LI X C,HE Q N,ZHANG Y J.Improved SCS-CN model and its spatial scale effect analysis[J].South-to-North Water Transfers and Water Science&Technology,2019,17(5):64-70,130.(in Chinese))[7]MISHRA S K,SINGH V P,SANSALONE J J,et al.A modified SCS-CN method:characterization and testing[J].Water Re-sources Management,2003,17(1):37-68.[8]MISHRA S K,TYAGI J V,SINGH V P,et al.SCS-CN-based modeling of sediment yield[J].Journal of Hydrology,2006, 324(1/2/3/4):301-322.[9]SHI W H,WANG N.Improved SMA-based SCS-CN method incorporating storm duration for runoff prediction on the Loess Plat-eau,China[J].Hydrology Research,2020,51(3):443-455.[10]吴艾璞,王晓燕,黄洁钰,等.基于前期雨量和降雨历时的SCS-CN模型改进[J].农业工程学报,2021,37(22):85-94.(WU A P,WANG X Y,HUANG J Y,et al.Improvement of SCS-CN model based on antecedent precipitation and rainfallduration[J].Transactions of the Chinese Society of Agricultural Engineering,2021,37(22):85-94.(in Chinese)) [11]李润奎,朱阿兴,陈腊娇,等.SCS-CN模型中土壤参数的作用机制研究[J].自然资源学报,2013,28(10):1778-1787.(LI R K,ZHU A X,CHEN L J,et al.Effects of soil parameters in SCS-CN runoff model[J].Journal of Natural Re-sources,2013,28(10):1778-1787.(in Chinese))[12]武晟,汪志荣,张建丰,等.不同下垫面径流系数与雨强及历时关系的实验研究[J].中国农业大学学报,2006,11(5):55-59.(WU S,WANG Z R,ZHANG J F,et al.Experimental study on relationship among runoff coefficients of differentunderlying surfaces,rainfall intensity and duration[J].Journal of China Agricultural University,2006,11(5):55-59.(in Chinese))[13]彭定志,游进军.改进的SCS模型在流域径流模拟中的应用[J].水资源与水工程学报,2006,17(1):20-24.(PENGD Z,YOU J J.Application of modified SCS model into runoff simulation[J].Journal of Water Resources and Water Engineering,㊀第4期申红彬,等:分布式SCS-CN有效降雨修正模型建立及应用561㊀2006,17(1):20-24.(in Chinese))[14]申红彬,徐宗学,张书函.流域坡面汇流研究现状述评[J].水科学进展,2016,27(3):467-475.(SHEN H B,XU ZX,ZHANG S H.Review on the simulation of overland flow in hydrological models[J].Advances in Water Science,2016,27(3):467-475.(in Chinese))[15]赵飞,张书函,桑非凡,等.透水砖铺装系统产流特征研究[J].中国给水排水,2022,38(15):133-138.(ZHAO F,ZHANG S H,SANG F F,et al.Runoff characteristics of permeable brick pavement system[J].China Water&Wastewater, 2022,38(15):133-138.(in Chinese))[16]张勤.城市小区实施LID措施的径流减控效果研究[D].南京:河海大学,2017.(ZHANG Q.Study on the effect of LIDmeasures on runoff control in urban disricts[D].Nanjing:Hohai University,2017.(in Chinese))[17]NASH J E,SUTCLIFFE J V.River flow forecasting through conceptual models:part I:a discussion of principles[J].Journal ofHydrology,1970,10(3):282-290.[18]胡胜,曹明明,邱海军,等.CFSR气象数据在流域水文模拟中的适用性评价:以灞河流域为例[J].地理学报,2016,71(9):1571-1586.(HU S,CAO M M,QIU H J,et al.Applicability evaluation of CFSR climate data for hydrologic simula-tion:a case study in the Bahe River basin[J].Acta Geographica Sinica,2016,71(9):1571-1586.(in Chinese))A distributed SCS-CN model with revised effective precipitation∗SHEN Hongbin1,XU Zongxue2,CAO Bing3,WANG Haizhou1(1.Henan Provincial Key Laboratory of Hydrosphere and Watershed Water Security,North China University of Water Resources and Electric Power,Zhengzhou450045,China;2.Beijing Key Laboratory of Urban Hydrological Cycle and Sponge City Technology, Beijing Normal University,Beijing100875,China;3.Dongying Water Authority,Dongying257091,China) Abstract:To solve the problem of the equation structure becoming more complex in the improved soil conservation service curve number(SCS-CN)model,a SCS-CN model with revised effective precipitation(SCS-CN-REP)is proposed by introducing a revised coefficient after a comparison between the standard SCS-CN model and the improved model.Furthermore,for the complex area with low impact development(LID)in a city,a distributed SCS-CN-REP model was developed based on a hydrological response unit division in which the effects of the LID facilityᶄs storage capacity on rainfall-runoff are also considered.Finally,taking the Shuangzi residential district in Beijing City as a study area,the rainfall-runoff is simulated and compared using the distributed SCS-CN-REP model.An analysis of the SCS-CN-REP model showed that when the revised coefficient is1.0,it is equivalent to the standard model, when the revised coefficient is smaller than1.0,it is equivalent to the improved model.In essence,the revised coefficient is a limit value of the runoff coefficient varied with the increase in precipitation.The distributed SCS-CN-REP model application results demonstrated that the calculated runoff depth values are in good agreement with the measured values.The determination coefficients and Nash efficiency coefficient are0.91and0.83when the adopted value of the revised coefficient for permeable surfaces is1.0,and are0.92and0.91when the adopted value is less than1.0.The effects of the latter model are better than the former,indicating that the simulation effect can be effectively improved when the adopted value of the revised coefficient for permeable surfaces is less than1.0in the distributed SCS-CN-REP model.Key words:SCS-CN model;effective precipitation;revised coefficient;distributed;low impact development∗The study is financially supported by the National Natural Science Foundation of China(No.52239003)and the Opening Foundation of Beijing Key Laboratory of Urban Hydrological Cycle and Sponge City Technology(No.HYD2019OF02).。
scs水文模型例题SCS水文模型是一种常用的水文模型,用于计算流域产流。
这个模型是根据土壤保持服务(Soil Conservation Service)所开发的,因此得名SCS水文模型。
下面我将以一个例题来解释SCS水文模型的应用。
假设我们有一个流域,其面积为100平方公里,土壤类型为粘土壤,平均坡度为5%,年降雨量为800毫米。
我们希望利用SCS水文模型来估算该流域的产流量。
首先,根据流域的基本信息,我们可以使用SCS曲线数表来确定该流域的曲线数。
曲线数是根据流域的地形、土壤类型和植被覆盖等因素来确定的,它反映了流域的产流特性。
假设根据SCS曲线数表,我们确定该流域的曲线数为70。
其次,我们可以利用SCS单位线法来计算该流域的产流量。
SCS 单位线法是根据降雨量、土壤类型和曲线数来估算产流量的方法。
根据该方法,我们可以计算出该流域的产流系数为0.2。
最后,我们可以利用SCS水文模型的产流计算公式来计算该流域的产流量。
产流量 = 降雨量(P 0.2S)^2 / (P + 0.8S),其中P为降雨量,S为最大蓄水量,根据流域的特性和SCS曲线数,我们可以计算出最大蓄水量为5毫米。
将具体数值代入公式中,我们可以计算出该流域的年产流量为:产流量 = 800 (800 0.25)^2 / (800 + 0.85) = 64.8毫米。
因此,根据SCS水文模型,该流域的年产流量为64.8毫米。
总结来说,SCS水文模型通过考虑流域的地形、土壤类型、植被覆盖和降雨量等因素,可以较为准确地估算流域的产流量,对于水资源管理和防洪工程具有重要的应用意义。
scs水文模型例题SCS水文模型是美国农业部土壤保持服务的一种水文模型,用于评估降雨径流过程和设计水文结构。
它是一种简单但广泛应用的模型,可以帮助工程师和农民进行农田和水资源管理。
下面是一个SCS水文模型的例题,让我们来详细了解一下。
假设某农田的土壤类型为A类,坡度为5%,具有良好的排水条件。
该农田的面积为50英亩,通过SCS水文模型来计算降雨产流量。
首先,我们需要确定该农田的土壤最大含水量。
根据SCS水文模型,A类土壤的最大含水量为1.3英寸。
由于该农田的面积为50英亩,将其转换为英亩英寸,得到最大蓄水容量为65英亩英寸。
接下来,我们需要确定农田的CN值,即覆盖条件。
由于该农田具有良好的排水条件,我们可以假设CN值为65。
CN值的范围从0到100,数值越大表示土地的蓄水能力越好,降雨产流量越小。
然后,我们需要确定降雨的过程。
假设降雨强度为2英寸/小时,降雨时间为2小时。
根据SCS水文模型,降雨产流量可以通过下面的公式计算:Q = P - 0.2S^2 / (P + 0.8S) + 0.8S其中,Q表示降雨产流量,P表示降雨量,S表示蓄水量。
根据公式,我们可以计算得到:P = 2英寸S = 65英亩英寸将这些值代入公式中,我们可以得到:Q = 2 - 0.2 * 65^2 / (2 + 0.8 * 65) + 0.8 * 65计算得到的降雨产流量为1.8英寸。
最后,我们可以将降雨产流量转换为实际的径流量。
假设农田的径流系数为0.3,即降雨产流量的30%会转化为实际的径流量。
将降雨产流量乘以径流系数,我们可以得到实际的径流量:R = 1.8英寸 * 0.3 = 0.54英寸因此,该农田在2小时的降雨过程中,实际的径流量为0.54英寸。
SCS水文模型可以帮助农民和工程师进行农田和水资源管理。
通过计算降雨产流量和实际的径流量,我们可以了解到农田的水文特性,并做出合理的决策,如排水系统的设计和灌溉管理。
Chapter 2ProceduresPart 630National Engineering HandbookProceduresChapter 2Issued April 1999The United States Department of Agriculture (USDA) prohibits discrimina-tion in all its programs and activities on the basis of race, color, national origin, gender, religion, age, disability, political beliefs, sexual orientation,and marital or family status. (Not all prohibited bases apply to all pro-grams.) Persons with disabilities who require alternate means for communi-cation of program information (Braille, large print, audiotape, etc.) should contact the USDA’s TARGET Center at (202) 720-2600 (voice and TDD).To file a complaint of discrimination, write USDA, Director, Office of Civil Rights, Room 326W, Whitten Building, 14th and Independence Avenue, SW,Washington, DC 20250-9410, or call (202) 720-5964 (voice or TDD). USDA is an equal opportunity employer.Chapter 2, Procedures, was originally prepared by Victor Mockus (retired) in 1964. It was reprinted with minor revisions in 1972. This version was prepared by the Natural Resources Conservation Service under the guid-ance of Donald E. Woodward, national hydraulic engineer, Washington, DC.Part 630National Engineering HandbookProceduresChapter 2Contents:630.0200Introduction2–1630.0201Work outline plan and schedule relationship2–1(a)Data collection..............................................................................................2–1(b)Computations................................................................................................2–1(c)Analyses.........................................................................................................2–1630.0202Hydrologic evaluation process2–2(a)Work sequence..............................................................................................2–2(b)Analysis methods..........................................................................................2–4630.0203Design hydrology2–6Figures Figure 2–1General process hydrology of watershed project2–3evaluation with streamflow and rainfall data availableFigure 2–2General process hydrology of watershed project2–5evaluation with streamflow or rainfall data not availableFigure 2–3Design hydrology for storage and spillways2–7in floodwater retarding structures630.0200Introduction Hydrology for the evaluation of watershed projects is a major concern in part 630 of the National Engineering Handbook. The evaluation is a detailed investigation of present (no project) and future (with project) condi-tions of a watershed to determine whether given objectives will be met. It is the basis on which recom-mendations for or against the project are founded. A summary of the evaluation is included in a work plan, which is the official document for carrying out, main-taining, and operating the project. The hydrology is not difficult, but it is complex. The procedures de-scribed in this chapter serve both as a guide to hydrol-ogy studies and as a unifying introduction to succeed-ing chapters of part 630.A project evaluation begins with a preliminary investi-gation (PI), which is a brief study of a potential project to estimate whether a detailed investigation is justified (see chapter 3). If it is, information from the PI is used in writing a work outline that gives the desired scope, intensity, and schedule of the planning study; its estimated cost; the personnel needed; and the comple-tion date for a work plan.An important part of the planning study is the hydro-logic evaluation, in which data collection, computa-tion, and analysis are equally important divisions of work. Availability governs the collection of data. Size or cost of project influences the choice of computa-tional and analytical methods (see chapter 1). National Resources Conservation Service (NRCS) policy deter-mines the number and kind of analyses. Nevertheless, the basic evaluation procedure does not vary. It is flexible because some tasks can be done simulta-neously or in a preferred sequence and nearly all tasks can be done by a preferred method, but the general plan is invariable. The work outline schedule follows the plan in principle. The plan, schedule, and chapters in part 630 are related as shown in the following sec-tions.630.0201Work outlineplan and schedule relation-ship(a)Data collectionBase maps, project area maps (chapter 3), rainfall data (chapter 4), and runoff data (chapter 10) are collected early in the study. Field surveys provide stream cross sections and profiles (chapter 6) and dam site maps. Interviews with local NRCS personnel provide data on hydrologic soil-cover complexes (chapters 7, 8, and 9) and runoff curve numbers (chapter 10).(b)ComputationsStorm runoffs (chapter 10), snowmelt runoffs (chapter11), special effects of land use and treatment (chapter12), and the relations of stream stages to inundation (chapter 13) and discharge (chapter 14) are computed early in this phase of the study. Travel times and lags (chapter 15) are computed for use in hydrograph construction (chapter 16) and flood routing (chapter17). Runoff or peak discharge frequencies (chapter18), transmission losses (chapter 19), and watershed yield (chapter 20) are computed only if they are re-quired in the study.(c)AnalysesFour conditions of a watershed are studied in accor-dance with NRCS policy. In order of study they are:1.Present—Condition of the watershed at the timeof the survey; and the base to which the pro-posed project is added.2.Future with no project—Expected future condi-tion of the watershed with no project actiontaken.3.With future land use and treatment measures—Proposed land use and treatment measures areadded to the first condition. The measures aredescribed in the National Watershed Manual.4.With future land use and treatment measures andstructures—Watershed protection and floodprevention structures are added to the thirdcondition. The structures are described in theNational Watershed Manual.Part 630National Engineering HandbookProceduresChapter 2This order makes the analysis fall into a natural se-quence in which measures that are first to affectrunoff are first to be evaluated. Flood routings for the present condition give the discharges from which present flood damages are computed in the economic evaluation. The routings are modified (chapter 12) to give discharges for determining the effects of land use and treatment. New routings or further modifications (chapter 17) are made for the third condition to give discharges for determining the effects of structures.Generally, it is the third condition that is studied at great length because an optimum number and location of structures are desired. Final design of individual structures is made late in the investigation or after the work plan is approved. The hydrology and NRCS hydrologic criteria for design are given in chapter 21,TR60, and section IV of the Field Office Technical Guide (FOTG).630.0202Hydrologic evaluation processIn both the computational and analytical phases, use of hydrologic and hydraulic computer models can substanially reduce the work time. Such models can estimate runoff hydrographs; route hydrographs through reservoirs, lakes, channels, and flood plains;combine hydrographs as necessary; and determine stage/discharge/acres flooded relationships. Twofrequently used NRCS computer models include Tech-nical Release 20 (Project Formulation - Hydrology,1983) and Part 630, chapter 31, Computer Program for Water Surface Profiles (1994). The Corps of Engineers also have several hydrologic and hydraulic models that can be useful in project analyses.(a)Work sequenceThe sequence of work in the hydrologic evaluation is shown in figure 2–1. The forms of maps, graphs, and tables are simplified representations of the various standard forms used in the different States. The pre-liminary investigation, which precedes the evaluation,is described in chapter 3. The design hydrology comes later, and details are given in chapter 21.After evaluation for the present conditions (the first condition) is completed, the early steps of the evalua-tion process do not always need to be repeated for the remaining conditions. Evaluations for future condi-tions should include one that considers the future with no project measures and that accounts for expected future land use changes without any project. Depend-ing on the nature of these expected changes, the hydrologic soil-cover complexes and corresponding runoff curve numbers would be altered, affecting the runoff hydrographs. The condition with the future land use and treatment measures would start the evaluation process at the hydrologic soil-cover complexes step.At this step the soil-cover complexes would be modi-fied to reflect different land use/treatment conditions,which would ultimately again be reflected in the flow hydrographs. Finally, the condition with future land use and treatment measures plus structural measures would start the evaluation process at the unit hydro-graph step by modifying the unit hydrograph to reflect the structures being in place.Part 630National Engineering HandbookProceduresChapter 2Figure 2–1General process hydrology of watershed project evaluation with streamflow and rainfall data availablePart 630National Engineering HandbookProceduresChapter 2Of the basic data needed in the evaluation, only the historical rainfall and streamflow data are likely to be unavailable; the rest are obtainable from field cking rainfall and runoff data, the procedure goes as shown in figure 2–2. The rainfall-frequency data shown in the figure are from U.S. Weather Bureau, National Weather Service, and NOAA publications (see part 630, chapter 4). Direct checks on runoff cannot be made, but indirect checks can be made if nearby watersheds are gaged (see table 5–2).Some steps in the procedures of figures 2–1 and 2–2are taken in an entirely different way in the methods for regional analysis.(b)Analysis methods(1)Regional analysis methodThis method estimates the magnitudes and frequencies of peak discharges or runoff volumes for ungaged watersheds by using relationships from nearby gaged watersheds. Some of the hydraulic work, construction of hydrographs, and flood routing are reduced or eliminated from the evaluation, but not from the design hydrology. The method in its simplest form is as follows:Step 1Select nearby gaged watersheds that are climatically and physically similar to the ungagedwatershed. These watersheds compose the region that gives the method its name.Step 2Construct frequency lines (chapter 18) for peak discharges or runoff volumes of the gaged water-sheds.Step 3Plot peak discharges or runoff volumes for selected frequencies (only the 2- and 100-year frequen-cies if the frequency lines are straight) of each gaged watershed against its drainage area size. Use log-log paper for the plotting, and make straight-line relation-ships for each frequency. A simple regression between log (drainage area) and log (discharge or runoff vol-ume) aids in estimating this best fit straight line through the data.Step 4Construct the frequency line for the ungaged watershed (or any of its subdivisions). To do this,enter the plot with drainage area, find the magnitudesat each line of relationship, plot the magnitudes at their proper places on probability paper, and draw the frequency line through the points.Step 5Apply the frequency lines of step 4 in the procedure for present conditions. Discharges or vol-umes for with-project conditions are obtained by use of auxiliary relationships described in chapters 12 and 17In practice the method is more complex, but generally only in step 3. In this step variables in addition todrainage area are related to the peaks or volumes. The variables include one or more of the following, alone or in combination, directly or by means of index numbers:•type of climate•mean annual precipitation or rainfall or snowfall •mean seasonal precipitation or rainfall or snow-fall•maximum or minimum average monthly rainfall •storm pattern •storm direction•x-year frequency, y-hour duration rainfall•mean number of days with rainfall greater than x inches•mean annual number of thunderstorm days•mean annual or seasonal or monthly temperature •maximum or minimum average monthly tem-perature•orographic effects •aspect•stream density •stream pattern•length of watershed•length to center of gravity of watershed •length of main channel •average watershed width •altitude•watershed rise•main channel slope •land slope•depth or top width of main channel near outlet for x-year frequency discharge •time of concentration •lag•time to peak•percentage of area in lakes or ponds •extent or depth of shallow soils •extent of major coverFigure 2–2General process hydrology of watershed project evaluation with streamflow or rainfall data not available•hydrologic soil-cover complex •geologic region •infiltration rate •mean base flow •mean annual runoff •watershed shapeCombinations of these variables are used as single variables in the analysis, one such combination being the product of watershed length and length to center of gravity divided by the square root of the main chan-nel slope. Index numbers (chapter 18) are used for variables, such as geologic region, not ordinarily defined by numerical values.Multiple regression methods (chapter 18) must be used if more than one variable appears in the relation-ship. The only adequate measure of the accuracy of the relationship (therefore of the regional analysis) is the standard error of estimate in arithmetic putation of the error is illustrated in chapter 18.(2)USGS regional regression equations Another source for determining relative effects of watershed characteristics on discharge is United States Geological Survey (USGS) regional regression equations. The USGS has performed multiple regres-sion analyses on gaged watersheds for each state.They correlated such watershed characteristics as drainage area, climatic region, watershed slope, water-shed storage, and others to peak discharge. The re-gression equations can be useful for transferring datafrom gaged watersheds to the watershed of interest.630.0203Design hydrologyThe storage and spillway capacities of floodwater retarding structures are determined as shown by the flowchart in figure 2–3. Chapter 21 gives details of the various steps and provides the NRCS criteria of the design hydrology. That chapter also contains design hydrology in outline form for channel improvement,levees, and minor project or onfarm structures.Figure 2–3Design hydrology for storage and spillways in floodwater retarding structures。