华南理工大学信号与系统大作业
- 格式:pdf
- 大小:943.12 KB
- 文档页数:24
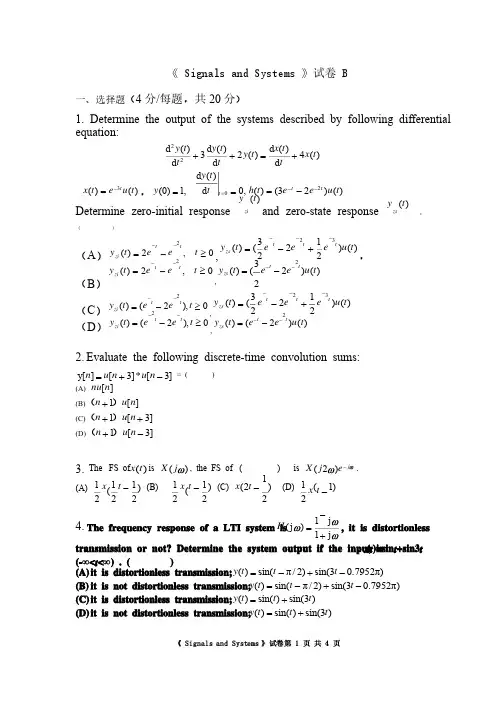
,考试作弊将带来严重后果!华南理工大学期末考试《 信号与系统 》试卷A1. 考前请将密封线内各项信息填写清楚; 所有答案请直接答在试卷上(或答题纸上); .考试形式:闭卷;填空题(共32分,每小题 4 分)、考虑信号 t t x 0cos )(ω=,其基波频率为0ω。
信号)()(t x t f -=的付立叶级数系数是 A )(A)为其它k a a a k ,0,211-1=== (B) 为其它k a ja a k ,0,211-1=== (C) 为其它k a a a k ,0,21,211-1=-== (D) 为其它k a a a k ,0,2j1,2j 11-1=-==、设信号)(t f 的傅立叶变换为)(ωj F ,则信号)21()21(t f t --的傅里叶变换是( A )(A)(B)(C)2j e )]2j (F [d d ωω-ω (D) )]2j (F [d d ωω 、已知信号)(t ω=)(1t x )(2t x ,用一周期为T 的均匀冲激串对其采样,样本记为)(t p ω。
)(1t x 1ω,)(2t x 带限于2ω,即2211||,0)(||,0)(ωωωωωω≥=≥=j X j X ,要使)(t ω通过利用某一理想低通滤波器能从)(t p ω中恢复出来,最大的采样间隔T 为( D )。
(A)212ωωπ+ (B) 12ωπ (C) 22ωπ (D) 21ωωπ+4、已知]1[1)s (T a)(s e as X +--+=,其逆变换式)(t x 为( A )。
(A))]()([T t u t u e at --- (B) )]()([T t u t u e at +-- (C) )(t u e at - (D) )]()([T t u t u e at -+5、已知一因果离散序列]n [x 的Z 变换为X(z)=1325122+++---z z z ,则]0[x =( A );(A )2 (B)5 (C)0 (D)1/26、下列说法正确的是( B ) (A ) 累加器∑-∞==nk k x n y )()(是无记忆系统(B ) LTI )2()(4-=-t u e t h t是因果系统 (C ) [])2()(sin )(-+=t x t x t y 是线性系统 (D ) ()()y t tx t =是稳定系统7、已知一离散LTI 系统的脉冲响应h[n]=δ[n]+2δ[n-1]-3δ[n-2],则该系统的单位阶跃响应S[n]等于(C )(A) δ[n]+δ[n-1]-5δ[n-2]+ 3δ[n-3] (B) δ[n](C) δ[n]+3δ[n-1](D) δ[n]+δ[n-1]-2δ[n-2] 8 信号45[]cos()2jn x n n eππ=+,其基波周期为(A )(A ) 20s (B ) 10s (C ) 30s (D )5s二、 填空题(共20分,每小题 4 分)1、信号失真的类型有( 幅度失真、相位失真、频率失真 )。
实验二利用DFT 分析离散信号频谱实验日期:评 分:一、实验目的应用离散傅里叶变换(DFT),分析离散信号x [k ]。
深刻理解利用DFT 分析离散信号频谱的原理,掌握改善分析过程中产生的误差的方法。
二、实验原理根据信号傅里叶变换建立的时域与频域之间的对应关系,可以得到有限长序列的离散傅里叶变换(DFT)与四种确定信号傅里叶变换的之间的关系,实现由DFT 分析其频谱。
三、实验内容1.利用FFT 分析信号的频谱;(1)确定DFT 计算的参数;(2)进行理论值与计算值比较,讨论信号频谱分析过程中误差原因及改善方法。
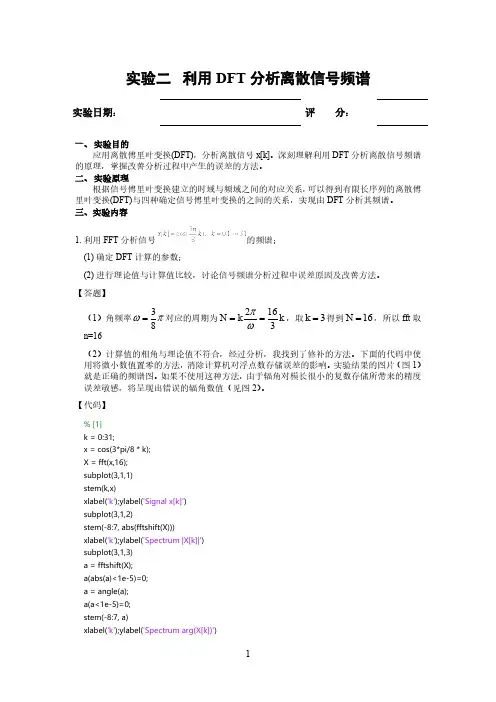
【答题】(1)角频率πω83=对应的周期为k k N 3162==ωπ,取3=k 得到16=N ,所以fft 取n=16(2)计算值的相角与理论值不符合,经过分析,我找到了修补的方法。
下面的代码中使用将微小数值置零的方法,消除计算机对浮点数存储误差的影响。
实验结果的图片(图1)就是正确的频谱图。
如果不使用这种方法,由于辐角对模长很小的复数存储所带来的精度误差敏感,将呈现出错误的辐角数值(见图2)。
【代码】%[1]k = 0:31;x = cos(3*pi/8 * k);X = fft(x,16);subplot(3,1,1)stem(k,x)xlabel('k');ylabel('Signal x[k]')subplot(3,1,2)stem(-8:7, abs(fftshift(X)))xlabel('k');ylabel('Spectrum |X[k]|')subplot(3,1,3)a = fftshift(X);a(abs(a)<1e-5)=0;a = angle(a);a(a<1e-5)=0;stem(-8:7, a)xlabel('k');ylabel('Spectrum arg(X[k])')angle(fftshift(X))【结果截图】图1第一题的正确结果图图2第二题的错误结果图【结果分析】观察图1,得知信号)83cos(][k k x π=只具有三次谐波分量。
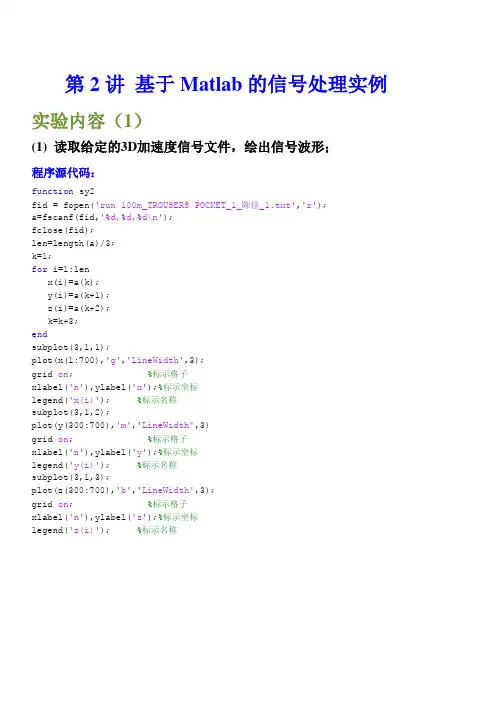
第2讲基于Matlab的信号处理实例实验内容(1)(1) 读取给定的3D加速度信号文件,绘出信号波形;程序源代码:function sy2fid = fopen('run 100m_TROUSERS POCKET_1_陈佳_1.txt','r');a=fscanf(fid,'%d,%d,%d\n');fclose(fid);len=length(a)/3;k=1;for i=1:lenx(i)=a(k);y(i)=a(k+1);z(i)=a(k+2);k=k+3;endsubplot(3,1,1);plot(x(1:700),'g','LineWidth',3);grid on; %标示格子xlabel('n'),ylabel('x');%标示坐标legend('x(i)'); %标示名称subplot(3,1,2);plot(y(300:700),'m','LineWidth',3)grid on; %标示格子xlabel('n'),ylabel('y');%标示坐标legend('y(i)'); %标示名称subplot(3,1,3);plot(z(300:700),'b','LineWidth',3);grid on; %标示格子xlabel('n'),ylabel('z');%标示坐标legend('z(i)'); %标示名称执行结果如下所示:100200300400500600700050100150200nxx(i)5010015020025030035040045050100150200250nyy(i)501001502002503003504004500100200300nzz(i)(2) 将读出的3D 加速度信号分解为偶序列及奇序列,分别绘出波形;绘出偶序列及奇序列的和信号、差信号及积信号的波形;a.分解为偶序列及奇序列,分别绘出波形: 程序源代码:function sy2oefid = fopen('run 100m_TROUSERS POCKET_1_陈佳_1.txt','r'); a=fscanf(fid,'%d,%d,%d\n'); fclose(fid);len=length(a)/3; k=1;for i=1:len x(i)=a(k); y(i)=a(k+1);z(i)=a(k+2);k=k+3;endx0=[zeros(1,len-1),x];%x前面补0x1=fliplr(x0);%x1即是反转的x0ex=(x1+x0)/2;%x的偶部ox=-(x1-x0)/2;%x的奇部y0=[zeros(1,len-1),y];y1=fliplr(y0);ey=(y1+y0)/2;oy=-(y1-y0)/2;z0=[zeros(1,len-1),z];z1=fliplr(z0);ez=(z1+z0)/2;oz=-(z1-z0)/2;subplot(3,2,1);plot([-len+1:len-1],ex ,'g','LineWidth',3); grid on; %标示格子xlabel('n'),ylabel('x');%标示坐标legend('ex(i)'); %标示名称subplot(3,2,3);plot([-len+1:len-1],ey,'m','LineWidth',3) grid on; %标示格子xlabel('n'),ylabel('y');%标示坐标legend('ey(i)'); %标示名称subplot(3,2,5);plot([-len+1:len-1],ez,'b','LineWidth',3); grid on; %标示格子xlabel('n'),ylabel('z');%标示坐标legend('ez(i)'); %标示名称subplot(3,2,2);plot([-len+1:len-1],ox,'g','LineWidth',3); grid on; %标示格子xlabel('n'),ylabel('x');%标示坐标legend('ox(i)'); %标示名称subplot(3,2,4);plot([-len+1:len-1],oy,'m','LineWidth',3) grid on; %标示格子xlabel('n'),ylabel('y');%标示坐标legend('oy(i)'); %标示名称subplot(3,2,6);plot([-len+1:len-1],oz,'b','LineWidth',3); grid on; %标示格子xlabel('n'),ylabel('z');%标示坐标legend('oz(i)'); %标示名称 sumoex=ex+ox; sumoey=ey+oy; sumoez=ez+oz;执行结果如下所示:-4000-3000-2000-100001000200030004000050100150nxex(i)-4000-3000-2000-100001000200030004000050100150200nyey(i)-4000-3000-2000-100001000200030004000050100150nzez(i)-4000-3000-2000-100001000200030004000-100-50050100nxox(i)-4000-3000-2000-100001000200030004000-200-1000100200nyoy(i)-4000-3000-2000-100001000200030004000-200-1000100200nzoz(i)b.绘出偶序列及奇序列的和信号的波形: 程序源代码:function sumoefid = fopen('run 100m_TROUSERS POCKET_1_陈佳_1.txt','r'); a=fscanf(fid,'%d,%d,%d\n'); fclose(fid);len=length(a)/3; k=1;for i=1:len x(i)=a(k); y(i)=a(k+1); z(i)=a(k+2); k=k+3; endx0=[zeros(1,len-1),x];%x 前面补0 x1=fliplr(x0);%x1即是反转的x0 ex=(x1+x0)/2;%x 的偶部 ox=-(x1-x0)/2;%x 的奇部 y0=[zeros(1,len-1),y]; y1=fliplr(y0); ey=(y1+y0)/2; oy=-(y1-y0)/2;z0=[zeros(1,len-1),z]; z1=fliplr(z0); ez=(z1+z0)/2; oz=-(z1-z0)/2; sumoex=ex+ox; sumoey=ey+oy; sumoez=ez+oz; subplot(3,1,1);plot([-len+1:len-1],sumoex ,'g','LineWidth',3); grid on ; %标示格子 xlabel('n'),ylabel('x');%标示坐标 legend('sumoex'); %标示名称 subplot(3,1,2);plot([-len+1:len-1],sumoex ,'g','LineWidth',3); grid on ; %标示格子 xlabel('n'),ylabel('x');%标示坐标 legend('sumoey'); %标示名称 subplot(3,1,3);plot([-len+1:len-1],sumoex ,'g','LineWidth',3); grid on ; %标示格子 xlabel('n'),ylabel('x');%标示坐标 legend('sumoez'); %标示名称执行结果如下所示:-4000-3000-2000-1000010002000300040000100200nxsumoex-4000-3000-2000-1000010002000300040000100200nxsumoey-4000-3000-2000-1000010002000300040000100200nxsumoezc..绘出偶序列及奇序列的差信号的波形程序源代码:function choefid = fopen('run 100m_TROUSERS POCKET_1_陈佳_1.txt','r'); a=fscanf(fid,'%d,%d,%d\n');fclose(fid);len=length(a)/3;k=1;for i=1:lenx(i)=a(k);y(i)=a(k+1);z(i)=a(k+2);k=k+3;endx0=[zeros(1,len-1),x];%x前面补0x1=fliplr(x0);%x1即是反转的x0ex=(x1+x0)/2;%x的偶部ox=-(x1-x0)/2;%x的奇部y0=[zeros(1,len-1),y];y1=fliplr(y0);ey=(y1+y0)/2;oy=-(y1-y0)/2;z0=[zeros(1,len-1),z];z1=fliplr(z0);ez=(z1+z0)/2;oz=-(z1-z0)/2;choex=ex-ox;choey=ey-oy;choez=ez-oz;subplot(3,1,1);plot([-len+1:len-1],choex ,'g','LineWidth',3);grid on; %标示格子xlabel('n'),ylabel('x');%标示坐标legend('choex'); %标示名称subplot(3,1,2);plot([-len+1:len-1],choex ,'g','LineWidth',3);grid on; %标示格子xlabel('n'),ylabel('x');%标示坐标legend('choey'); %标示名称subplot(3,1,3);plot([-len+1:len-1],choex ,'g','LineWidth',3);grid on; %标示格子xlabel('n'),ylabel('x');%标示坐标 legend('choez'); %标示名称执行结果如下所示:-4000-3000-2000-1000010002000300040000100200nx-4000-3000-2000-1000010002000300040000100200nx-4000-3000-2000-1000010002000300040000100200nxchoexchoeychoezd.绘出偶序列及奇序列的积信号的波形程序源代码:function muloefid = fopen('run 100m_TROUSERS POCKET_1_陈佳_1.txt','r'); a=fscanf(fid,'%d,%d,%d\n'); fclose(fid);len=length(a)/3; k=1;for i=1:len x(i)=a(k); y(i)=a(k+1); z(i)=a(k+2); k=k+3; endx0=[zeros(1,len-1),x];%x 前面补0 x1=fliplr(x0);%x1即是反转的x0 ex=(x1+x0)/2;%x 的偶部 ox=-(x1-x0)/2;%x 的奇部 y0=[zeros(1,len-1),y]; y1=fliplr(y0); ey=(y1+y0)/2;oy=-(y1-y0)/2;z0=[zeros(1,len-1),z]; z1=fliplr(z0); ez=(z1+z0)/2; oz=-(z1-z0)/2; muloex=ex.*ox; muloey=ey.*oy; muloez=ez.*oz; subplot(3,1,1);plot([-len+1:len-1],muloex ,'g','LineWidth',3); grid on ; %标示格子 xlabel('n'),ylabel('x');%标示坐标 legend('muloex'); %标示名称 subplot(3,1,2);plot([-len+1:len-1],muloex ,'g','LineWidth',3); grid on ; %标示格子 xlabel('n'),ylabel('y');%标示坐标 legend('muloey'); %标示名称 subplot(3,1,3);plot([-len+1:len-1],muloex ,'g','LineWidth',3); grid on ; %标示格子 xlabel('n'),ylabel('z');%标示坐标 legend('muloez'); %标示名称执行结果如下所示:-4000-3000-2000-100001000200030004000-101x 104nxmuloex-4000-3000-2000-100001000200030004000-101x 104nymuloey-4000-3000-2000-100001000200030004000-101x 104nzmuloez∑-=-=10][1][M k k n x Mn y (3) 画出M 点滑动平均滤波器的波形(M 分别取4和10); 注:M 点滑动平均滤波器:程序源代码:function m n=0:20;x=[n==0]; %单位冲击响应 a1=[0.25 0.25 0.25 0.25]; b=[1];y1=filter(a1,b,x);a2=[0.1]; %求m=10时,差分方程右边的系数 for i=1:9a2=[a2,0.1]; endy2=filter(a2,b,x); subplot(2,1,1);stem(n,y1,'g','filled')%画图,用绿色,线条加粗 title('滑动平均滤波器的波形') grid on ; %标示格子xlabel('n'),ylabel('y');%标示坐标 legend('M=4'); %标示m subplot(2,1,2);stem(n,y2,'m','filled')%画图,用品红色,线条加粗 grid on ; %标示格子 xlabel('n'),ylabel('y');%标示坐标 title('滑动平均滤波器的波形') legend('M=10'); %标示m执行结果如下所示:246810121416182000.10.20.30.4滑动平均滤波器的波形nyM=4246810121416182000.050.1ny滑动平均滤波器的波形M=10(4) 用上述滑动平均滤波器对输入的3D 加速度信号进行滤波,同时绘出输入及输出信号波形;观察分析输出波形的变化。
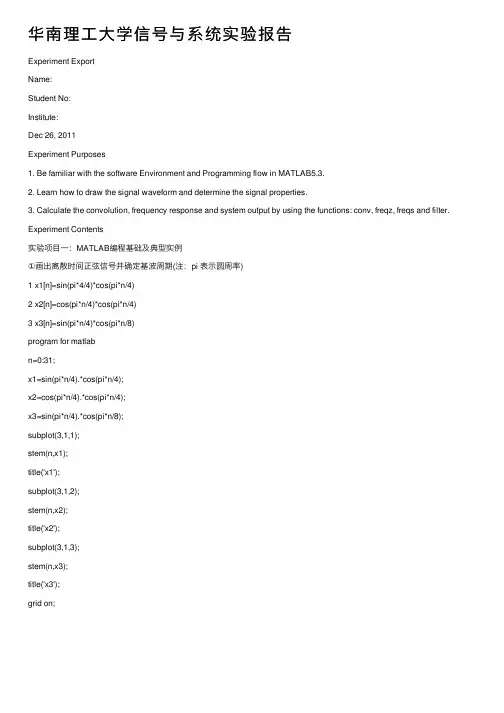
华南理⼯⼤学信号与系统实验报告Experiment ExportName:Student No:Institute:Dec 26, 2011Experiment Purposes1. Be familiar with the software Environment and Programming flow in MATLAB5.3.2. Learn how to draw the signal waveform and determine the signal properties.3. Calculate the convolution, frequency response and system output by using the functions: conv, freqz, freqs and filter. Experiment Contents实验项⽬⼀:MATLAB编程基础及典型实例①画出离散时间正弦信号并确定基波周期(注:pi 表⽰圆周率)1 x1[n]=sin(pi*4/4)*cos(pi*n/4)2 x2[n]=cos(pi*n/4)*cos(pi*n/4)3 x3[n]=sin(pi*n/4)*cos(pi*n/8)program for matlabn=0:31;x1=sin(pi*n/4).*cos(pi*n/4);x2=cos(pi*n/4).*cos(pi*n/4);x3=sin(pi*n/4).*cos(pi*n/8);subplot(3,1,1);stem(n,x1);title('x1');subplot(3,1,2);stem(n,x2);title('x2');subplot(3,1,3);stem(n,x3);title('x3');grid on;Conclusion: These signals is periodic, the first and second signal’s per iod are 4. The third signal’s period is 16.②离散时间系统性质:离散时间系统往往是⽤⼏个性质来表征,如线性、时不变性、稳定性、因果性及可逆性等。
,考试作弊将带来严重后果!华南理工大学期末考试《 信号与系统 》试卷B1. 考前请将密封线内各项信息填写清楚; 所有答案请直接答在试卷上(或答题纸上); .考试形式:闭卷;4. 本试卷共 五 大题,满分100分, 考试时间120分钟。
题 号 一 二 三四五总分得 分 评卷人一、 填空题(共20分,每小题 2 分)1、()⎪⎭⎫⎝⎛π+=3t 4cos 3t x 是否为周期信号 , 若是其基波周期T= 。
2、[]⎪⎭⎫⎝⎛π+=64n cos n x 是否为周期信号 , 若是基波周期 N= 。
3、信号()()()t 3sin t 2cos t x +π=的傅里叶变换()ωj X = 。
4、一离散LTI 系统的阶跃响应[][][]1n 2n n s -δ+δ=,该系统的单位脉冲响应[]=n h 。
5、一连续LTI 系统的输入()t x 与输出()t y 有如下关系:()()()ττ=⎰+∞∞-+τ--d x et y 2t ,该系统的单位冲激响应()=t h 。
6、一信号()()2u 34+=-t et x t,()ωj X 是该信号的傅里叶变换,求()=ωω⎰+∞∞-d j X 。
7、周期性方波x(t)如下图所示,它的二次谐波频率=2ω 。
8、设)e(X j ω是下图所示的离散序列x[n]傅立叶变换,则=⎰ωπωd )e (X 20j 。
9、已知一离散实偶周期序列x[n]的傅立叶级数a k 如图所示,求x[n]的周期N= 。
10、一因果信号[]n x ,其z 变换为()()()2z 1z 1z 5z 2z X 2++++=,求该信号的初值[]=0x 。
二、 判断题(判断下列各题,对的打√,错的打×)(共20分,每小题2分)1、已知一连续系统的频率响应为)5j(23e )H(j ωωω+-=,信号经过该系统不会产生相位失真。
( )2、已知一个系统的单位冲击响应为)2t (u e )t (h t+=-,则该系统是非因果系统。
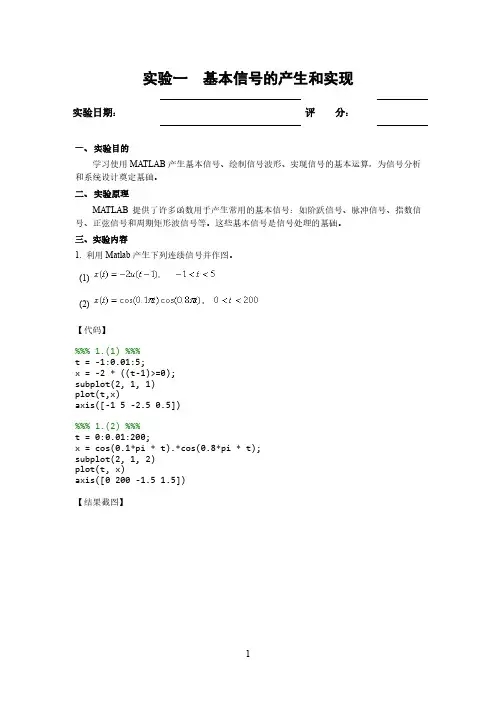
实验一基本信号的产生和实现实验日期:评分:一、实验目的学习使用MATLAB产生基本信号、绘制信号波形、实现信号的基本运算,为信号分析和系统设计奠定基础。
二、实验原理MATLAB提供了许多函数用于产生常用的基本信号:如阶跃信号、脉冲信号、指数信号、正弦信号和周期矩形波信号等。
这些基本信号是信号处理的基础。
三、实验内容1. 利用Matlab产生下列连续信号并作图。
(1)(2)【代码】%%% 1.(1) %%%t = -1:0.01:5;x = -2 * ((t-1)>=0);subplot(2, 1, 1)plot(t,x)axis([-1 5 -2.5 0.5])%%% 1.(2) %%%t = 0:0.01:200;x = cos(0.1*pi * t).*cos(0.8*pi * t);subplot(2, 1, 2)plot(t, x)axis([0 200 -1.5 1.5])【结果截图】【结果分析】上述代码绘制了阶跃函数的变形形式,以及类似正弦波的时域信号图。
2. 利用Matlab产生下列离散序列并作图。
(1),设。
(2),设。
【代码】%%% 2.(1) %%%k = -14:15;x = (-5<=k & k<=5);subplot(2, 1, 1)stem(k, x)axis([-14 15 -0.5 1.5])%%% 2.(2) %%%k = -19:20;x = (0.9.^k) .* (sin(0.25*pi * k) + cos(0.25*pi * k)); subplot(2, 1, 2)stem(k, x)【结果截图】【结果分析】上图绘制了离散信号的窗口函数以及振幅衰减的震荡信号。
3.已知序列,。
(1)计算离散序列的卷积和,并绘出其波形。
(2)计算离散序列的相关函数,并绘出其波形。
(3)序列相关与序列卷积有何关系?【代码】%%% 3.(1) %%%k = [-2 -1 0 1 2 3];x = [1 2 0 -1 3 2];h = [1 -1 1];y = conv(x, h);subplot(2, 1, 1)stem(-2:5, y)%%% 3.(2) %%%r = xcorr(x, y);subplot(2, 1, 2)stem(-5:9, r)【结果截图】【结果分析】(3)序列相关与序列卷积有何关系?答:序列相关(∑+∞-∞=+=k xy n k y k x n R ][][][)是刻画两个序列之间相似性的一种度量,两序列越近似,相关性越高,当两序列相等时,相关性达到最大值。
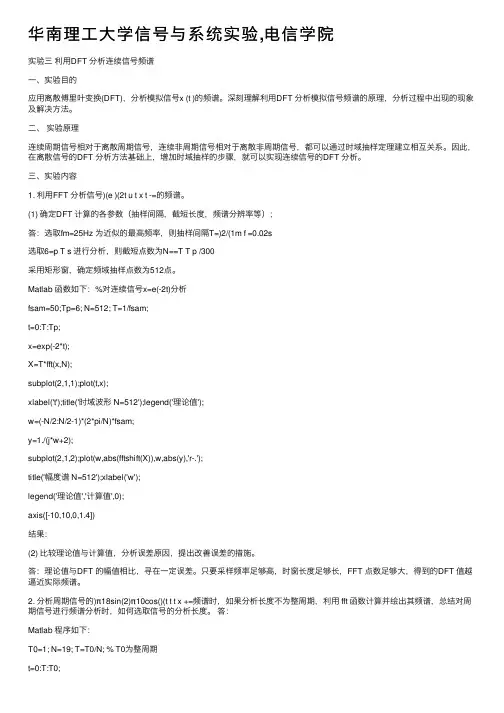
华南理⼯⼤学信号与系统实验,电信学院实验三利⽤DFT 分析连续信号频谱⼀、实验⽬的应⽤离散傅⾥叶变换(DFT),分析模拟信号x (t )的频谱。
深刻理解利⽤DFT 分析模拟信号频谱的原理,分析过程中出现的现象及解决⽅法。
⼆、实验原理连续周期信号相对于离散周期信号,连续⾮周期信号相对于离散⾮周期信号,都可以通过时域抽样定理建⽴相互关系。
因此,在离散信号的DFT 分析⽅法基础上,增加时域抽样的步骤,就可以实现连续信号的DFT 分析。
三、实验内容1. 利⽤FFT 分析信号)(e )(2t u t x t -=的频谱。
(1) 确定DFT 计算的各参数(抽样间隔,截短长度,频谱分辨率等);答:选取fm=25Hz 为近似的最⾼频率,则抽样间隔T=)2/(1m f =0.02s选取6=p T s 进⾏分析,则截短点数为N==T T p /300采⽤矩形窗,确定频域抽样点数为512点。
Matlab 函数如下:%对连续信号x=e(-2t)分析fsam=50;Tp=6; N=512; T=1/fsam;t=0:T:Tp;x=exp(-2*t);X=T*fft(x,N);subplot(2,1,1);plot(t,x);xlabel('t');title('时域波形 N=512');legend('理论值');w=(-N/2:N/2-1)*(2*pi/N)*fsam;y=1./(j*w+2);subplot(2,1,2);plot(w,abs(fftshift(X)),w,abs(y),'r-.');title('幅度谱 N=512');xlabel('w');legend('理论值','计算值',0);axis([-10,10,0,1.4])结果:(2) ⽐较理论值与计算值,分析误差原因,提出改善误差的措施。
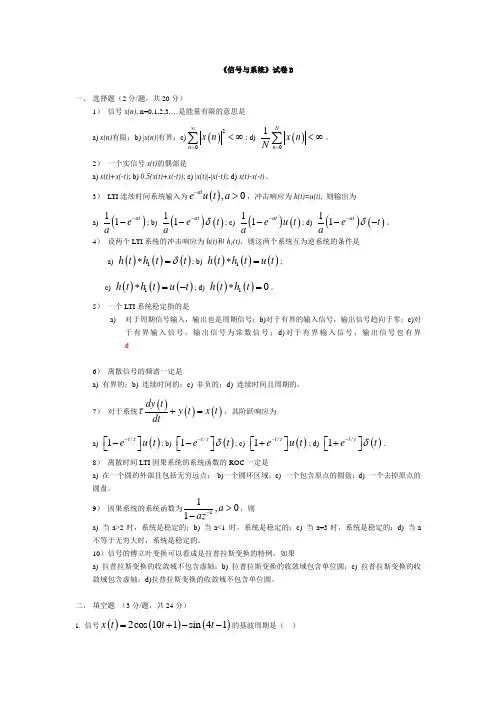
《信号与系统》试卷B一、 选择题(2分/题,共20分)1) 信号x(n), n=0,1,2,3,…是能量有限的意思是 a) x(n)有限;b) |x(n)|有界;c)()2n x n ∞=<∞∑; d)()01Nn x n N=<∞∑。
2) 一个实信号x(t)的偶部是a) x(t)+x(-t); b) 0.5(x(t)+x(-t)); c) |x(t)|-|x(-t)|; d) x(t)-x(-t)。
3) LTI 连续时间系统输入为(),0ate u t a ->,冲击响应为h(t)=u(t), 则输出为a)()11at e a --; b) ()()11at e t a δ--; c) ()()11at e u t a --; d) ()()11at e t aδ---。
4) 设两个LTI 系统的冲击响应为h(t)和h 1(t),则这两个系统互为逆系统的条件是 a) ()()()1h t h t t δ*=; b) ()()()1h t h t u t *=; c)()()()1h t h t u t *=-; d) ()()10h t h t *=。
5) 一个LTI 系统稳定指的是a) 对于周期信号输入,输出也是周期信号;b)对于有界的输入信号,输出信号趋向于零;c)对于有界输入信号,输出信号为常数信号;d)对于有界输入信号,输出信号也有界 d6) 离散信号的频谱一定是a) 有界的;b) 连续时间的;c) 非负的;d) 连续时间且周期的。
7) 对于系统()()()dy t y t x t dtτ+=,其阶跃响应为 a)()/1t e u t τ-⎡⎤-⎣⎦; b) ()/1t e t τδ-⎡⎤-⎣⎦; c) ()/1t e u t τ-⎡⎤+⎣⎦; d) ()/1t e t τδ-⎡⎤+⎣⎦. 8) 离散时间LTI 因果系统的系统函数的ROC 一定是a) 在一个圆的外部且包括无穷远点; b)一个圆环区域;c) 一个包含原点的圆盘;d) 一个去掉原点的圆盘。
信号与系统实验报告书题目:信号与系统实验一学院电子与信息学院专业班级电子科学与技术(卓越班)学生姓名陈艺荣学生学号************指导教师杨俊美课程编号课程学分起始日期2017.03.17-2017.03.12目录目录 (1)一、实验题目 (2)二、实验结果 (3)2.1问题1实验结果 (3)2.2问题2实验结果 (3)2.3问题3实验结果 (4)2.4问题4实验结果 (4)2.5问题5实验结果 (5)三、实验思考 (6)3.1思考题1 (6)3.2思考题2 (7)3.3思考题3 (7)3.4思考题4 (7)四、附录 (8)5.1问题1实现代码 (8)5.2问题2实现代码 (9)5.3问题3实现代码 (10)5.4问题4实现代码 (11)5.5问题5实现代码 (12)信号与系统实验一一、实验题目本次信号与系统实验题目见图1和图2所示。
图1实验一题目图1-1图2实验一题目图1-2二、实验结果2.1问题1实验结果使用subplot 函数和plot 函数编程,获得问题1的4个连续信号的图像如图3所示。
图3问题1实验结果图2.2问题2实验结果使用stem 函数和zeros 、ones 函数编程,获得问题2的2个离散信号如图4所示。
图4问题2实验结果图-112345t1y 1问题1第(1)小问图像51015202530t2y 2问题1第(2)小问图像-0.1-0.0500.050.1t3y 3问题1第(3)小问图像050100150200t4y 4问题1第(4)小问图像00.10.20.30.40.50.60.70.80.91k1y 1-20-1001020k2y 2问题2第(2)小问图像使用sum、abs、fprintf函数编程,获得问题3的求解结果如图5所示。
图5问题3实验结果图2.4问题4实验结果使用conv函数求解离散序列的卷积和、使用xcorr函数求解离散序列的相关函数编程,获得问题3的求解结果如图6所示。

诚信应考,考试作弊将带来严重后果!华南理工大学期末考试《 信号与系统 》试卷B 答案注意事项:1. 考前请将密封线内各项信息填写清楚; 2. 所有答案请直接答在试卷上(或答题纸上); 3.考试形式:闭卷;4. 本试卷共 五 大题,满分100分, 考试时间120分钟。
题 号 一 二 三四五总分得 分 评卷人一、 填空题(共20分,每小题 2 分)1、()⎪⎭⎫⎝⎛π+=3t 4cos 3t x 是 (选填:是或不是)周期信号, 若是,其基波周期T=2/π。
2、[]⎪⎭⎫⎝⎛+=64cos ππn n x 是 (选填:是或不是)周期信号,若是,基波周期 N= 8 。
3、信号()()()t 3sin t 2cos t x +π=的傅里叶变换()ωj X =3)](3)([j )]2()2([++--++-ωδωδππωδπωδπ。
4、一离散LTI 系统的阶跃响应[][][]12-+=n n n s δδ,该系统的单位脉冲响应[]=n h ]2n [2]1n []n [---+δδδ 。
5、一连续LTI 系统的输入()t x 与输出()t y 有如下关系:()()()ττ=⎰+∞∞-+τ--d x et y 2t ,该系统的单位冲激响应()=t h )2t (e +- 。
6、一信号()()2u 34+=-t et x t,()ωj X 是该信号的傅里叶变换,求()=ωω⎰+∞∞-d j Xπ6。
7、周期性方波x(t)如下图所示,它的二次谐波频率=2ωT4π 。
_____________ ________8、设)e (X j ω是下图所示的离散序列x[n]傅立叶变换,则=⎰ωπωd )e(X 20j π2 。
9、已知一离散实偶周期序列x[n]的傅立叶级数系数a k 如图所示,求x[n]的周期N=8 。
10、一因果信号[]n x ,其z 变换为()()()2z 1z 1z 5z 2z X 2++++=,求该信号的初值[]=0x2 。
Signal&System Works 五山禅院ID:W ORKORK11系统识别基本题ArrayN=n=x=y=title(title(H=Y./X;%频率响应h=ifft(H);%逆变换subplot(3,1,1);stem(n,h);title('h[n]');subplot(3,1,2);plot(k,abs(H));title('|H(e^j^w)|');subplot(3,1,3)plot(k,angle(H));title('angle of H(e^j^w)');解析法:ωj e −−21∴][)21(][n u n h n =title('|Y(e^j^w)|');xlabel('w');(2)比较卷积输出与理论输出H=Y./X;plot(w,abs(fftshift(H)));title('|H(e^j^w)|');h1=ifft(H);y1=conv(h1,x);subplot(2,1,1);stem(n,y);title('y');subplot(2,1,2);stem([0:length(y1)-1],y1);title('y1');y1=h1*x;发现失真相当严重,原因是x只截取了0:64的值,此时用fft计算出来的为X1(e^jw),与实际的X(e^jw)存在误差。
N=200时,发现误差有了相当大的改善,所以推测正确!(3)频率响应H=Y./X;plot(w,abs(fftshift(H)));title('|H(e^j^w)|');当X很小时,H=Y/X会产生尖峰,因此必须把尖峰平滑掉。
After smooth:简单平滑,只是将尖峰点置零H2=H;for i=1:64if(X(i)<0.01)H2(i)=0;endendplot(w,abs(fftshift(H2)));title('|H2(e^j^w)|');测试输出:h2=ifft(H2);y2=conv(h2,x);subplot(2,1,1);stem(n,y);title('y');y2=y2(1:64);%截取y2的一半subplot(2,1,2);stem([0:length(y2)-1],y2);title('y2');That’’s perfect!I love it. Oh!!That终极smooth:H2(1)=0.5721;Before:简单平滑,只是将尖峰点置零subplot(2,1,1)plot(w,abs(fftshift(H2)));title('|H2(e^j^w)|');subplot(2,1,2)plot(w,angle(fftshift(H2)));title('angle of H2(e^j^w)');After:终极平滑,把尖峰点置成与邻近点相同H2=H;for i=1:64if(X(i)<0.01)for j=i:64%将最近的不等0的wk赋给等于0的w0 if(X(j)>0.01)H2(i)=H(j);endendendendsubplot(2,1,1)plot(w,abs(fftshift(H2)));title('|H2(e^j^w)|');subplot(2,1,2)plot(w,angle(fftshift(H2)));title('angle of H2(e^j^w)');(4)测试平滑后的输出,与理论输出对比h2=ifft(H2);y2=conv(h2,x);subplot(2,1,1);stem(n,y);title('y');y2=y2(1:64);%截取y2的一半subplot(2,1,2);stem([0:length(y2)-1],y2);title('y2');由图可知,效果颇佳!WORK3Hilbert Transform(a)根据频率响应计算得出nn n h ππcos 1][−=所以,h[n]关于原点对称(c)时移(d)n =n1=n2=a =ha =ha =Ha =k =w =title(plot(w,Haangle);α(g)输入:)8sin(n π卷积:)(*)8sin(n h n απ理论输出:]8/)20cos[(π−−n n =0:128;n1=0:19;n2=21:128;a =20;ha =(1-cos(pi*(n1-a)))./pi./(n1-a);ha =[ha,0,(1-cos(pi*(n2-a)))./pi./(n2-a)];x =sin(n*pi/8);subplot(3,1,1);stem(n,x);title('sin(pi*n/8)')xh =conv(x,ha);xh =xh(1:128);%cutsubplot(3,1,2);stem(0:length(xh)-1,xh);title('x[n]*ha[n]')xr =-cos((n-20)*pi/8);subplot(3,1,3);stem(n,xr);title('Theoretical result:-cos((n-20)*pi/8)');(h)输入:卷积:截取20~148,即可得到:)(*)8sin(n h n π理论输出:8cos πn −n =0:128;n1=0:19;n2=21:128;a =20;ha =(1-cos(pi*(n1-a)))./pi./(n1-a);ha =[ha,0,(1-cos(pi*(n2-a)))./pi./(n2-a)];x =sin(n*pi/8);subplot(3,1,1);stem(n,x);title('sin(pi*n/8)')xh =conv(x,ha);xh =xh(21:148);%cut ,截取20-148subplot(3,1,2);stem(0:length(xh)-1,xh);title('x[n]*h[n]')xr =-cos(n*pi/8);%理论输出subplot(3,1,3);stem(n,xr);title('Theoretical result:-cos(n*pi/8)');WORK4SSB-Modulation输入:4/)32()4/)32(sin(][−−=n n n x ππ640≤≤n codeN =64;n =0:N-1;wc =pi/2;x =(sin(pi*(n-32)/4))./(pi*(n-32)/4);x(33)=1;%由洛必达法则得X =fft(x,256);subplot(3,2,1);stem(n,x);title('x');xlabel('n')subplot(3,2,3);w =2*pi*((0:(length(X)-1))-128)/256;%输出移至零频plot(w,abs(fftshift(X)));title('|X|');xlabel('w');x1=x.*cos(wc*n);%x1X1=fft(x1,256);subplot(3,2,2);w =2*pi*((0:(length(X1)-1))-128)/256;%输出移至零频plot(w,abs(fftshift(X1)));title('|X1|');xlabel('w');%hilbert funtiona =20;ha =(1-cos(pi*(n-a)))./pi./(n -a);ha(21)=0;%xh =conv(ha,x);xh =xh(21:84);XH =fft(xh,256);x2=xh.*sin(wc*n);X2=fft(x2,256);w =2*pi*((0:(length(X2)-1))-128)/256;%输出移至零频subplot(3,2,4);plot(w,abs(fftshift(X2)));title('|X2|');xlabel('w');y =x1+x2;Y =fft(y,256);w =2*pi*((0:(length(X2)-1))-128)/256;%输出移至零频subplot(3,2,6);plot(w,abs(fftshift(Y)));title('|Y|');xlabel('w');分析:由上图可看出,][1n x 的频谱是][n x 的频谱向左右搬移2π,同时幅度减小为一半。
类似的,][2n x 的频谱是][n x h 的频谱向左右搬移2π,同时幅度减小为一半。
最后,输出的SSB 信号Y 频谱带宽与原输入信号X 其实是一样的。
在低频段(9.0||≤ω)以及高频段(8.1||≥ω)SSB 的DTFT 基本为零。
Work5SSB-Demodulation解调:)cos(].[n n y c ω2πω=c 低通滤波器:归一化值,1=Axh =xh(21:84);XH =fft(xh,256);x2=xh.*sin(wc*n);%输出调制信号yy =x1+x2;Y =fft(y,256);subplot(3,1,1)w =2*pi*((0:(length(Y)-1))-128)/256;%输出移至零频plot(w,abs(fftshift(Y)));title('|Y|');xlabel('w');%**************************解调**************************** xd=cos(wc*n);%demodulation functionXd=fft(xd,256);w=2*pi*((0:(length(Xd)-1))-128)/256;%输出移至零频subplot(3,1,2);plot(w,abs(fftshift(Xd)));title('|Xd|');xlabel('w');%低通滤波器k=n-32;A=1;%Gainhlp=A*sin(wc*k)./(wc*k);hlp(33)=A;%由洛必达得Hlp=fft(hlp,256);ym=y.*xd;Ym=fft(ym,256);subplot(3,1,3);w=2*pi*((0:(length(Ym)-1))-128)/256;%输出移至零频plot(w,abs(fftshift(Ym)));title('|Ym|');xlabel('w');xr=conv(ym,hlp);%滤波figuresubplot(2,1,1);xr=xr(33:96);%cutstem(n,xr);title('x-recovery')subplot(2,1,2);stem(n,x);%源输入title('x-input')。