2013年美国数学建模A题论文 中文版
- 格式:docx
- 大小:80.24 KB
- 文档页数:9
介绍今年的焦点问题是如何实现质量和数量的平衡。
在质量方面,尽可能使热量均匀地分布。
目标是降低或避免矩形烤盘四个边角发生热量聚集的情况。
所以解决热量均匀分布这方面的问题,使用圆形烤盘是最佳的选择。
在数量方面,应该使烤盘充分的占据烤箱的空间。
所以我们的目的是使用尽可能多的烤盘来充分占据烤箱的空间,此时矩形烤盘是最佳选择。
对于这方面的问题的解决,就要考虑烤盘在烤箱水平截面上所占的比率。
在这个评论中,我们首先描述判断步骤,然后再讨论队伍对于三个问题的求解。
下一个话题就是论文的灵敏度和假设,紧随其后讨论确定一个给定方法的优势和劣势。
最后,我们简短的讨论一下参考和引用之间的区别。
过程第一轮的判别被称为“分流轮”。
这些初始轮的主要思想是确定论文应被给予更详细的考虑。
每篇论文应该至少阅读两次。
在阅读一篇论文的时候,评审的主要问题是论文是否包含所有必要的成分,使它成为一个候选人最详细的阅读。
在这些初始轮中,评审的时间是有限制的,所以我们要尽量让每一篇论文得到一个好的评判。
如果一篇论文解决了所有的问题,就会让评审觉得你的模型建立是合理的。
然后评审可能会认为你的论文是值得注意的。
有些论文在初轮评审中可能会得到不太理想的评论。
特别值得注意的是,一篇好的摘要应该要对问题进行简要概述,另外,论文的概述和方法,队员之间应该互相讨论,并且具体的结果应该在某种程度上被阐述或者表达出来。
在早期的几轮中,一些小细节能够有突出的表现,包括目录,它更便于评委看论文,同时在看论文的时候可能会有更高的期待。
问题求解也很重要。
最后,方法和结果要清晰简明的表达是至关重要的。
另外,在每个部分的开始,应该对那个部分进行一个概述。
在竞赛中,建模的过程是很重要的,同时也包括结论的表达。
如果结果没有确切和充分的表达,那么再好的模型和再大努力也是没有用的。
最后的回合最后一轮阅读的第一轮开始于评委会会议。
在这个会议中,评委将进行讨论,他们会分享他们各自认为的问题的关键方面。
2013 竞赛题目
MCM
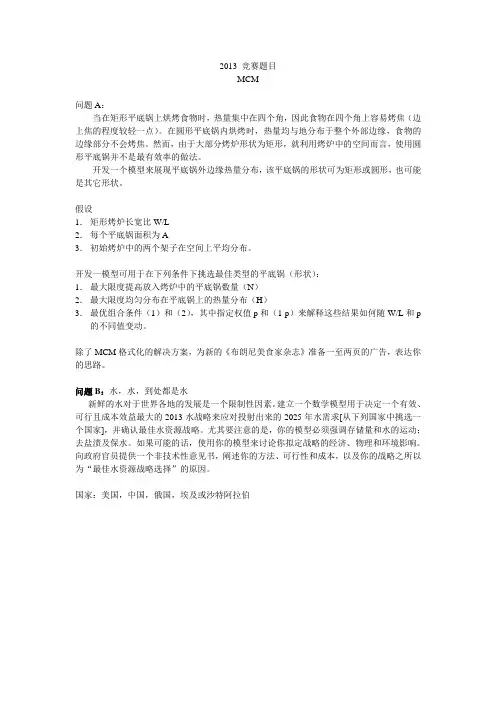
问题A:
当在矩形平底锅上烘烤食物时,热量集中在四个角,因此食物在四个角上容易烤焦(边上焦的程度较轻一点)。
在圆形平底锅内烘烤时,热量均与地分布于整个外部边缘,食物的边缘部分不会烤焦。
然而,由于大部分烤炉形状为矩形,就利用烤炉中的空间而言,使用圆形平底锅并不是最有效率的做法。
开发一个模型来展现平底锅外边缘热量分布,该平底锅的形状可为矩形或圆形,也可能是其它形状。
假设
1.矩形烤炉长宽比W/L
2.每个平底锅面积为A
3.初始烤炉中的两个架子在空间上平均分布。
开发一模型可用于在下列条件下挑选最佳类型的平底锅(形状):
1.最大限度提高放入烤炉中的平底锅数量(N)
2.最大限度均匀分布在平底锅上的热量分布(H)
3.最优组合条件(1)和(2),其中指定权值p和(1-p)来解释这些结果如何随W/L和p 的不同值变动。
除了MCM格式化的解决方案,为新的《布朗尼美食家杂志》准备一至两页的广告,表达你的思路。
问题B:水,水,到处都是水
新鲜的水对于世界各地的发展是一个限制性因素。
建立一个数学模型用于决定一个有效、可行且成本效益最大的2013水战略来应对投射出来的2025年水需求[从下列国家中挑选一个国家],并确认最佳水资源战略。
尤其要注意的是,你的模型必须强调存储量和水的运动;去盐渍及保水。
如果可能的话,使用你的模型来讨论你拟定战略的经济、物理和环境影响。
向政府官员提供一个非技术性意见书,阐述你的方法、可行性和成本,以及你的战略之所以为“最佳水资源战略选择”的原因。
国家:美国,中国,俄国,埃及或沙特阿拉伯。
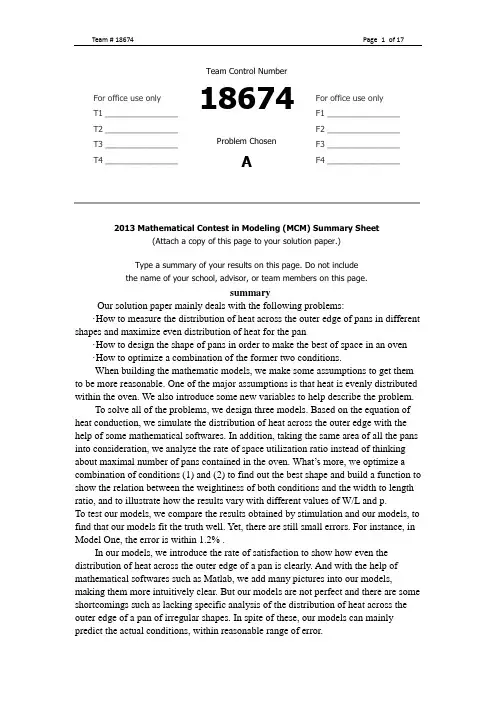
summaryOur solution paper mainly deals with the following problems:·How to measure the distribution of heat across the outer edge of pans in differentshapes and maximize even distribution of heat for the pan·How to design the shape of pans in order to make the best of space in an oven·How to optimize a combination of the former two conditions.When building the mathematic models, we make some assumptions to get themto be more reasonable. One of the major assumptions is that heat is evenly distributedwithin the oven. We also introduce some new variables to help describe the problem.To solve all of the problems, we design three models. Based on the equation ofheat conduction, we simulate the distribution of heat across the outer edge with thehelp of some mathematical softwares. In addition, taking the same area of all the pansinto consideration, we analyze the rate of space utilization ratio instead of thinkingabout maximal number of pans contained in the oven. What’s more, we optimize acombination of conditions (1) and (2) to find out the best shape and build a function toshow the relation between the weightiness of both conditions and the width to lengthratio, and to illustrate how the results vary with different values of W/L and p.To test our models, we compare the results obtained by stimulation and our models, tofind that our models fit the truth well. Yet, there are still small errors. For instance, inModel One, the error is within 1.2% .In our models, we introduce the rate of satisfaction to show how even thedistribution of heat across the outer edge of a pan is clearly. And with the help ofmathematical softwares such as Matlab, we add many pictures into our models,making them more intuitively clear. But our models are not perfect and there are someshortcomings such as lacking specific analysis of the distribution of heat across theouter edge of a pan of irregular shapes. In spite of these, our models can mainlypredict the actual conditions, within reasonable range of error.For office use onlyT1 ________________T2 ________________T3 ________________T4 ________________ Team Control Number18674 Problem Chosen AFor office use only F1 ________________ F2 ________________ F3 ________________ F4 ________________2013 Mathematical Contest in Modeling (MCM) Summary Sheet(Attach a copy of this page to your solution paper.)Type a summary of your results on this page. Do not includethe name of your school, advisor, or team members on this page.The Ultimate Brownie PanAbstractWe introduce three models in the paper in order to find out the best shape for the Brownie Pan, which is beneficial to both heat conduction and space utility.The major assumption is that heat is evenly distributed within the oven. On the basis of this, we introduce three models to solve the problem.The first model deals with heat distribution. After simulative experiments and data processing, we achieve the connection between the outer shape of pans and heat distribution.The second model is mainly on the maximal number of pans contained in an oven. During the course, we use utility rate of space to describe the number. Finally, we find out the functional relation.Having combined both of the conditions, we find an equation relation. Through mathematical operation, we attain the final conclusion.IntroductionHeat usage has always been one of the most challenging issues in modern world. Not only does it has physic significance, but also it can influence each bit of our daily life. Likewise,space utilization, beyond any doubt, also contains its own strategic importance. We build three mathematic models based on underlying theory of thermal conduction and tip thermal effects.The first model describes the process and consequence of heat conduction, thus representing the temperature distribution. Given the condition that regular polygons gets overcooked at the corners, we introduced the concept of tip thermal effects into our prediction scheme. Besides, simulation technique is applied to both models for error correction to predict the final heat distribution.Assumption• Heat is distributed evenly in the oven.Obviously, an oven has its normal operating temperature, which is gradually reached actually. We neglect the distinction of temperature in the oven and the heating process, only to focus on the heat distribution of pans on the basis of their construction.Furthermore, this assumption guarantees the equivalency of the two racks.• Thermal conductivity is temperature-invariant.Thermal conductivity is a physical quantity, symbolizing the capacity of materials. Always, the thermal conductivity of metal material usually varies with different temperatures, in spite of tiny change in value. Simply, we suppose the value to be a constant.• Heat flux of boundaries keeps steady.Heat flux is among the important indexes of heat dispersion. In this transference, we give it a constant value.• Heat conduction dom inates the variation of temperature, while the effects ofheat radiation and heat convection can be neglected.Actually, the course of heat conduction, heat radiation and heat convectiondecide the variation of temperature collectively. Due to the tiny influence of other twofactors, we pay closer attention to heat conduction.• The area of ovens is a constant.I ntroduction of mathematic modelsModel 1: Heat conduction• Introduction of physical quantities:q: heat fluxλ: Thermal conductivityρ: densityc: specific heat capacityt: temperature τ: timeV q : inner heat sourceW q : thermal fluxn: the number of edges of the original polygonsM t : maximum temperaturem t : minimum temperatureΔt: change quantity of temperatureL: side length of regular polygon• Analysis:Firstly, we start with The Fourier Law:2(/)q gradt W m λ=- . (1) According to The Fourier Law, along the direction of heat conduction, positionsof a larger cross-sectional area are lower in temperature. Therefore, corners of panshave higher temperatures.Secondly, let’s analyze the course of heat conduction quantitatively.To achieve this, we need to figure out exact temperatures of each point across theouter edge of a pan and the variation law.Based on the two-dimension differential equation of heat conduction:()()V t t t c q x x y yρλλτ∂∂∂∂∂=++∂∂∂∂∂. (2) Under the assumption that heat distribution is time-independent, we get0t τ∂=∂. (3)And then the heat conduction equation (with no inner heat source)comes to:20t ∇=. (4)under the Neumann boundary condition: |W s q t n λ∂-=∂. (5)Then we get the heat conduction status of regular polygons and circles as follows:Fig 1In consideration of the actual circumstances that temperature is higher at cornersthan on edges, we simulate the temperature distribution in an oven and get resultsabove. Apparently, there is always higher temperature at corners than on edges.Comparatively speaking, temperature is quite more evenly distributed around circles.This can prove the validity of our model rudimentarily.From the figure above, we can get extreme values along edges, which we callM t and m t . Here, we introduce a new physical quantity k , describing the unevennessof heat distribution. For all the figures are the same in area, we suppose the area to be1. Obviously, we have22sin 2sin L n n n ππ= (6) Then we figure out the following results.n t M t m t ∆ L ksquare 4 214.6 203.3 11.3 1.0000 11.30pentagon 5 202.1 195.7 6.4 0.7624 8.395hexagon 6 195.7 191.3 4.4 0.6204 7.092heptagon 7 193.1 190.1 3.0 0.5246 5.719octagon 8 191.1 188.9 2.2 0.4551 4.834nonagon 9 188.9 187.1 1.8 0.4022 4.475decagon 10 189.0 187.4 1.6 0.3605 4.438Table 1It ’s obvious that there is negative correlation between the value of k and thenumber of edges of the original polygons. Therefore, we can use k to describe theunevenness of temperature distribution along the outer edge of a pan. That is to say, thesmaller k is, the more homogeneous the temperature distribution is.• Usability testing:We use regular hendecagon to test the availability of the model.Based on the existing figures, we get a fitting function to analyze the trend of thevalue of k. Again, we introduce a parameter to measure the value of k.Simply, we assume203v k =, (7) so that100v ≤. (8)n k v square 4 11.30 75.33pentagon 5 8.39 55.96hexagon 6 7.09 47.28heptagon 7 5.72 38.12octagon 8 4.83 32.23nonagon9 4.47 29.84 decagon 10 4.44 29.59Table 2Then, we get the functional image with two independent variables v and n.Fig 2According to the functional image above, we get the fitting function0.4631289.024.46n v e -=+.(9) When it comes to hendecagons, n=11. Then, v=26.85.As shown in the figure below, the heat conduction is within our easy access.Fig 3So, we can figure out the following result.vnActually,2026.523tvL∆==.n ∆t L k vhendecagons 11 187.1 185.8 1.3 0.3268 3.978 26.52Table 3Easily , the relative error is 1.24%.So, our model is quite well.• ConclusionHeat distribution varies with the shape of pans. To put it succinctly, heat is more evenly distributed along more edges of a single pan. That is to say, pans with more number of peripheries or more smooth peripheries are beneficial to even distribution of heat. And the difference in temperature contributes to overcooking. Through calculation, the value of k decreases with the increase of edges. With the help of the value of k, we can have a precise prediction of heat contribution.Model 2: The maximum number• Introduction of physical quantities:n: the number of edges of the original polygonsα: utility rate of space• Analysis:Due to the fact that the area of ovens and pans are constant, we can use the area occupied by pans to describe the number of pans. Further, the utility rate of space can be used to describe the number. In the following analysis, we will make use of the utility rate of space to pick out the best shape of pans. We begin with the best permutation devise of regular polygon. Having calculated each utility rate of space, we get the variation tendency.• Model Design:W e begin with the scheme which makes the best of space. Based on this knowledge, we get the following inlay scheme.Fig 4Fig 5According to the schemes, we get each utility rate of space which is showed below.n=4 n=5 n=6 n=7 n=8 n=9 n=10 n=11 shape square pentagon hexagon heptagon octagon nonagon decagon hendecagon utility rate(%)100.00 85.41 100.00 84.22 82.84 80.11 84.25 86.21Table 4Using the ratio above, we get the variation tendency.Fig 6 nutility rate of space• I nstructions:·The interior angle degrees of triangles, squares, and regular hexagon can be divided by 360, so that they all can completely fill a plane. Here, we exclude them in the graph of function.·When n is no more than 9, there is obvious negative correlation between utility rate of space and the value of n. Otherwise, there is positive correlation.·The extremum value of utility rate of space is 90.69%,which is the value for circles.• Usability testing:We pick regular dodecagon for usability testing. Below is the inlay scheme.Fig 7The space utility for dodecagon is 89.88%, which is around the predicted value. So, we’ve got a rather ideal model.• Conclusion:n≥), the When the number of edges of the original polygons is more than 9(9 space utility is gradually increasing. Circles have the extreme value of the space utility. In other words, circles waste the least area. Besides, the rate of increase is in decrease. The situation of regular polygon with many sides tends to be that of circles. In a word, circles have the highest space utility.Model 3: Rounded rectangle• Introduction of physical quantities:A: the area of the rounded rectanglel: the length of the rounded rectangleα: space utilityβ: the width to length ratio• Analysis:Based on the combination of consideration on the highest space utility of quadrangle and the even heat distribution of circles, we invent a model using rounded rectangle device for pans. It can both optimize the cooking effect and minimize the waste of space.However, rounded rectangles are exactly not the same. Firstly, we give our rounded rectangle the same width to length ratio (W/L) as that of the oven, so that least area will be wasted. Secondly, the corner radius can not be neglected as well. It’ll give the distribution of heat across the outer edge a vital influence. In order to get the best pan in shape, we must balance how much the two of the conditions weigh in the scheme.• Model Design:To begin with, we investigate regular rounded rectangle.The area224r ar a A π++= (10) S imilarly , we suppose the value of A to be 1. Then we have a function between a and r :21(4)2a r r π=+--(11) Then, the space utility is()212a r α=+ (12) And, we obtain()2114rαπ=+- (13)N ext, we investigate the relation between k and r, referring to the method in the first model. Such are the simulative result.Fig 8Specific experimental results arer a ∆t L k 0.05 0.90 209.2 199.9 9.3 0.98 9.49 0.10 0.80 203.8 196.4 7.4 0.96 7.70 0.15 0.71 199.6 193.4 6.2 0.95 6.56 0.20 0.62 195.8 190.5 5.3 0.93 5.69 0.25 0.53 193.2 189.1 4.1 0.92 4.46Table 5According to the table above, we get the relation between k and r.Fig 9So, we get the function relation3.66511.190.1013r k e -=+. (14) After this, we continue with the connection between the width to length ratioW Lβ=and heat distribution. We get the following results.krFig 10From the condition of heat distribution, we get the relation between k and βFig 11And the function relation is4.248 2.463k β=+ (15)Now we have to combine the two patterns together:3.6654.248 2.463(11.190.1013)4.248 2.463r k e β-+=++ (16)Finally, we need to take the weightiness (p) into account,(,,)()(,)(1)f r p r p k r p βαβ=⋅+⋅- (17)To standard the assessment level, we take squares as criterion.()(,)(1)(,,)111.30r p k r p f r p αββ⋅⋅-=+ (18) Then, we get the final function3.6652(,,)(1)(0.37590.2180)(1.6670.0151)1(4)r p f r p p e rββπ-=+-⋅+⋅++- (19) So we get()()3.6652224(p 1)(2.259β 1.310)14r p f e r r ππ--∂=-+-+∂⎡⎤+-⎣⎦ (20) Let 0f r∂=∂,we can get the function (,)r p β. Easily,0r p∂<∂ and 0r β∂>∂ (21) So we can come to the conclusion that the value of r decreases with the increase of p. Similarly, the value of r increases with the increase of β.• Conclusion:Model 3 combines all of our former analysis, and gives the final result. According to the weightiness of either of the two conditions, we can confirm the final best shape for a pan.• References:[1] Xingming Qi. Matlab 7.0. Beijing: Posts & Telecom Press, 2009: 27-32[2] Jiancheng Chen, Xinsheng Pang. Statistical data analysis theory and method. Beijing: China's Forestry Press, 2006: 34-67[3] Zhengshen Fan. Mathematical modeling technology. Beijing: China Water Conservancy Press, 2003: 44-54Own It NowYahoo! Ladies and gentlemen, please just have a look at what a pan we have created-the Ultimate Brownie Pan.Can you imagine that just by means of this small invention, you can get away of annoying overcookedchocolate Brownie Cake? Pardon me, I don’t want to surprise you, but I must tell you , our potential customers, that we’ve made it! Believing that it’s nothing more than a common pan, some people may think that it’s not so difficult to create such a pan. To be honest, it’s not just a simple pan as usual, and it takes a lot of work. Now let me show you how great it is. Here we go!Believing that it’s nothing more than a common pan, some people may think that it’s not so difficult to create such a pan. To be honest, it’s not just a simple pan as usual, and it takes a lot of work. Now let me show you how great it is. Here we go!Maybe nobody will deny this: when baked in arectangular pan, cakes get easily overcooked at thecorners (and to a lesser extent at the edges).But neverwill this happen in a round pan. However, round pansare not the best in respects of saving finite space in anoven. How to solve this problem? This is the key pointthat our work focuses on.Up to now, as you know, there have been two factors determining the quality of apan -- the distribution of heat across the outer edge of and thespace occupied in an oven. Unfortunately, they cannot beachieved at the same time. Time calls for a perfect pan, andthen our Ultimate Brownie Pan comes into existence. TheUltimate Brownie Pan has an outstandingadvantage--optimizing a combination of the two conditions. As you can see, it’s so cute. And when you really begin to use it, you’ll find yourself really enjoy being with it. By using this kind of pan, you can use four pans in the meanwhile. That is to say you can bake more cakes at one time.So you can see that our Ultimate Brownie Pan will certainly be able to solve the two big problems disturbing so many people. And so it will! Feel good? So what are you waiting for? Own it now!。

美赛数学建模A题翻译版论文The document was finally revised on 2021数学建模竞赛(MCM / ICM)汇总表基于细胞的高速公路交通模型自动机和蒙特卡罗方法总结基于元胞自动机和蒙特卡罗方法,我们建立一个模型来讨论“靠右行”规则的影响。
首先,我们打破汽车的运动过程和建立相应的子模型car-generation的流入模型,对于匀速行驶车辆,我们建立一个跟随模型,和超车模型。
然后我们设计规则来模拟车辆的运动模型。
我们进一步讨论我们的模型规则适应靠右的情况和,不受限制的情况, 和交通情况由智能控制系统的情况。
我们也设计一个道路的危险指数评价公式。
我们模拟双车道高速公路上交通(每个方向两个车道,一共四条车道),高速公路双向三车道(总共6车道)。
通过计算机和分析数据。
我们记录的平均速度,超车取代率、道路密度和危险指数和通过与不受规则限制的比较评估靠右行的性能。
我们利用不同的速度限制分析模型的敏感性和看到不同的限速的影响。
左手交通也进行了讨论。
根据我们的分析,我们提出一个新规则结合两个现有的规则(靠右的规则和无限制的规则)的智能系统来实现更好的的性能。
1介绍术语假设2模型设计的元胞自动机流入模型跟随模型超车模型超车概率超车条件危险指数两套规则CA模型靠右行无限制行驶规则3补充分析模型加速和减速概率分布的设计设计来避免碰撞4模型实现与计算机5数据分析和模型验证平均速度快车的平均速度密度超车几率危险指数6在不同速度限制下敏感性评价模型7驾驶在左边8交通智能系统智能系统的新规则模型的适应度智能系统结果9结论10优点和缺点优势弱点引用附录。
1 Introduction今天,大约65%的世界人口生活在右手交通的国家和35%在左手交通的国家交通流量。
[worldstandards。
欧盟,2013] 右手交通的国家,比如美国和中国,法规要求驾驶在靠路的右边行走。
多车道高速公路在这些国家经常使用一个规则,要求司机在最右边开车除非他们超过另一辆车,在这种情况下,他们移动到左边的车道、通过,返回到原来的车道。
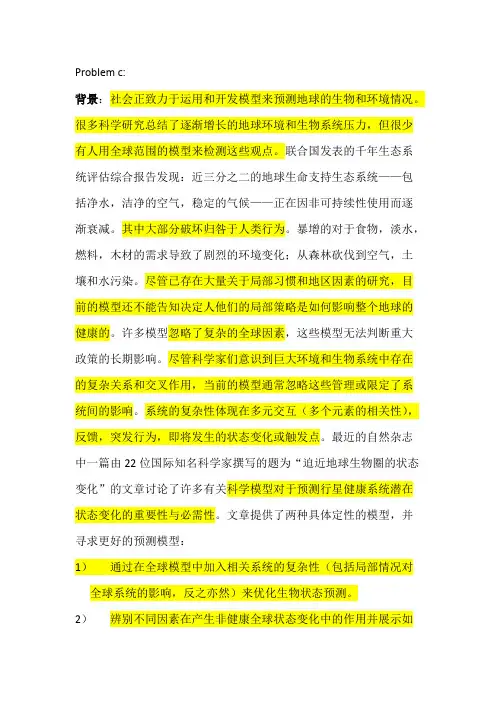
Problem c:背景:社会正致力于运用和开发模型来预测地球的生物和环境情况。
很多科学研究总结了逐渐增长的地球环境和生物系统压力,但很少有人用全球范围的模型来检测这些观点。
联合国发表的千年生态系统评估综合报告发现:近三分之二的地球生命支持生态系统——包括净水,洁净的空气,稳定的气候——正在因非可持续性使用而逐渐衰减。
其中大部分破坏归咎于人类行为。
暴增的对于食物,淡水,燃料,木材的需求导致了剧烈的环境变化;从森林砍伐到空气,土壤和水污染。
尽管已存在大量关于局部习惯和地区因素的研究,目前的模型还不能告知决定人他们的局部策略是如何影响整个地球的健康的。
许多模型忽略了复杂的全球因素,这些模型无法判断重大政策的长期影响。
尽管科学家们意识到巨大环境和生物系统中存在的复杂关系和交叉作用,当前的模型通常忽略这些管理或限定了系统间的影响。
系统的复杂性体现在多元交互(多个元素的相关性),反馈,突发行为,即将发生的状态变化或触发点。
最近的自然杂志中一篇由22位国际知名科学家撰写的题为“迫近地球生物圈的状态变化”的文章讨论了许多有关科学模型对于预测行星健康系统潜在状态变化的重要性与必需性。
文章提供了两种具体定性的模型,并寻求更好的预测模型:1)通过在全球模型中加入相关系统的复杂性(包括局部情况对全球系统的影响,反之亦然)来优化生物状态预测。
2)辨别不同因素在产生非健康全球状态变化中的作用并展示如何运用有效的生态系统管理来预防或限制这些即将发生的状态变化。
研究最终归结于问题:我们是否能利用全球健康的局部或地区性组成部分预测潜在状态变化来帮助决策者制定基于对全球健康状况潜在影响的,有效的策略。
尽管有越来越多的警示信号出现,没人知道地球是否确实在接近全球性的转折点(极端状态),这种极端的状态是否是不可避免的。
自然杂志等研究指出了地球生态系统中的一些重要工作元素。
(例如:局部因素,全球变化,多维元素与关系,变化的时间与空间范围)。
终极布朗尼烤烤盘一、摘要根据题意,我们把把要解决的分成三个问题;第一个就是建立一个模型来表示整个烤盘的外边缘热量的分布。
第二个就是优化组合题目中条件1和条件2,使得权重p和(1- p)能够描述随着W/L和p值的改变,最佳的烤烤盘形状和热量分布情况是如何改变的第三个问题就是为布朗尼美食家杂志准备一到两页的宣传广告,需要突出设计和结果。
对于第一个问题,我们结合傅里叶定律构建了二维热传导模型;然后通过模型中的S来限定范围得到六种不同形状烤盘对应的热传导偏微分方程。
然后对模型赋值和第二类边界条件(Neumann边界条件)下,应用comsol得出六种烤盘稳定热量分布图像和烤盘外边缘热量分布图像。
通过输出的图像,我们得出结论:矩形四角处温度较高,圆形外边缘热量分布比较均匀;随着烤盘边数的增加,烤盘外边缘热量分布愈加均匀,但在角处温度仍然会高一些对于问题二对于问题三关键词:二、问题重述当用一个长方形的平底烤盘(盘)烘烤时,热量被集中在4个角,在角落处,食物可能被烤焦了,而边缘处烤的不够熟。
在一个圆形的平底烤盘(盘)热量被均匀地分布在整个外边缘,在边缘处食物不会被烤焦。
但是,大多数的烤箱的形状是矩形的,采用了圆形的烤盘(盘)相对于烤箱的使用空间而言效率不高。
为所有形状的烤盘(盘)----包括从矩形到圆形以及中间的形状,建立一个模型来表示整个烤盘(盘)的外边缘热量的分布。
假设:1. 形状是矩形的烤箱宽长比为W/L;2. 每个烤烤盘(盘)的面积为A;3. 每个烤箱最初只有两个均匀放置的烤架。
根据以下条件,建立一个能使用的最佳类型或形状的烤烤盘(盘):1.放入烤箱里的烤烤盘(盘)数量的最大值为(N);2.烤烤盘(盘)的平均分布热量最大值为(H);3.优化组合条件1和条件2,使得权重p和(1- p)能够描述随着W/L和p值的改变,最佳的烤烤盘形状和热量分布情况是如何改变的。
除了完成规定的解决方案,为布朗尼美食家杂志准备一到两页的宣传广告,需要突出你的设计和结果。
中国水资源战略摘要Summary为了确定中国最佳的水资源战略,将中国分为九大流域,首先借助MATLAB建立多项式拟合模型来预测出中国2013年到2025年每年各流域的供水量和需水量,接着在可持续发展的原则指导下建立区域水资源合理配置模型,对每一个流域,采用水资源综合短缺度最小为目标函数, 对地表水、地下水等多种水源统筹考虑, 用权重区别对待工业、农业、生活、生态环境等不同领域的用水需求, ,从而求出各个流域最小的缺水量。
再根据前面的两个模型所预测出来的各流域的缺水量,建立最佳的补水模型解决缺水问题:通过对实际问题的分析,可能的补水方案有两个:方案一是直接从珠江流域调水到缺水的流域,方案二是沿海流域采取海水淡化补水,内陆流域采取直接从珠江流域调水过去,经过分析、计算发现方案二是最佳的。
最后,我们统筹考虑我们所制定的水策略,发现其无论是对经济、社会还是生态环境都将产生重大影响。
In order to determine the best water resources strategy, we divided China into nine basins. Firstly, we established polynomial fitting model with the use of MATLAB to predict the water supply and the water demand of every basin from 2013 to 2025. Secondly, we established the regional water resources rational allocation model under the guidance of the principle of sustainable development. In this model, through taking the minimum comprehensive water shortage degree as objective , surface water , groundwater and other water are considered, and different weightings are used for industrial, agricultural, domestic and ecological water users in order to realize regional water resources rational allocation .In this way can we obtained the minimum amount of water scarcity in every basin. Thirdly, according to the data predicted based on the previous two models, we can establish the optimal replenishment model to solve the problem of water shortage. We identified two possible replenishment program based on the analysis of the actual problems. One is to transfer the water of the Pearl River to basins where lack of water resources, another is to transfer the water of the Pearl River to inland basins directly while we meet the water shortage of coastal basins by desalination. After analysis and calculation, we find second program is the best. Finally, we find the water strategy we developed has a significant impact on the economic, social and ecological environment after we considered the models we established.关键字:水策略多项式拟合模型区域水资源合理配置模型补水模型Keywords:Water strategythe Polynomial fitting modelThe Regional water resources rational allocation modelthe Replenishment model§1.问题重述Problem restatement水是生命之源, 是人类生存和发展不可替代的资源, 是经济、社会可持续发展的基础。
2013 Contest Problems
MCM PROBLEMS
今天美赛成绩也出来了,想起去年年前在学校准备竞赛的苦日子,心里也算有了一丝丝的安慰。
这是去年竞赛时候学校请的两位美女外援英语老师帮忙做的题目翻译。
贡献出来了,呵呵,不能埋没了她们的才华。
——francis_hao
A题:
用矩形的烤盘烤东西,盘子四角加热不均,容
用圆形盘子烤东西,热量分配均匀,食物的边缘不容易被烤焦。
但是,大多数的烤箱都是矩形的,使用圆形的盘子没有将烤箱的空间充分的利用
建模型:分别说明矩形、圆形和其他介于两者之间形状的盘子在热量分布上的区别
假设:
1.烤箱的长宽比是W/L
2.盘子的面积是A
3.烤箱中的两个架子是平均分布的。
建模型:按照以下条件,选择最优形状
1、在满足烤箱大小的限度下使盘子数量N最大化
2、使盘子均匀受热最大化
3、将1和2结合,说明W/L以及p的变化对结果有什么影响
B题
淡水资源对于世界上大多国家都是限制性的资源。
建一个数学模型确定2013年一个有效、可行、成本低的水利战略,满足2025年的水需求,并制定最好的水利战略(国家如下表)。
数学模型必须能存储、运输、去盐碱化和利于保存。
如果可能,你的模型会讨论水利战略关于经济、物理上以及对环境的后果。
给政府领导提供一个非技术性论文概括你的方法,包括可行性、花销以及此方法是最优水利战略的原因。
国家:美国、中国、俄罗斯、埃及、沙特阿拉伯。
SummaryWe build two basic models for the two problems respectively: one is to show the distribution of heat across the outer edge of the pan for different shapes, rectangular, circular and the transition shape; another is to select the best shape for the pan under the condition of the optimization of combinations of maximal number of pans in the oven and the maximal even heat distribution of the heat for the pan.We first use finite-difference method to analyze the heat conduct and radiation problem and derive the heat distribution of the rectangular and the circular. In terms of our isothermal curve of the rectangular pan, we analyze the heat distribution of rounded rectangle thoroughly, using finite-element method. We then use nonlinear integer programming method to solve the maximal number of pans in the oven. In the even heat distribution, we define a function to show the degree of the even heat distribution. We use polynomial fitting with multiple variables to solve the objective function For the last problem, combining the results above, we analyze how results vary with the different values of width to length ratio W/L and the weight factor p. At last, we validate that our method is correct and robust by comparing and analyzing its sensitivity and strengths /weaknesses.Based on the work above, we ultimately put forward that the rounded rectangular shape is perfect considering optimal number of the pans and even heat distribution. And an advertisement is presented for the Brownie Gourmet Magazine.Contents1 Introduction (3)1.1Brownie pan (3)1.2Background (3)1.3Problem Description (3)2. Model for heat distribution (3)2.1 Problem analysis (3)2.2 Assumptions (4)2.3 Definitions (4)2.4 The model (4)3 Results of heat distribution (7)3.1 Basic results (7)3.2 Analysis (9)3.3 Analysis of the transition shape—rounded rectangular (9)4 Model to select the best shape (11)4.1 Assumptions (11)4.2 Definitions (11)4.3 The model (12)5 Comparision and Degree of fitting (19)6 Sensitivity (20)7 Strengths/weaknesses (21)8 Conclusions (21)9 Advertisement for new Brownie Magazine (23)10 References (24)1 Introduction1.1Brownie panThe Brownie Pan is used to make Brownies which are a kind of popular cakes in America. It usually has many lattices in it and is made of metal or other materials to conduct heat well. It is trivially 9×9 inch or 9×13 inch in size. One example of the concrete shape of Brownie pan is shown in Figure 1Figure 1 the shape of Brownie Pan (source: Google Image)1.2BackgroundBrownies are delicious but the Brownie Pan has a fetal drawback. When baking in a rectangular pan, the food can easily get overcooked in the 4 corners, which is very annoying for the greedy gourmets. In a round pan, the heat is evenly distributed over the entire outer edge but is not efficient with respect to using in the space in an oven, which most cake bakers would not like to see. So our goal is to address this problem.1.3Problem DescriptionFirstly, we are asked to develop a model to show the distribution of heat across the outer edge of a pan for different shapes, from rectangular to circular including the transition shapes; then we will build another model to select the best shape of the pan following the condition of the optimization of combinations of maximal number of pans in the oven and maximal even distribution of heat for the pan.2. Model for heat distribution2.1 Problem analysisHere we use a finite difference model to illustrate the distribution of heat, and it has been extensively used in modeling for its characteristic ability to handle irregular geometries and boundary conditions, spatial and temporal properties variations1. In literature 1, samples with a rectangular geometric form are difficult to heat uniformly,particularly at the corners and edges. They think microwave radiation in the oven can be crudely thought of as impinging on the sample from all, which we generally acknowledge. But they emphasize the rotation.Generally, when baking in the oven, the cakes absorb heat by three ways: thermal radiation of the pipes in the oven, heat conduction of the pan, and air convection in the oven. Considering that the influence of convection is small, we assume it negligible. So we only take thermal radiation and conduction into account. The heat is transferred from the outside to the inside while water in the cake is on the contrary. The temperature outside increase more rapidly than that inside. And the contact area between the pan and the outside cake is larger than that between the pan and the inside cakes, which illustrate why cakes in the corner get overcooked easily.2.2 Assumptions● We take the pan and cakes as black body, so the absorption of heat in eacharea unit and time unit is the same, which drastically simplifies ourcalculation.● We assume the air convection negligible, considering its complexity and thesmall influence on the temperature increase .● We neglect the evaporation of water inside the cake, which may impede theincrease of temperature of cakes.● We ignore the thickness of cakes and the pan, so the model we build istwo-dimensional.2.3 DefinitionsΦ: heat flows into the nodeQ: the heat taken in by cakes or pans from the heat pipesc E ∆: energy increase of each cake unitp E ∆: energy increase of the pan unit,i m n t : temperature at moment i and point (m,n)C 1: the specific heat capacity of the cakeC 2: the specific heat capacity of the panipan t : temperature of the pan at moment iT 1: temperature in the oven, which we assume is a constant2.4 The modelHere we use finite-difference method to derive the relationship of temperatures at time i-1 and time i at different place and the relationship of temperatures between the pan and the cake.First we divide a cake into small units, which can be expressed by a metric. In the following section, we will discuss the cake unit in different places of the pan.Step 1;temperatures of cakes interior(m,n+1)x△Figure 2 heat flow According to energy conversation principle, we can get 0up down left right c Q E Φ+Φ+Φ+Φ+-∆=(2.4.1) Considering Fourier Law and △x=△y, we get1,,1,,1,,1,,,1,,1,,1,,1,()()()()i i m n m n i i left m n m n i i m n m n i i right m n m n i i m n m n i i up m n m n i i m n m ni i down m n m n t t y t t xt t y t t x t t x t t y t t x t t y λλλλλλλλ--++++---Φ=-∆=-∆-Φ=∆=-∆-Φ=∆=-∆-Φ=∆=-∆ (2.4.2)According to Stefan-Boltzman Law,441,[()]i m n Q Ac T t σ=- (2.4.3)Where A is the area contacting, c is the heat conductance.σis the Stefan-Boltzmann constant, and equals 5.73×10⁸ Jm -2s -1k -4.21,,()i i c m n m n E cm t t -∆=-(2.4.4) Substituting (2.4.2)-(2.4.4) into (2.4.1), we get441,1,,1,1,1,1,,4[()]()0i i i i i i m n m n m n m n m n m n i i m n m n Ac t t t t t T t cm t t σλλ-++--+++-+---=This equation demonstrates the relationship of temperature at moment i and moment i-1 as well as the relationship of temperature at (m,n) and its surrounding points.Step 2: temperature of the cake outer and the pan● For the 4 cornerscakeFigure 3 the relative position of the cake and the pan in the first cornerBecause the contacting area is two times, we get4411,1,122[()]2()i i i i m n pan pan A c T t t c M t t σλ---=-● For every edgecakeFigure 4 the relative position of the cake and the pan at the edgeSimilarly, we derive4411,,2[()]()i i i i m n m n pan pan Ac T t t c M t t σλ---=-Now that we have derived the express of temperatures of cakes both temporally and spatially, we can use iteration to get the curve of temperature with the variables, time and location.3 Results of heat distribution3.1 Basic resultsRectangularPreliminarily, we focus on one corner only. After running the programme, we obtain the following figure.Figure 5 heat distribution at one cornerFigure 5 demonstrates the temperature at the corner is higher than its surrounding points, that’s why food at corners get overcooked easily.Then we iterate globally, and get Figure 6.Figure 6 heat distribution in the rectangular panFigure 6 can intuitively illustrates the temperature at corners is the highest, and temperature on the edge is less higher than that at corners, but is much higher than that at interior points, which successfully explains the problem “products get overcooked at the corners but to a lesser extent on the edge”.After drawing the heat distribution in two dimensions, we sample some points from the inside to the outside in a rectangular and obtain the relationship between temperature and iteration times, which is shown in Figure 7Figure 7From Figure 7, the temperatures go up with time going and then keep nearly parallel to the x-axis. On the other hand, temperature at the center ascends the slowest, then edge and corner, which means given cooking time, food at the center of the pan is cooked just well while food at the corner of the pan has already get overcooked, but a lesser extent to the edge.RoundWe use our model to analyze the heat distribution in a round, just adapting the rectangular units into small annuluses, by running our programme, we get the following figure.Figure 8 the heat distribution in the circle panFigure 8 shows heat distribution in circle area is even, the products at the edge are cooked to the same extent approximately.3.2 AnalysisFinally, we draw the isothermal curve of the pan.●RectangularFigure 9 the isothermal curve of the rectangular panFigure 9 demenstrates the isothermal lines are almost concentric circles in the center of the pan and become rounded rectangles outer, which provides theory support for following analysis..●CircularFigure 10 the isothermal curve of circularThe isothermal curves of the circular are series of concentric circles, demonstrating that the heat is even distributed.3.3 Analysis of the transition shape—rounded rectangularFrom the above analysis, we find that the isothermal curve are nearly rounded rectangulars in the rectangular pan, so we perspective the transition shape between rectangular and circular is rounded rectangular, considering the efficiency of using space of the oven and the even heat distribution. In the following section, we will analyze the heat distribution in rounded rectangular pan using finite element approach.During the cooking process, the temperature goes up gradually. But at a certain moment, the temperature can be assumed a constant. So the boundary condition yields Dirichlet boundary condition. And the differential equation is:22220T T x y∂∂+=∂∂ Where T is the temperature, and x, y is the abscissa and the ordinate.And the boundary condition is T=constant.After running the programme, we get the heat distribution in a rounded rectangular pan, the results is in the following.Figure 11 the heat distribution in a rounded rectangular pan From 11, we can see the temperature of the edge and the corner is almost the same, so the food won ’t get overcooked at corners. We can assume the heat in a rounded rectangular is distributed uniformly. We then draw the isothermal curve of the rounded rectangular pan.Figure 12 the isothermal curve of the rounded rectangular pan To show the heat distribution more intuitively, we also draw the vertical view of the heat distribution in a rounded rectangular pan.Figure 13 the vertical view of the heat distribution on a rounded rectangular platform4 Model to select the best shape4.1 AssumptionsBesides the assumptions given, we also make several other necessary assumptions.●The area of the even equals the area of the pan with small lattices in it.●There is no space between lattices or small pans on the pan.4.2 DefinitionsS: the area of the ovenk : the width of the external rectangular of the rounded rectangularh :the length of the external rectangular of the rounded rectangulara1: the ratio of the width and length of the external rectangular of the rounded rectangular, equals k/ha2: the ratio of the width and length of the external rectangular of the rounded rectangular, equals W/Ln: the amounts of the rounded rectangular in each rowm: the amounts of the rounded rectangular in each columnr: the radius of the rounded rectangularIn order to illustrate more clearly, we draw the following sketch.Figure 144.3 The modelProblem ⅠWe use nonlinear integer programming to solve the problem.Figure 15 the configuration of the rounded rectangular and the pan:max objective function N n m =⋅222:,004subject to n k m h k h A r r A r r Sππ⋅≤⋅≤==≥≥≤-+≤Where n, m are integers.Both a1 and a2 are variables, we can study the relationship of a1 and N at a given a2. Here we set a2=0.8.Considering the area of the oven S and the area of the small pan A are unknown, we collect some data online, which is shown in the following table.Table 1(source: / )Then we calculate the average of S and A , respectively 169.27 inch 2 and 16.25 inch 2. After running the programme, we get the following results.Figure 16 the relationship of the maximal N and the radius of the rounded rectangular r From the above figure, we know as r increases, the optimal number of pans decreases. For the data collected can not represent the whole features, the relationship is not obvious .Then we change the area of the oven and the area of each pan, we draw another figure.Figure 17This figure intuitively shows the relationship of r and N.Appearently, the ratio of the width to length of the rounded rectangular has a big influence on the optimization of N. In the following section, we will study this aspect.Figure 18 the relationship of N and a1 Figure 18 illustrates only when the ratio of the width to the length of the rounded rectangular a1 equals the ratio of the width and length of the oven a2, can N be optimized.Finally, we take both a1 and a2 as variables and study the relationship of N and a1, a2. The result is as follows.Figure 19 the relationship of N and a1, a2 Problem ⅡTo solve this problem, we first define a function u(r) to show the degree of the even heat distribution for different shapes. ()s u r AWhere s is the area surrounded by the closed isothermal curve most external of the pan.Now we think the rationality of the function. The temperature of the same isothermal curve is equivalent. We assume the temperature of the closed isothermal curve most external of the pan is t 0 , for the unclosed isothermal, the temperature is higher than t 0, and the temperature inside is lower than t 0. So we count the number of the pixel points inside the closed isothermal curve most external of the pan num 1 and the number of the whole pixel points num 2. Consequently, u(r)=num 1/num 2. To illustrate more clearly, we draw the following figure.The following table shows the relationship of u and r. And we set a=1Figure 21 the scatter diagram of u and rFirst, we consider u and r is linear, and by data fitting we deriveu r r=+⨯()0.85110.021Then, we consider u and r is second -order relationship, and we derive anothercurve.Figure 22 another relationship of u and r2 =+⨯-⨯u r r r()0.85110.02880.001According to the points we count, we can get the following figure, demonstrating the relationship u and r, a.Figure 23 the relationship of u and r, We aFrom the analysis above, we find with r increasing, u increases, which means when the radius of the rounded rectangular r increases, the degree of the even heat distribution. Given one extreme circumstance, when r gets its maximal value, the pan becomes a circular, and the degree of the even heat distribution is also the most.Finally, we can derive that the degree of the even heat distribution increases from the rectangular, rounded rectangular with smaller r, the rounded rectangular with bigger r and the circular.Figure 24 the comparision of degree of even heat distribution for different shapes Problem ⅢIn this section, we add a weight factor p to analyze the results with the varying values of W/L and p.:max (1)(,)objective function pN p u r a +-222:,004subject to n k m h k h A r r A r r Sππ⋅≤⋅≤==≥≥≤-+≤01p ≤≤In this problem, there are three variables , a, r and p .what we need to do is to select the best shape for the pan, namely, to select a and r. Firstly, we set a and get the relationship of objective function, y and r, p.Figure 25 the relationship of y and r, p From the figure, we can see with p decreasing and r increasing, which means the degree of the even heat distribution is larger, y increases.Then we set p, and get the relationship of the y and r, a.Figure 26 the relationship of y and a, rThis figure shows that the value a has little influence on the objective function.5 Comparision and Degree of fittingComparisionWhen solving the problem to select the best shape of the pan, we only take the rounded rectangular into account and ignore other shapes, Here, we concentrate on one of the polygon—the regular hexagon as an example to demonstrate our model is correct and retional.We use finite element method to derive the heat distribution, just like analyzing the rounded rectangular.Figure 27 the heat distribution of the regular hexagon panFigure 28 the heat distribution of the regular hexagon pan in two dimensions From the above two pictures, we can see the temperature of the corners is much higher than that in other sections of the pan. So the food at corners gets overcooked more easily. In fact, the longer the distance from the center to the corner is , the higher the temperature becomes.● Degree of fittingIn the second problem of selecting the best shapes of the pan, we get two equations of u and r by data fitting. Now, we will analyze the degree of fitting, which is expressed by the residual errors.To calculate the residual errors, we use the following equations.1ˆ()ˆˆT T Y X X X X Y YX βεββ-=+== Finally, we can get the residual errors by2ˆ()L i i iS y y=-∑ Where i is the number of the data sampled, here i is 11.S 1=5.021 and S 2=0.018. Obviously, the second equation is more accuracy.6 Sensitivity● From figure 16 and 17, we know that the larger the ratio of the area of theoven and the area of the pan is, the better our model fits.● We differentiate the equation derived by figure 22,and find that with rincreasing, the value of the differential goes down, which means u will become steady as r increases.● We analyze figure 23, and find the higher the value of r is, the moreobvious the influence a has on u.●We draw another figure as follows in comparision with figure 25, and getwhen the area of the oven S is very small, the relationship of y and r, p andbe seen more apparently.Figure 29 the relationship of y and r, p7 Strengths/weaknessesStrengths:●We use different methods, infinite difference and infinite element, to buildthe model, and the conclusions are consistent with each other.●We compare the heat distribution of the rounded rectangular and the regularhexagon and then calculate the residual errors, validating our model iscorrect.●The results generated by our model agree with empirical results.●Our model is straight, common and easy to understand.Weaknesses:●We didn’t give an analytic solution for the optimal number of the pans in theoven, N.●The model doesn’t take into account detailed things, like the air convectionin the oven.8 ConclusionsWe propose several models to solve the problem of the heat distribution and the optimization of the pan’s shape combining the maximal number of pans in the ovenand the maximal even heat distribution. After detailed analysis, we can get the following conclusions:●Rectangular can best fit in the oven considering the best efficiency of usingspace in an oven.●To get the maximal number of the pans in an oven, we should set the ratio ofthe width to the length of the oven equals that of the small pans.●Generally, the heat distribution of the circular is the most even. But when itcomes to the combination of the efficiency of the using space and the evenheat distribution, the rounded rectangular fits well. And with the radiusincreasing, the degree of even heat distribution increases, resulting in lesserefficiency of using space.9 Advertisement for new Brownie MagazineLove Brownies? Of course, follow us to see our new-designed ultimate Brownie Pan!Almost every Brownie gourmet may encounter the same problems when baking Brownies, cakes or other gourmets. And the most annoying thing may lie in the uneven cooked gourmets. For the heat is distributed uneven in the present pans, after baked, the cakes often can’t be get out of the pan easily or the edge is always difficult to cut because it is too filmsy. What’s worse, the overcooked food taste bad and become unhealthy containing bad things. But now, things are different. All of these trouble problems will disappear for we have ultimate pans. After careful calculation and analysis, we designed a new Brownie Pan—the rounded rectangular shape pan. We study the heat distribution thoroughly of different shapes of pans and find that, the rounded rectangular shape is almost perfect in terms of even heat distribution. The cakes at the corner of the pan will never be overcooked as long as you set the temperature appropriately. And you can get out of your edge-crisp and chewy-inside cake whenever you want. So, is it wonderful?Another troublesome thing is that, the traditional pan usually can’t get clean easily for its straight angle., which bring about many complaints from customers at American Amazon online shop. But for our rounded rectangular pan, you won’t worry about this trifle! We guarantee our ultimate Brownie pan is simple and time-saving to clean. And we recommend aluminum as the material of the pan, for it’s light and portable.In our model, we optimize the number of pans in each oven and derive the relationship of the number N and the radius r , the ratio of the width to the length of the pan . So given the ratio of the width to the length, we can get a certain r, and the number is also determined. Or given the radius r, we can also design the pan. This wonderful because different people have different demands for the number of the pans in each oven. Considering a family party or doing baby food, we need different number, of course.I believe the following merits may be attractive for most manufactures. We guarantee the rounded rectangular shape pan can save many materials. And the simple style confirms to the values of beauty. The environment-friendly, low –carbon style pan bring a new try for customers.Bring our ultimate Brownie pan to your home, you will find more surprises!10 References1Shixiong Liu, Mika Fukuoka, Noboru Sakai, A finite element model for simulating temperature distributions in rotating food during microwave heating, Journal of food engineering, V olume 115, issue 1, March 2013 Page 49-62 2Heat transfer theory /unitoperations/httrtheory.htm。
PROBLEM A: The Ultimate Brownie Pan问题A:终极布朗尼蛋糕盘When baking in a rectangular pan heat is concentrated in the 4 corners and the product gets overcooked at the corners (and to a lesser extent at the edges).当蛋糕在矩形盘里加热时,热量会集中在蛋糕的四个角导致加热过度(在较小的边缘处也有这种情况)。
In a round pan the heat is distributed evenly over the entire outer edge and the product is not overcooked at the edges.在圆形的盘子里,热量均匀的分布在蛋糕表面,所以不会加热过度。
However, since most ovens are rectangular in shape using round pans is not efficient with respect to using the space in an oven.然而,由于大多数的烤箱是矩形的,使用的盘子是圆形的,不能有效的利用烤箱里的空间。
Develop a model to show the distribution of heat across the outer edge of a pan for pans of different shapes - rectangular to circular and other shapes in between.建立模型来显示在使用不同形状的盘子时(方形,圆形和两者之间的其他形状),热量在其表面的分布情况。
Assume假设1. A width to length ratio of W/L for the oven which is rectangular in shape.1,烤箱是矩形的,长为l,宽为W。
2013年美国大学生数学建模和跨学科建模竞赛试题
叶其孝
【期刊名称】《数学建模及其应用》
【年(卷),期】2013(002)002
【摘要】A题:最佳果仁巧克力食品烤盘在矩形烤盘中烘烤食品(例如蛋糕)时热量集中在4个角点处,而食品也在这些角点处烤过头(在4条边处不那么过头)。
在圆形烤盘中沿其外边缘热量均匀分布,食品不会在外边缘烤过头。
然而,因为大多数烤箱是矩形的,所以就利用烤箱的空间而言使用圆形烤盘效率不高。
研制(数学)模型来展示不同形状烤盘——矩形、圆形以及介乎其间的各种形状的烤盘——在穿过其外边缘时的热量分布。
假设:1.矩形烤箱的宽长比为W/L;2.每种烤盘的面积必须为A;3.两个搁物网架均匀放置在烤箱中。
研制能够在下列条件下选择最佳烤盘形状的(数学)模型:(1)使烤箱中能容纳的烤盘数最大(N);
【总页数】3页(P50-52)
【作者】叶其孝
【作者单位】
【正文语种】中文
【相关文献】
1.2015年美国大学生数学建模和跨学科建模竞赛试题(A题和B题) [J], 周蓉;
2.2014年美国大学生数学建模和跨学科建模竞赛试题 [J], 王艳慧
3.2014年美国大学生数学建模和跨学科建模竞赛试题 [J], 王艳慧;
4.2013年美国大学生数学建模和跨学科建模竞赛试题 [J], 叶其孝;
5.2012年美国大学生数学建模和跨学科建模竞赛试题 [J], 叶其孝
因版权原因,仅展示原文概要,查看原文内容请购买。