gephi-教程
- 格式:pdf
- 大小:1.76 MB
- 文档页数:32

在Gephi中,Node Color Manager是一个插件,用于管理节点颜色。
以下是使用Node Color Manager的步骤:
1.打开Gephi软件,并导入数据集。
2.在左侧的“数据”面板中,选择“Nodes”选项卡,可以看到所有节点的属性信息。
3.在“Nodes”选项卡中,选择需要设置颜色的节点属性。
例如,选择“Degree”属性,
表示节点的度数。
4.点击“Ranking”按钮,在弹出的菜单中选择“Degree”,然后点击“Apply”按钮。
5.在“Appearance”面板中,选择“Nodes”选项卡,可以看到所有节点的颜色。
6.点击“Node Color Manager”插件按钮,打开插件界面。
7.在Node Color Manager界面中,可以看到当前节点的颜色设置。
可以选择不同的
颜色方案,如“Random”随机颜色、“Graduation”渐变色等。
8.点击“Export”按钮,可以将当前的颜色设置导出为CSV文件。
9.点击“Import”按钮,可以从CSV文件中导入颜色设置。
10.调整节点颜色方案后,点击“Save”按钮保存更改。
11.回到Gephi主界面,可以看到调整后的节点颜色效果。
需要注意的是,Node Color Manager插件的具体使用方法可能因版本和实际需求而有所不同。
如果无法找到该插件或遇到其他问题,建议查看Gephi官方文档或寻求相关技术支持。

gephi特征向量中心度
Gephi中的特征向量中心度是一种节点中心性度量方法。
它基于节点与其邻居节点之间的关联和连接模式来计算节点的重要性。
特征向量中心度的计算过程是迭代的,它会将节点的中心度值初始化为1,然后通过迭代更新该值,直到收敛。
更新的过程是基于节点邻居节点的中心度值以及它们之间的连接强度。
特征向量中心度可以帮助识别在网络中具有重要影响力和控制力的节点。
具有较高特征向量中心度的节点意味着它在网络中连接了许多其他重要节点。
在Gephi中,你可以通过执行以下步骤计算节点的特征向量中心度:
1. 打开Gephi软件并导入网络数据。
2. 在"Statistics"选项卡中选择"Network Overview"。
3. 在"Centrality"选项中选择"EigenVector"。
4. 点击"Run"按钮运行计算。
计算完成后,你将会看到每个节点的特征向量中心度值显示在节点的属性中。
你还可以使用颜色映射或节点大小来可视化节点的特征向量中心度值。

Gephi入门(1)
1.Gephi的用户界面和基本操作流程
1.1 欢迎窗口
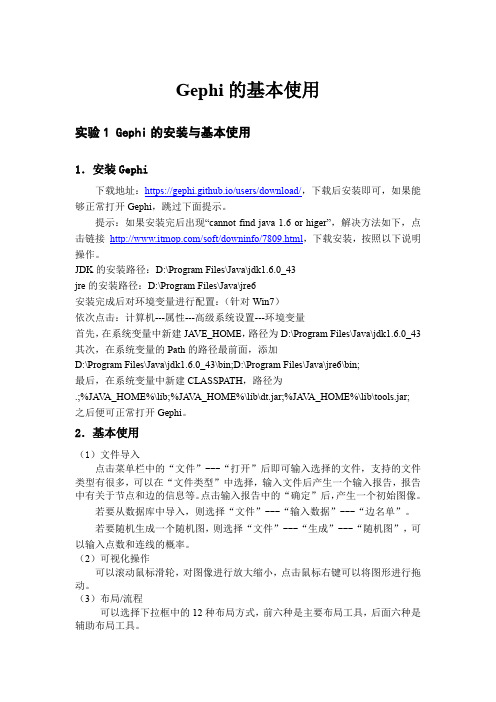
首先,打开Gephi软件,会显示一个欢迎窗口。
欢迎窗口有三个选项:左边近来打开,下面会显示最近打开过的文件;右上方新建工程,下面有两个选项,点击新建工程会创建一个新的文件,点击打开图文件会打开一个Gephi自己的文件;右下方样例,下面的选项是Gephi的三个内置图形文件。
1.2操作界面
操作界面正中间最大的区域是Graph窗体,是Gephi中图形编辑和显示的区域。
Graph窗体的左侧,是一列主要用于编辑、结点和连线的工具,窗体下侧是主要用于编辑标签和控制显示属性的工具。
Graph窗体的左边,有三个可视化工具,通过下拉框挑选操作任务,调整图形颜色大小形态;Graph窗体的右边,有两个并列工具,利用不同的分级列表选择操作任务,过滤工具的作用是过滤结点和连线的数量;统计工具的作用是通过计算给结点和连线赋予不同的权值。
主界面的上方是概览、数据资料、预览三个长条形按钮。
以上编辑工具都包含于概览中。
数据资料:对数据本身的处理在数据资料中进行,数据分为结点数据和连线数据两部分。
预览:预览中可以设置美化图形外观,点击刷新可在右方窗口中预览新编辑的图形完全外观。
将概览、数据资料、预览三方组合使用,就可以构成生产可视化图形的完整流程。
2.数据进入Gephi的方法
2.1从数据库导入
点击文件按钮,选中其中的输入数据,边名单。
出现数据设置,确定后即可导入。
2.1浏览网站获取数据
需要安装一个Gephi的http代理。
3.通过鼠标点击创建节点和联系。

gephi简要教程原文链接:/thread-11250-1-1.htmlGephi是一款开源免费跨平台基于JVM的复杂网络分析软件, 其主要用于各种网络和复杂系统。
Gephi软件可以从官方网站/免费获得。
gephi软件使用前需要安装Java Runtime Environment(简称JRE,可以从天空软件园/soft/27213.html下载获得)。
用Gephi处理网络的主要步骤:1.收集现有网络,得到用边两边节点表示的CSV文件。
如果得到excel文件,可以用另存为获得csv文件。
得到例如:1,22,33,44,55,61,61,32.运行gephi软件。
如图。
选择File-Open。
将File Type改为CSV,选择对应的csv文件,点击Open打开。
3.出现如图的导入对话框。
可以修改Directed/Undirected等。
确认无误点击Ok。
4.导入后出现如图界面。
中间是图的一个可视化表示。
5.右手边的Statistics栏目中可以计算度分部、模块度、社团划分、PageRank等。
6.如果需要分析随机图,在第二步时点击File-Generate-Random Network。
即可生成ER随机图。
7.以此图为例,先到Statistics栏计算Average Degree和Modular。
点击run后获得结果。
8.回到左手边的Partition窗口。
点击Nodes下面的刷新按钮,再从下拉菜单选择Modularity class。
后选择Apply。
即可根据社团结构染色。
9.在左手边的Ranking窗口,选择第一栏第四个图标,下面标准选择Degree。
点击Apply 即可按照度大小改变节点大小可视化。
10.左下角的Layout可以调整可视化图的布局。
Choose a layout的下拉栏选择ForceAtlas,在下面的Adjust by size右边勾选. 点击Run即可开始。
得到合适的布局时点击Stop。

用gephi层次聚类Gephi层次聚类是一种基于图论的数据分析方法,可以帮助我们发现数据集中的层次结构和聚类模式。
本文将介绍Gephi层次聚类的基本概念、应用场景以及操作步骤,并通过实例解释其原理和优势。
一、Gephi层次聚类的基本概念Gephi是一款开源的网络分析软件,提供了丰富的功能和工具,其中之一就是层次聚类。
层次聚类是一种将数据集按照层次结构进行分组的方法,通过计算相似性指标和聚类算法,将相似的节点聚合到同一层次下的簇中。
二、Gephi层次聚类的应用场景Gephi层次聚类在各个领域都有广泛的应用,特别是在社交网络分析、生物信息学、金融风险管理等领域。
例如,在社交网络分析中,可以利用Gephi层次聚类来发现社交网络中的社群结构,从而了解不同社群之间的关系和成员的特征。
三、Gephi层次聚类的操作步骤1. 数据准备:将需要分析的数据导入Gephi软件,数据可以是节点和边的关系表格或者网络数据集。
2. 数据预处理:对数据进行清洗和筛选,剔除异常值和无关节点,保留需要分析的核心节点。
3. 相似性计算:根据节点之间的特征和关系,计算节点之间的相似性指标,常用的指标有欧氏距离、相关系数等。
4. 聚类算法选择:根据问题的需求和数据的特点选择合适的聚类算法,常用的算法有K-means、层次聚类等。
5. 聚类结果可视化:通过Gephi软件提供的可视化工具,将聚类结果以图形的形式展示出来,便于对结果的观察和分析。
6. 结果解释和评估:根据聚类结果,对簇的特征进行解释和评估,可以利用统计方法和可视化工具进行进一步分析。
四、Gephi层次聚类的优势1. 层次结构展示:Gephi层次聚类可以将数据集的层次结构以图形的形式呈现出来,便于对数据的理解和分析。
2. 聚类结果可视化:通过Gephi软件提供的可视化工具,可以直观地展示聚类结果,帮助用户更好地理解和解释聚类结果。
3. 灵活性和扩展性:Gephi软件提供了丰富的插件和扩展功能,用户可以根据自己的需求进行功能扩展和定制,满足不同领域的数据分析需求。
用Gephi制作力导布局图第一步导入数据
第二步修改外观
在页面的左上角,找到颜色>节点>rank并选择一种渲染方式中的frequency,再应用,颜色随之改变。
继续选择大小>节点>rank并选择一种渲染方式中的frequency,然后应用,点的大小随之改变。
第三步修改布局
在布局中选择布局ForceAtlas2,然后点击运行。
第四步添加标签
添加发明人姓名,在图形展示区的下方有编辑器。
发明人名字添加后,页面比较紧凑,我们可以在布局页面改变参数来调整页面,针对本图我们只需要把“缩放”增加到30后,运行。
从图中可以看出,有些人名是重叠的,我们就需要移动圆点,具
体操作是把鼠标移动到圆点上方,出现以下页面,就可以直接拖动。
移动以后的图形如下图所示:
第五步预览图形
预览图形,看看布局是否合理,才能导出最终图像。
点击预览后,页面是空白的,这时候需要点击左下角的刷新,就会出现图像。
可以看出,图形中没有发明人名称,这时候,我们就需要添加名字,操作界面在屏幕左边。
需要勾选显示标签,然后再改字体,最后刷新,就能得出最终图形。
作图数据:https:///s/1ot0nwMNrXSpS0zxo-NOtbQ
提取码:4olx。
社交网络分析算法的使用教程社交网络分析(Social Network Analysis,SNA)是一种研究人际关系的方法,通过分析个体之间的连接和关联,揭示社交网络中的模式和结构。
在社交媒体时代,社交网络分析算法成为了研究网络社会学、营销学以及信息传播的重要工具。
本文将介绍几种常用的社交网络分析算法及其使用教程。
一、度中心性算法(Degree Centrality)度中心性算法是最简单也是最常用的社交网络分析算法之一,用于计算每个节点在网络中有多少条边与之连接。
该算法可以用来评估一个节点的重要性和影响力。
具体计算方法如下:1. 首先,将网络数据导入社交网络分析工具(如Gephi、Cytoscape等)中。
2. 在工具中选择度中心性算法,并点击运行。
3. 程序会计算每个节点的度中心性,并将结果显示在节点上或作为节点的属性。
4. 分析结果,找出具有较高度中心性的节点,这些节点在网络中起到重要的枢纽作用。
二、介数中心性算法(Betweenness Centrality)介数中心性算法用于衡量节点在网络中的中介地位,即节点在连接其他节点之间的最短路径中扮演的角色。
该算法可以用来识别那些在信息传播、资源传输中起到关键作用的节点。
具体计算方法如下:1. 在社交网络分析工具中导入网络数据。
2. 在工具中选择介数中心性算法,并点击运行。
3. 工具会计算每个节点的介数中心性,并在节点上显示结果。
4. 根据分析结果,找出介数中心性较高的节点,这些节点在信息传播和资源传输中扮演着重要的桥梁角色。
三、聚集系数算法(Clustering Coefficient)聚集系数算法用于衡量节点邻居之间的相互连接程度,用来判断网络中的群组和社区结构。
该算法可以帮助我们理解社交网络中的小世界现象和群体行为。
具体计算方法如下:1. 将网络数据导入社交网络分析工具中。
2. 在工具中选择聚集系数算法,并运行。
3. 工具会计算每个节点的聚集系数,并在节点上显示结果。
Gephi T utorial Quick Start Welcome to this introduction tutorial. It will guide you to the basic steps of network visualization and manipulation in Gephi.Gephi version 0.7alpha2 was used to do this tutorial.Get GephiLast updated March 05th, 2010* Introduction * Import file * Visualization * Layout * Ranking (color)* MetricsOpen Graph File • Download the file LesMiserables.gexf • In the menubar , go to File Menu and Open...Graph Format * Introduction * Import file * Visualization * Layout * Ranking (color)* MetricsImport Report • When your filed is opened, the report sum up data found and issues.- Number of nodes - Number of edges - Type of graph• Click on OK to validate and see the graph* Introduction * Import file * Visualization * Layout * Ranking (color)* MetricsYou should now see a graph We imported “Les Miserables” dataset 1. Coappearance weighted network of characters in the novel “Les Miserables” from Victor Hugo.Nodes position is random at first, so you may see a slighty different representation.1 D. E. Knuth, The Stanford GraphBase: A Platform for Combinatorial Computing, Addison-Wesley, Reading, MA (1993).* Introduction * Import file * Visualization * Layout * Ranking (color)* MetricsGraph Visualization• Use your mouse to move and scale the visualization - Zoom: Mouse Wheel- Pan: Right Mouse Drag• Locate the “Edge Thickness” slider on the bottom•If you loose your graph, reset the position Zoom Drag* Introduction * Import file* Visualization * Layout* Ranking (color) * Metrics• Choose “Force Atlas”You can see the layout properties below, leave default values.• Click on to launch the algorithm Layout algorithms sets the graph shape, it is the most essential action.• Locate the Layout module, on the left yout algorithms * Introduction * Import file * Visualization * Layout * Ranking (color)* MetricsThe purpose of Layout Properties is to let you control the algorithm in order to make a aesthetically pleasing representation.• And now the algorithm. • Set the “Repulsion strengh” at 10 000 to expand the graph.• Type “Enter” to validate the changed value.* Introduction * Import file* Visualization * Layout* Ranking (color) * MetricsYou should now see a layouted graph* Introduction* Import file* Visualization* Layout* Ranking (color)* Metrics• Locate Ranking module, in the top left.• Choose “Degree” as a rank parameter .• Click on to see the result.Ranking (color)Ranking module lets you configure node’s color and size.You should obtain the configuration panel below:* Introduction * Import file * Visualization * Layout * Ranking (color)* Metrics• Move your mouse over the gradient component. • Double-click on triangles to configure the color Let’s configure colorsPalette * Introduction * Import file * Visualization * Layout * Ranking (color)* Metrics• Enable table result view at the bottom toolbar • Click again on Ranking result tableYou can see rank values by enabling the result table. Valjean has 36 links and is the mostconnected node in the network.* Introduction * Import file * Visualization * Layout * Ranking (color)* MetricsWe will calculate the average path length for the network. It computes the path length for all possibles pairs of nodes and give information about how nodes are close from each other.• Locate the Statistics module on the right panel.• Click on near “Average Path Length”. MetricsMetrics available* Introduction * Import file* Visualization * Layout* Ranking (color) * MetricsMetric settingsThe settings panel immediately appears.• Select “Directed” and click on OK to compute the metric.* Introduction * Import file * Visualization * Layout * Ranking (color)* MetricsWhen finished, the metric dis-plays its result in a report* Introduction * Import file * Visualization * Layout * Ranking (color)* Metrics• Go back to Ranking • Select “Betweeness Centrality” in the list. This metrics indicates influencial nodes for highest value.Metrics generates general reports but also results for each node. Thus three new values have been created by the “Average Path Length” algorithm we ran.- Betweeness Centrality- Closeness Centrality - Eccentricity * Introduction * Import file * Visualization * Layout * Ranking (color)* MetricsThe node’s size will be set now. Colors remain the “Degree” indicator .• And click on to see the result.• Select the diamond icon in the toolbar for size. • Set a min size at 10 and a max size at 50.* Introduction * Import file * Visualization * Layout * Ranking (color)* MetricsYou should see a colored and sized graph Color: Degree Size: Betweeness Centrality metric* Introduction * Import file * Visualization * Layout * Ranking (color)* Metrics• Go Back to the Layout panel. • Check the “Adjust by Sizes” option and run again the algorithm for short moment.• You can see nodes are not overlapping anymore.The layout is not completely satisfying, as big nodes can overlap smaller .The “Force Atlas” algorithm has an option to take node size in account when layouting.* Introduction * Import file * Visualization * Layout * Ranking (color)* MetricsLet’s explore the network more in details now that colors and size indicates central nodes.• Display node labels • Set label size proportional to node size • Set label size with the scale slider* Introduction * Import file * Visualization * Layout * Ranking (color)* MetricsCommunity detection The ability to detect and study communities is central in network analysis. We would like to colorize clusters in our example.Gephi implements the Louvain method 1, available from the Statistics panel.Click on near the “Modularity” line 1 Blondel V , Guillaume J, Lambiotte R, Mech E (2008) Fast unfolding of communities in large net-works. J Stat Mech: Theory Exp 2008:P10008. ()• Select “Randomize” on the panel.• Click on OK to launch the detection.* Introduction * Import file * Visualization * Layout * Ranking (color)* Metrics• Locate the Partition module on the left panel.• Immediately click on the “Refresh” button to pop-ulate the partition list.The community detection algorithm created a “Modularity Class” value for each node.The partition module can use this new data to colorize communities.How to visualize nodes & edges columns?Select Data Laboratory tab and click on “Nodes” to refresh the table.* Introduction * Import file * Visualization * Layout* Ranking (color)* Metrics• Select “Modularity Class” in the partition list.You can see that 9 communities were found, could be different for you. A random color has been set for each community identifier .• Click on to colorize nodes.Right-click on the panel to access the Randomize colors action.* Introduction * Import file * Visualization * Layout* Ranking (color)* MetricsWhat the network looks like now * Introduction* Import file* Visualization* Layout* Ranking (color)* Metrics• Locate the Filters module on the right panel.• Select “Degree Range” in the “Topology” category .• Drag it to the Queries, drop it to “Drag filter here”.The last manipulation step is filtering. You create filters that can hide nodes and egdeson the network. We will create a filter to remove leaves, i.e. nodes with a single edge.* Introduction * Import file * Visualization * Layout* Ranking (color)* MetricsTip• Click on “Degree Range” to activate the filter .The parameters panel appears.It shows a range slider and the chart that represents the data, the degree distribution here.• Move the slider to sets its lower bound to 2.• Enable filtering by pushing the button.Nodes with a degree inferior to 2 are now hidden.* Introduction * Import file * Visualization * Layout* Ranking (color)* MetricsThe filtered networkThat ends the manipulation. We will now preview the rendering and prepare to export.* Introduction * Import file * Visualization * Layout* Ranking (color)* Metrics• Before exporting your graph as a SVG or PDF file, go to the Preview to:• Select the “Preview” tab in the banner:• Click on Refresh to see the preview- See exactly how the graph will look like- Put the last touchTip* Introduction * Import file * Visualization * Layout* Ranking (color)* Metrics• In the Node properties, find “Show Labels” and enable the option.• Click onPreview Settings supports Presets, click on the presets list and try different configurations.* Introduction * Import file * Visualization * Layout* Ranking (color)* MetricsThe Previewed Graph* Introduction* Import file* Visualization* Layout* Ranking (color)* MetricsExport as SVGFrom Preview, click on SVG near Export.SVG Files are vectorial graphics, like PDF . Images scale smoothly to different sizes andcan therefore be printed or integrated in high-res presentation.Transform and manipulate SVG files in Inkscape or Adobe Illustrator .High-resolution screenshotsIf you prefer hi-resolution PNG screenshots only, look at the icon in the visualization properties * Introduction * Import file * Visualization * Layout* Ranking (color)* MetricsSave your projectSaving your project encapsulates all data and results in a single session file.If you missed some steps, you can download the session:LesMiserables.gephi * Introduction* Import file* Visualization* Layout* Ranking (color)* MetricsConclusion In this tutorial you learned the basic process to open, visualize, manipulate and render a network file with Gephi.Go further:• Gephi Website • Gephi Wiki • Gephi forum * Introduction * Import file * Visualization * Layout * Ranking (color)* Metrics。
Gephi T utorial Quick Start Welcome to this introduction tutorial. It will guide you to the basic steps of network visualization and manipulation in Gephi.Gephi version 0.7alpha2 was used to do this tutorial.Get GephiLast updated March 05th, 2010* Introduction * Import file * Visualization * Layout * Ranking (color)* MetricsOpen Graph File • Download the file LesMiserables.gexf • In the menubar , go to File Menu and Open...Graph Format * Introduction * Import file * Visualization * Layout * Ranking (color)* MetricsImport Report • When your filed is opened, the report sum up data found and issues.- Number of nodes - Number of edges - Type of graph• Click on OK to validate and see the graph* Introduction * Import file * Visualization * Layout * Ranking (color)* MetricsYou should now see a graph We imported “Les Miserables” dataset 1. Coappearance weighted network of characters in the novel “Les Miserables” from Victor Hugo.Nodes position is random at first, so you may see a slighty different representation.1 D. E. Knuth, The Stanford GraphBase: A Platform for Combinatorial Computing, Addison-Wesley, Reading, MA (1993).* Introduction * Import file * Visualization * Layout * Ranking (color)* MetricsGraph Visualization• Use your mouse to move and scale the visualization - Zoom: Mouse Wheel- Pan: Right Mouse Drag• Locate the “Edge Thickness” slider on the bottom•If you loose your graph, reset the position Zoom Drag* Introduction * Import file* Visualization * Layout* Ranking (color) * Metrics• Choose “Force Atlas”You can see the layout properties below, leave default values.• Click on to launch the algorithm Layout algorithms sets the graph shape, it is the most essential action.• Locate the Layout module, on the left yout algorithms * Introduction * Import file * Visualization * Layout * Ranking (color)* MetricsThe purpose of Layout Properties is to let you control the algorithm in order to make a aesthetically pleasing representation.• And now the algorithm. • Set the “Repulsion strengh” at 10 000 to expand the graph.• Type “Enter” to validate the changed value.* Introduction * Import file* Visualization * Layout* Ranking (color) * MetricsYou should now see a layouted graph* Introduction* Import file* Visualization* Layout* Ranking (color)* Metrics• Locate Ranking module, in the top left.• Choose “Degree” as a rank parameter .• Click on to see the result.Ranking (color)Ranking module lets you configure node’s color and size.You should obtain the configuration panel below:* Introduction * Import file * Visualization * Layout * Ranking (color)* Metrics• Move your mouse over the gradient component. • Double-click on triangles to configure the color Let’s configure colorsPalette * Introduction * Import file * Visualization * Layout * Ranking (color)* Metrics• Enable table result view at the bottom toolbar • Click again on Ranking result tableYou can see rank values by enabling the result table. Valjean has 36 links and is the mostconnected node in the network.* Introduction * Import file * Visualization * Layout * Ranking (color)* MetricsWe will calculate the average path length for the network. It computes the path length for all possibles pairs of nodes and give information about how nodes are close from each other.• Locate the Statistics module on the right panel.• Click on near “Average Path Length”. MetricsMetrics available* Introduction * Import file* Visualization * Layout* Ranking (color) * MetricsMetric settingsThe settings panel immediately appears.• Select “Directed” and click on OK to compute the metric.* Introduction * Import file * Visualization * Layout * Ranking (color)* MetricsWhen finished, the metric dis-plays its result in a report* Introduction * Import file * Visualization * Layout * Ranking (color)* Metrics• Go back to Ranking • Select “Betweeness Centrality” in the list. This metrics indicates influencial nodes for highest value.Metrics generates general reports but also results for each node. Thus three new values have been created by the “Average Path Length” algorithm we ran.- Betweeness Centrality- Closeness Centrality - Eccentricity * Introduction * Import file * Visualization * Layout * Ranking (color)* MetricsThe node’s size will be set now. Colors remain the “Degree” indicator .• And click on to see the result.• Select the diamond icon in the toolbar for size. • Set a min size at 10 and a max size at 50.* Introduction * Import file * Visualization * Layout * Ranking (color)* MetricsYou should see a colored and sized graph Color: Degree Size: Betweeness Centrality metric* Introduction * Import file * Visualization * Layout * Ranking (color)* Metrics• Go Back to the Layout panel. • Check the “Adjust by Sizes” option and run again the algorithm for short moment.• You can see nodes are not overlapping anymore.The layout is not completely satisfying, as big nodes can overlap smaller .The “Force Atlas” algorithm has an option to take node size in account when layouting.* Introduction * Import file * Visualization * Layout * Ranking (color)* MetricsLet’s explore the network more in details now that colors and size indicates central nodes.• Display node labels • Set label size proportional to node size • Set label size with the scale slider* Introduction * Import file * Visualization * Layout * Ranking (color)* MetricsCommunity detection The ability to detect and study communities is central in network analysis. We would like to colorize clusters in our example.Gephi implements the Louvain method 1, available from the Statistics panel.Click on near the “Modularity” line 1 Blondel V , Guillaume J, Lambiotte R, Mech E (2008) Fast unfolding of communities in large net-works. J Stat Mech: Theory Exp 2008:P10008. ()• Select “Randomize” on the panel.• Click on OK to launch the detection.* Introduction * Import file * Visualization * Layout * Ranking (color)* Metrics• Locate the Partition module on the left panel.• Immediately click on the “Refresh” button to pop-ulate the partition list.The community detection algorithm created a “Modularity Class” value for each node.The partition module can use this new data to colorize communities.How to visualize nodes & edges columns?Select Data Laboratory tab and click on “Nodes” to refresh the table.* Introduction * Import file * Visualization * Layout* Ranking (color)* Metrics• Select “Modularity Class” in the partition list.You can see that 9 communities were found, could be different for you. A random color has been set for each community identifier .• Click on to colorize nodes.Right-click on the panel to access the Randomize colors action.* Introduction * Import file * Visualization * Layout* Ranking (color)* MetricsWhat the network looks like now * Introduction* Import file* Visualization* Layout* Ranking (color)* Metrics• Locate the Filters module on the right panel.• Select “Degree Range” in the “Topology” category .• Drag it to the Queries, drop it to “Drag filter here”.The last manipulation step is filtering. You create filters that can hide nodes and egdeson the network. We will create a filter to remove leaves, i.e. nodes with a single edge.* Introduction * Import file * Visualization * Layout* Ranking (color)* MetricsTip• Click on “Degree Range” to activate the filter .The parameters panel appears.It shows a range slider and the chart that represents the data, the degree distribution here.• Move the slider to sets its lower bound to 2.• Enable filtering by pushing the button.Nodes with a degree inferior to 2 are now hidden.* Introduction * Import file * Visualization * Layout* Ranking (color)* MetricsThe filtered networkThat ends the manipulation. We will now preview the rendering and prepare to export.* Introduction * Import file * Visualization * Layout* Ranking (color)* Metrics• Before exporting your graph as a SVG or PDF file, go to the Preview to:• Select the “Preview” tab in the banner:• Click on Refresh to see the preview- See exactly how the graph will look like- Put the last touchTip* Introduction * Import file * Visualization * Layout* Ranking (color)* Metrics• In the Node properties, find “Show Labels” and enable the option.• Click onPreview Settings supports Presets, click on the presets list and try different configurations.* Introduction * Import file * Visualization * Layout* Ranking (color)* MetricsThe Previewed Graph* Introduction* Import file* Visualization* Layout* Ranking (color)* MetricsExport as SVGFrom Preview, click on SVG near Export.SVG Files are vectorial graphics, like PDF . Images scale smoothly to different sizes andcan therefore be printed or integrated in high-res presentation.Transform and manipulate SVG files in Inkscape or Adobe Illustrator .High-resolution screenshotsIf you prefer hi-resolution PNG screenshots only, look at the icon in the visualization properties * Introduction * Import file * Visualization * Layout* Ranking (color)* MetricsSave your projectSaving your project encapsulates all data and results in a single session file.If you missed some steps, you can download the session:LesMiserables.gephi * Introduction* Import file* Visualization* Layout* Ranking (color)* MetricsConclusion In this tutorial you learned the basic process to open, visualize, manipulate and render a network file with Gephi.Go further:• Gephi Website • Gephi Wiki • Gephi forum * Introduction * Import file * Visualization * Layout * Ranking (color)* Metrics。