Improved Duplication Models for Proteome Network Evolution
- 格式:pdf
- 大小:225.51 KB
- 文档页数:20
Journal of Biotechnology 164 (2013) 123–129Contents lists available at SciVerse ScienceDirectJournal ofBiotechnologyj o u r n a l h o m e p a g e :w w w.e l s e v i e r.c o m /l o c a t e /j b i o t ecImproved activity and thermostability of Bacillus pumilus lipase by directed evolutionNagihan Akbulut a ,∗,Merve Tuzlako˘g lu Öztürk a ,Tjaard Pijning b ,Saliha ˙I s ¸sever Öztürk a ,Füsun Gümüs ¸el a ,1a Department of Molecular Biology and Genetics,Gebze Institute of Technology (GIT),41400Kocaeli,TürkiyebLaboratory of Biophysical Chemistry,Groningen Biomolecular Sciences and Biotechnology Institute (GBB),University of Groningen,Nijenborgh 7,9747AG Groningen,The Netherlandsa r t i c l ei n f oArticle history:Received 11September 2012Received in revised form 20December 2012Accepted 21December 2012Available online 11 January 2013Keywords:Bacillus pumilus lipase BiocatalystDirected evolution DNA shuffling Thermostability3D homology modela b s t r a c tTo improve enzymatic activity of Bacillus pumilus lipases,DNA shuffling was applied to two lipase genes from local B.pumilus ing a high-throughput activity assay,the mutant with highest activity was selected.This chimeric mutant (L3-3),carrying two crossover positions and three point mutations,has a specific activity 6.4and 8.2times higher than the two parent enzymes.The mutant also is more tolerant to various detergents and organic solvents,and has a 9times longer half-life at 50◦C.Homology modeling of mutant L3-3,based on the highly homologous B.subtilis lipase A,shows that the increased thermostability is likely due to structural rigidification and reduced surface hydrophobicity.Increased specific activity may result from the location of mutations close to the active site.Together,our results show that it is possible to evolve,by DNA shuffling,B.pumilus lipase variants with improved applicability as biocatalysts,even if the two parent enzymes are highly similar.© 2013 Elsevier B.V. All rights reserved.1.IntroductionLipases (triacylglycerol acylhydrolases,EC 3.1.1.3)catalyze the hydrolysis and synthesis of esters of glycerol and long-chain fatty acids.Microbial lipases are of commercial interest for chemical,food,pharmaceutical,detergent and other industrial applications (Jaeger and Eggert,2002;Pandey et al.,1999;Sharma et al.,2001).Among them,Bacillus pumilus lipases have been classi-fied as members of subfamily I.4,sharing sequence identities of 74–77%(Arpigny and Jaeger,1999;Jaeger et al.,1999);also the well-characterized Bacillus subtilis lipases belong to this family.The subfamily I.4lipases are the smallest lipases known,having a minimal ␣/hydrolase fold (van Pouderoyen et al.,2001)and a solvent-exposed substrate-binding site.In order to use lipases as biocatalysts in industrial applications,it is often desirable to improve properties such as activity (in aque-ous or organic solvent environments),thermostability,substrate specificity and enantioselectivity (Arnold and Volkov,1999;Reetz,∗Corresponding author.Tel.:+902626052540;fax:+902626052505.E-mail addresses:nakbulut@.tr ,nagihanakbulut@ (N.Akbulut).1During this work,Prof.Dr.Füsun Gümüs ¸el passed away;we remember her with respect.2004).Directed evolution is a powerful approach to achieve such improvements.Rapid generation of molecular diversity is essential,and one of the best methods to achieve this is homologous recombi-nation through DNA shuffling (Crameri et al.,1998).When coupled with high-throughput screening,DNA shuffling and other directed evolution methods have often resulted in remarkable improve-ments of activity,thermostability or enantioselectivity (Crameri et al.,1998;Reetz,2004;Schmidt-Dannert and Arnold,1999).The lipase A from B.subtilis has been the subject of several such stud-ies (Acharya et al.,2004;Ahmad et al.,2008;Augustyniak et al.,2012;Dröge et al.,2006;Kamal et al.,2011).In contrast,a directed evolution approach for B.pumilus lipase has only been reported by Huang et al.(2008)who used error-prone PCR to evolve mutants with increased activity.We applied the DNA shuffling method,coupled with a high-throughput screening assay,to improve the activity of lipases of subfamily I.4produced by local isolates of B.pumilus .The lipase mutant (L3-3)showing the highest activity was sequenced and purified,and biochemically characterized.Obtained after a single round of DNA shuffling from two parents sharing 89%identity,this chimeric mutant has two cross-over positions and carries three point mutations.Its activity was 6.4and 8.2times higher than that of the two parent enzymes.Surprisingly,L3-3also displayed a remarkable increase in thermostability,with a 9times longer half-life (T 1/2)at 50◦C.Taking advantage of the high sequence similarity0168-1656/$–see front matter © 2013 Elsevier B.V. All rights reserved./10.1016/j.jbiotec.2012.12.016124N.Akbulut et al./Journal of Biotechnology164 (2013) 123–129with B.subtilis lipase A,a3D homology model was constructed for L3-3,and the role of sequence differences between the mutant and the parents on enzyme activity and thermostability is discussed.2.Materials and methods2.1.Isolation and identificationBacterial strains L5and L21had been isolated by traditional bacteriological methods from hot springs at Balıkesir and Bursa, Türkiye(Tuzlako˘g lu et al.,2003).Characterization of the strains was done using biochemical tests,microscopical observations (Sneath,1984)and16S rRNA gene sequencing(˙I s¸severÖztürk et al., 2008).Database homology searches were performed with BLAST (/Blast.cgi).2.2.Cloning and expression of parent lipase genesChromosomal DNA was isolated from B.pumilus strains L5and L21(Tuzlako˘g lu et al.,2003;˙I s¸severÖztürk et al.,2008)and used to amplify by PCR the lipase-encoding genes,using a pair of degen-erate primers(forward:21F,reverse:22R).After30amplification cycles,a0.65-kb PCR product was recovered from an agarose gel. Cloning was carried out with InsTAclone TM PCR Cloning Kit(Fer-mentas).The purified PCR products were ligated in pTZ57R/T,and E.coli JM109cells were transformed with this ligation product.The resulting plasmids were named pTZ-L5and pTZ-L21.For expres-sion studies,Hind III–Eco RI fragments from the plasmids pTZ-L5and pTZ-L21were subcloned into the expression vector pUC19previ-ously digested with the same enzymes,separately.E.coli JM109 cells carrying recombinant vectors were grown for24h in the pres-ence of ampicillin(100g/ml)and gene expression was induced with afinal concentration of0.1mM IPTG.2.3.DNA shuffling library constructionA library of random fragments was constructed using modi-fied DNA shuffling methods(Lorimer and Pastan,1995;Stemmer, 1994;Zhao and Arnold,1997).Two0.65kb DNA fragments contain-ing lipase genes from L5and L21were amplified by using primers 21F and22R.Fragments of0.65kb were purified from1%agarose gel.Parent DNA fragments were digested with bovine pancreas DNase I in the presence of Mn2+.A mixture of50l(containing 1.5g of each parent DNA)and5l10×digestion buffer(50mM Tris(tris(hydroxymethyl)aminomethane)–HCl,10mM MnCl2)was equilibrated at25◦C for5min;0.45U of DNase I(diluted in1×digestion buffer)was added.Digestion was performed at25◦C and terminated after11min by heating at90◦C for10min.The digested fragments were separated by1.5%agarose gel electrophoresis;frag-ments of<70bp were isolated and purified from the gel.PCR without primers.The reaction volume(50l)contained 20l purified fragments,0.4mM dNTP mix,2.5U Pfu DNA poly-merase,1×Pfu DNA polymerase reaction buffer.The following PCR protocol was applied:3min at96◦C,40cycles of1min at94◦C, 1min at55◦C,1min+5s/cycle at72◦C,10min at72◦C.PCR with primers.The reaction mixture containing reassembled DNA-fragments(1l)along with primers21F and22R was used to amplify the full-length genes,using the same PCR cycling program as described in PCR without primers.PCR conditions(50lfinal vol-ume):80pmol of each primer,1×Taq polymerase reaction buffer, 0.2mM dNTP mix(Roche)and2.5U Taq/Pfu(1:1)polymerase mix-ture.The purified PCR product was digested with Hind III–Eco RI and ligated into plasmid pUC19,which had been digested with corre-sponding restriction enzymes to create the recombination library. Freshly prepared E.coli JM109cells were transformed with the resulting DNA mixture.Cells were plated on LB-agar containing1.5%agar and1%ampicillin,and incubated overnight.2.4.Enzyme expression and library screeningActive transformants were assessed by a three-step screening protocol.First,transformant colonies were replicated on tributyrin-agar plates containing0.15%Gum Arabic and1.5%tributyrin in LB-agar(Liebeton et al.,2000),supplemented with1%ampicillin.After incubation for16h,enzyme secretion into the medium was induced by incubation for6h at4◦C.Transformants showing lipase activity (resulting in clear halos surrounding the colonies)were selected.In the second step,selected variants were inoculated into the individual wells of96-well plates containing250l LB with1% ampicillin.After overnight growth(37◦C),lipase activity in the cul-ture supernatant was assayed quantitatively using p NP-palmitate as substrate,according to the method of Eom et al.(2005)with slight modifications;absorbance at405nm was measured with a Fluostar Omega Microplate Reader(BMG Labtech).Measured activ-ities were normalized for culture density;variants showing a higher normalized activity than parent strains were selected.Selected variants were further confirmed and analyzed in a third step by growing them in shakeflask cultures at37◦C.Ten milliliters of LB medium containing1%ampicillin were inoculated with0.1ml pre-culture;gene expression was induced with0.1mM IPTG.Nor-malized lipase activity was assayed according to the method of Winkler and Stuckmann(1979).2.5.DNA sequencing,purification and characterization of parents and mutant lipaseThe plasmid DNA of parents L5and L21and of the trans-formant with highest activity was isolated and sequenced (see Supplementary Material,Section1.3).The expressed lipase enzymes were subjected to a single-step purification;their purity was determined from an SDS-PAGE gel.Purification details and characterization of the purified enzymes by determination of temperature and pH profiles and stability,the effect of various detergents,organic solvents,metal ions and inhibitors on activity, and analysis of substrate specificity are described in Supplementary Material(Section1.4).2.6.Modeling studiesAfter analysis of the B.pumilus L3-3mutant sequence by the FFAS03server(Jaroszewski et al.,2011)the structure with the high-est sequence identity(78%),B.subtilis lipase A(PDB ID:1I6W(van Pouderoyen et al.,2001)),was used as a template in the“One-to-one threading”protocol of the Phyre2server(Kelley and Sternberg, 2009)to obtain3D models of mutant L3-3and parents L5and L21.Differences and mutation positions of the models were eval-uated in PyMOL(Schrödinger,LLC,version1.2r1)by looking at interaction possibilities and clash problems.Secondary structure assignment was calculated with DSSP(Kabsch and Sander,1983); hydrogen-bonding was assessed within PyMOL.Structuralfigures were prepared with PyMOL.3.Results3.1.Isolation and identification of lipase-producing strainsCharacterization of the bacterial strains previously isolated from hot springs near Balıkesir and Bursa(Türkiye)showed that they are Gram-positive,rod shaped,aerobic,catalase-positive and sporeN.Akbulut et al./Journal of Biotechnology164 (2013) 123–129125Fig.1.Schematic representation of the sequences of the two Bacillus pumilus parents(L5,light gray,and L21,dark gray)and mutant L3-3.Dark gray and light gray colors in the L3-3mutant indicate from which parent the L3-3mutant derived its sequence.Because of local homology at the DNA level,the crossover positions in L3-3cannot be determined exactly;thefirst crossover position is between residues20/21and23/24,and the second crossover position is between residues149/150and168/169,as indicated by the shaded parts.Chimeric differences between the two parents are indicated with black triangles;the3point mutations in the L3-3mutant are indicated with black bars.A more detailed alignment is given in Supplementary Material Fig.S2.forming.Biochemical tests and16S rDNA gene analysis identified the strains as B.pumilus,and they were designated as L5and L21.3.2.Cloning,sequencing and expression of the parent lipasesThe0.65kbp lipase open reading frames(ORFs)of the two B.pumilus strains L5and L21were amplified from the chro-mosomal DNA(Supplementary Material Fig.S1).Cloning into pTZ57R/T and subsequent DNA isolation and sequencing con-firmed the presence of ORFs of645bp,encoding precursor lipases of215amino acid residues.DNA translation showed that the encoded enzymes contain a34-residue signal peptide(SignalP 4.0,http://www.cbs.dtu.dk/services/SignalP);after cleavage,the mature enzymes thus contain181amino acid residues.Sequence analysis revealed that the L5and L21parent lipases share89%iden-tity with each other(at the protein level),and78%identity with B. subtilis lipase A(Supplementary Material Fig.S2).The parent lipase gene sequences have been deposited in GenBank with accession numbers JX163855(L5)and JX163856(L21).The L5and L21lipase genes were successfully subcloned into a pUC19vector,as confirmed by digestion of the recombinant plasmid and identification of the645bp DNA fragments.Trans-formation of E.coli JM109cells with the recombinant plasmids resulted in active expression of the lipases,as was confirmed by lipase activity assays.3.3.DNA shuffling and screening of the libraryA random B.pumilus lipase library was generated by DNA shuf-fling,using<70bp fragments obtained from the two B.pumilus lipase parent genes L5and L21.Reassembled products ran as sin-gle bands with the correct size on agarose gels(Supplementary Material Fig.S1).These were used to transform E.coli JM109cells; 5500transformants(55%)expressed a functional lipase,forming clear halos due to the hydrolysis of tributyrin.The350transfor-mants with highest activity(as judged by eye)were selected for the second screening step.From these,the16transformants showing a higher activity than the parent strains were selected for a third screening step,in which more favorable conditions for bacterial growth were applied.The transformant showing the highest nor-malized activity was further characterized by comparison with the two parent lipases.Sequencing revealed that the lipase expressed by this transformant(L3-3)is a chimeric mutant with2crossover positions,resulting in a large middle fragment originating from the L5parent,and shorter N-and C-terminal fragments derived from the L21parent(Fig.1and Supplementary Material Fig.S2).There are11“chimeric differences”(residues that differ between the two parent enzymes)in the middle fragment and3such differences in the terminal fragments.In addition,L3-3carries3point muta-tions(G14S,A15G and V109S);they do not stem from either parent, nor are they present in B.subtilis lipase A.Consequently,L3-3is Table1Specific activity and half-life of the partially purified parent(L5,L21)and mutant (L3-3)enzymes.The specific activity is given before(raw)and after correction for purity(40,25and60%for L5,L21and L3-3,respectively).L5L21L3-3Raw specific activity(U/mg)1150±3558±411,012±4 Corrected specific activity(U/mg)2878±82238±1618,332±7T1/2,50◦C(min) 4.20±0.12 4.40±0.0338.5±0.7 different from parent L5at6positions,and different from parent L21at14positions.3.4.Purification and characterization of parent and mutant B. pumilus lipasesResults of the purification of the two parent B.pumilus lipases and mutant L3-3are summarized in Supplementary Material Table S1.Typically,thefinal yield of enzyme was about50%of the ini-tial activity,with a9-fold increase in specific activity compared to the culture lysate supernatant.On SDS-PAGE,the purified enzymes were observed at about19kDa(Supplementary Material Fig.S3), with purities of about40,25and60%for L5,L21and L3-3,respec-tively.We did not succeed in purifying the enzymes further.For both parent and mutant lipases,the optimum temperature was37◦C(Supplementary Material Fig.S4),but,after correction for the differences in purity,the specific activity of mutant L3-3 was about6.4and8.2times higher than that of the parents L5 and L21,respectively(Table1).At higher temperatures,activity decreased fast to near-zero values at55◦C,but the L3-3mutant clearly retained more activity than the parent enzymes(Fig.2).TheFig.2.Relative residual activity of parents(L5,L21)and L3-3after pre-incubation at different temperatures for30min.126N.Akbulut et al./Journal of Biotechnology 164 (2013) 123–129Fig.3.3D homology model of the B.pumilus L3-3mutant,generated with Phyre2(Kelley and Sternberg,2009)based on the crystal structure of B.subtilis lipase A (van Pouderoyen et al.,2001).The N-and C-terminal polypeptide segments derived from parent L21,containing the 3chimeric differences (M12,A20and V169)are shown in blue;the middle segment derived from parent L5is shown in gray.The three point mutations G14S,A15G and V109S are shown with yellow carbon atoms.The catalytic residue S77in the active site is also shown.(For interpretation of the references to color in figure legend,the reader is referred to the web version of the article.)half-life (at 50◦C)of mutant L3-3was 9times longer than that of the parent enzymes (Table 1).The pH-activity profiles of both parents and mutant L3-3were very similar (Supplementary Material Fig.S5a ),with an optimum pH of 8.0.The residual activity profiles after 1week of incubation at 4◦C were also similar,with 80–100%activity retained between pH 6.5and 10.0(Supplementary Material Fig.S5b ).Metal ions (10mM)in general had modest effects (Supplementary Material Fig.S6,left panel );relative activi-ties were in the range of 50–163%.The most prominent effect was observed for CuCl 2,which showed an increased activity for L3-3while the parent lipases were inhibited.In addition,CoCl 2and FeCl 2increased activity of L3-3significantly.The presence of CaCl 2slightly inhibited the mutant,while the presence of EDTA (ethylene diamine tetraacetic acid)(1or 10mM)hardly affected activity;PMSF (phenylmethylsulfonyl fluoride)strongly inhibited activity of both parent enzymes and the mutant (Supplementary Material Fig.S6,right panel ).All tested detergents,except for Na-deoxycholate,inhibited the activity of parent and mutant lipases at the highest tested concen-tration;CTAB (cetyl trimethylammonium bromide)(1%)and SDS (sodium dodecyl sulfate)(1%)almost completely inactivated the enzymes (Supplementary Material Fig.S7a ).However,in several cases mutant L3-3retained a significantly higher activity than the parents,or was even stimulated.Most of the tested organic solvents had a slightly inhibiting effect on the activity of parent enzymes at 10%concentration;this effect was stronger at higher concentration (30%)(Supplementary Material Fig.S7b ).Notably,the L3-3mutant showed a tolerance to all tested organic solvents at 10%concentration except isoamyl alcohol.Analysis of the substrate specificity of parent and mutant lipases revealed only small variations (Supplementary Material Fig.S8);mutant L3-3showed a slightly higher activity toward long chain triacylglycerol fatty acids than the parent enzymes.3.5.Structural observationsThe 3D models generated for the B.pumilus lipase L3-3mutant (Fig.3)and its L5and L21parents showed high Phyre confidence values.Of the 40sequence differences between the B.subtilis lipase A and the B.pumilus L3-3mutant (Supplementary Material Fig.S2),almost half are homologous substitutions.For 35of these,the sidechains are at the surface and exposed to the solvent;the remaining differences are located in the hydrophobic core,and comprise at most one methylene or methyl group.About half (19)of the differ-ences occur in non-regular secondary structure elements such as loops and 310helices.For the G14S mutation,a different side chain rotamer was chosen to avoid a close contact with the side chain of N18.For all other changed residues,no severe clash problems were observed.The three chimeric differences of L3-3with parent L5and the three point mutations in L3-3are described below.The chimeric differences (M12,A20and V169).Residue 12is located at the tip of a 6-residue loop (residues 10–15)connect-ing strand 3and helix 1/␣A (Fig.4a).Its side chain is exposed to the solvent,and the chimeric change from isoleucine to methionine may increase hydrophobic and van der Waals interactions with thesubstrate.Residue 20,at the start of helix ␣A,is located about 16˚Afrom the active site,and has a solvent-exposed side chain.Changing a phenylalanine to alanine at this position will considerably reduce the hydrophobicity at the surface,and the tendency to aggregate at higher temperatures.Residue 169is in helix ␣F;its side chain is located in the hydrophobic interior of the enzyme (Fig.3),far from the active site.The change from isoleucine to valine at this posi-tion (one methyl group)may slightly change local packing in the enzyme’s interior.The point mutations (G14S ,A15G and V109S ).Residue 14is located in the 3-1/␣A loop (residues 10–15),adjacent to the sub-strate binding cleft (Fig.4a).The introduction of the serine side chain has no effect on the main chain torsion angles (ϕ=−86◦, =−171◦),but it increases the local surface polarity.In addition,it provides the possibility of the formation of two additional hydro-gen bonds within the loop.The -turn hydrogen bond interaction between the main chain oxygen atom of G11and the main chain nitrogen atom of S14is preserved.Mutation of residue 15intro-duces a third glycine residue in the 3-1/␣A loop (Fig.4a).In the parent B.pumilus enzymes (like in B.subtilis LipA),the alanine side chain at position 15points into the solvent,forming a hydropho-bic surface patch together with the side chain of Y17,at the rim of the substrate binding cleft.The absence of the methyl group in mutant L3-3mutant reduces local surface hydrophobicity.Residue 109is positioned at the surface,just after 310helix 4(Fig.4b).In both parent B.pumilus lipases L5and L21residue 109is a valine,and its mutation to serine reduces the local surface hydrophobic-ity.In mutant L3-3,this methyl group is absent,and local surface hydrophobicity is reduced.Moreover,the serine hydroxyl group isN.Akbulut et al./Journal of Biotechnology164 (2013) 123–129127Fig.4.Stereofigures of the L3-3mutant homology model.Point mutations are shown with yellow carbon atoms.Hydrogen bond interactions are shown as blue dashed lines.(a)Point mutations G14S and A15G located in the3-1/␣A loop(residues10–15)that connects strand1and helix␣A.The S14O␥atom has hydrogen bonding interactions with the N␦2atom of N18from helix␣A and the main chain nitrogen atom of G11.The-turn hydrogen bond interaction between G11O and G14N is also shown.The3-1/␣A loop is on one side of the substrate binding cleft,where the leaving group of a substrate would be bound.Some residues lining this part of the active site(I157,L160)are also shown in stick representation as well as the nucleophilic serine(S77).The main chain nitrogen atom of residue M12that forms part of the oxyanion hole is indicated with an asterisk(*).(b)The V109S point mutation;its side chain makes direct hydrogen bonds to the N␦2atom of N48,the N-terminal residue of helix ␣B,and to the main chain oxygen of A81(in helix␣C).The long␣B helix can make only one other direct hydrogen bond,between S56and D91.(For interpretation of the references to color infigure legend,the reader is referred to the web version of the article.)able to form two hydrogen bonds,similar to the equivalent thre-onine in B.subtilis lipase A.It can make one hydrogen bond to the main chain oxygen atom of residue A81(in helix␣C),and a second hydrogen bond to the N␦2atom of N48,the N-terminal residue of helix␣B.4.Discussion4.1.Activity and thermostability of mutant L3-3Mutant L3-3was selected from the shuffling library by screening for lipase activity.Our approach did not account for differences in lipase expression levels in the library and therefore may be biased.Nevertheless,our selection strategy resulted in a mutant with significantly improved specific activity.This mutant(L3-3) shows a6.4-and8.2-fold increase in specific activity,respectively when compared to its parent enzymes L5and L21.The usefulness of(mutant)lipases in industrial applications also depends on the effects of metal ions,detergents and organic solvents.For exam-ple,enzyme activity and stability in the presence of detergents is a requirement for laundry applications(Gaur et al.,2008).Further-more,tolerance to organic solvents facilitates the use of enzymes as biocatalysts in non-aqueous media,e.g.when it is necessary to dissolve or recover substrates or products in an organic phase, to decrease unwanted substrate or product inhibition(Hun et al., 2003),or when the product itself is an organic compound(e.g. methanol in the production of biodiesel)(Li et al.,2012).Our results indicate that for many of the compounds tested,mutant L3-3retains a comparable or higher relative activity than the parent enzymes,and therefore has improved characteristics as a possible biocatalyst.With respect to substrate specificity,L3-3remains a true lipase,with the highest activity observed for long chain tria-cylglycerol fatty acids,like the parent enzymes L5and L21.The significant stimulating effect of the presence of(10mM) FeCl2,CoCl2or CuCl2on L3-3is remarkable,since many lipases are inhibited by these metal salts(Gaur et al.,2008;Nthangeni et al.,2001;Sharma et al.,2001).The minimal effect of the metal-chelating agent EDTA on the activity of the parent enzymes and L3-3suggests that no metal binding sites exist,in agreement with previous studies.The strong inhibition by PMSF confirms that the enzymes under study are of the serine hydrolase class.Secondly, the tolerance of L3-3to detergents is comparable to or slightly bet-ter than that of the parent enzymes.Notably,the higher retained activity of L3-3in the presence of0.1%SDS compared to the parent enzymes,indicates that it is more resistant to unfolding.Thirdly,128N.Akbulut et al./Journal of Biotechnology164 (2013) 123–129the higher retained activity of L3-3for most organic solvents when compared to the parents indicates an increased tolerance to such compounds.Surprisingly,although we screened for activity as the desired property to be increased,L3-3also displays a remarkable increase in thermostability.Its half-life(T1/2)at50◦C of38.5min is a9.2-and8.8-fold improvement with respect to the parent enzymes. This is also reflected by a higher resistance to thermal inactivation: 70%of the initial activity of L3-3is retained after a30min incuba-tion at50◦C,a2.5-and3.7-fold increase compared to the parent enzymes(Fig.2).The fact that we obtained a mutant with both increased thermostability and activity indicates that it is possible to improve these properties at the same time.A similar case has been reported for Candida antarctica lipase B(Suen et al.,2004);there-fore a‘dual’screening approach involving both thermostability and activity may be generally beneficial for the directed evolution of lipase enzymes.In addition,further improvement of thermosta-bility and activity may be obtained by increasing the number of DNA-shuffling cycles.4.2.Structural implicationsIt has been proposed that several sequence/structural features contribute to the greater stability of thermophilic proteins(Kumar et al.,2000).These features include packing(of the core struc-ture),polar surface area,helical content/propensity,salt bridge and other hydrogen bond interactions,proline substitutions,insertions or deletions,loop stabilization and protein oligomerization.In the case of the B.pumilus L3-3mutant,the basis of enhanced thermosta-bility and activity(with respect to the parent enzymes)must lie, in one way or another,in the chimeric differences and point muta-tions.To study their structural effects,we constructed3D homology models for the B.pumilus L5and L21parent lipases and mutant L3-3(Figs.3and4),based on the crystal structure of B.subtilis lipase A(van Pouderoyen et al.,2001).Given the high sequence identity (78%)between the B.pumilus lipases and the B.subtili lipase A,and the nature and distribution of the about40differences between them,the homology models can be regarded as fairly reliable with an estimated root mean square deviation for backbone atoms of 0.6˚A(Chothia and Lesk,1986).Even in regions where differences are concentrated(mostly in loops and310helices),the main chain need hardly be affected because most of the differences are at the surface.In only one case(residue S14in L3-3)the model was man-ually adjusted to a more favorable side chain rotamer.Three of the six differences between mutant L3-3and parent L5occur in the3-1/␣A loop(residues10–15,Fig.4a),which forms one‘wall’of a narrow hydrophobic substrate binding cleft (Dröge et al.,2006).Both the chimeric I12M difference and A15G point mutation result in a reduced surface hydrophobicity,which may contribute to an increase in thermostability of L3-3.A similar proposal has been made for the A15S mutation in B.subtilis lipase A mutants3-3A9,4D3and6B(Ahmad et al.,2008;Kamal et al., 2011).The third difference,G14S,is thefirst reported mutation at this position for a family I.4lipase.The introduction of the serine side chain may increase thermostability by facilitating an addi-tional intra-loop hydrogen bond interaction with residue G11.This interaction would stabilize the conformation of the3-1/␣A loop, counteracting theflexibility-increasing effect of the introduction of a third glycine in this loop(mutation A15G).Together,the ther-mostability enhancing effects of mutations in the3-1/␣A loop may be attributed to a combination of reduced surface hydropho-bicity and stabilization of loop conformation.The observed enhanced activity of L3-3on p NP-palmitate as a substrate most likely stems from the G14S and I12M mutations in the substrate binding cleft.In the complexes of B.subtilis lipase A with different phosphonate inhibitors(Dröge et al.,2006)(PDB IDs:1R4Z,1R50),the IPG moiety of the inhibitor binds in a nar-row hydrophobic groove between residues I12-G13-G14(in the 3-1/␣A loop)and H156-I157.The importance of residues in the 3-1/␣A loop of B.subtilis lipase A has been shown previously in a loop-grafting study(Boersma et al.,2008),where enantioselectiv-ity toward IPG esters could be inversed by replacing this loop with loops originating from other␣/-hydrolases.A superposition(not shown)of L3-3with B.subtilis lipase A reveals that in L3-3the p NP moiety of the substrate would occupy the same space as the IPG moiety in B.subtilis lipase A.The side chain of a serine residue at position14would point into the binding groove and could interact with the substrate.The increased polarity of the environment of the scissile bond may favorably affect the hydrolysis of the cova-lent tetrahedral reaction intermediate.This reaction intermediate is stabilized by two peptide NH groups(the oxyanion hole)formed by residues12and78(Jaeger et al.,1999).Thus,the I12M and G14S mutations may affect both substrate affinity and reaction kinetics, apparently leading to a more active enzyme.On the other hand, substrate specificity is hardly affected(Supplementary Material Fig. S8).In contrast to the above mentioned mutations,point mutation V109S and the chimeric differences F20A and I169V,located at distances between12and16˚A from the active site serine,likely will not affect the activity of L3-3,at least not through short range effects.Instead,the F20A and V109S mutations appear to increase thermostability by reducing surface hydrophobicity,or by stabi-lizing interactions that are absent in the parent enzymes.Like in B.subtilis lipase A,two hydrogen bonds can link S109(T109in lipase A)to N48on helix␣B and to A81on helix␣C,thereby anchoring this part of the long109–123loop to the core secondary structure elements.The S109-N48hydrogen bond interaction also fixes the N-terminal end of the long␣B helix(Fig.4b),which has only one other hydrogen bond interaction(S56-D91).Likely, the stabilizing interactions due to the V109S mutation result in a more rigid enzyme structure,in agreement with the observa-tion that the L3-3mutant is more resistant to unfolding by SDS. Together with the removal of a solvent-exposed non-polar phenyl or methyl group of residues20and109,respectively,this results in enhanced thermostability.Finally,the I169V difference may affect thermostability by slightly changing the interior hydrophobic pack-ing of the enzyme.5.ConclusionsTo the best of our knowledge,our study describes thefirst application of DNA-shuffling to lipases from B.pumilus.From a single round of DNA-shuffling with two B.pumilus parent lipases, we have obtained a chimeric mutant(L3-3)with an up to8-fold increased specific activity and a9-fold increased half-life(at50◦C). The increased tolerance of L3-3to various detergents and organic solvents further enhances its application possibilities as a biocat-alyst.Based on a reliable homology model,we conclude that the observed enhancement of thermostability of L3-3is likely the con-sequence of(a)rigidification of enzyme structure by strengthening (hydrogen bonding)interactions between structural elements,and (b)the removal of hydrophobic patches on the enzyme surface (A15G,F20A,V109S).The same factors have been proposed to account for increased thermostability of evolved B.subtilis lipase A mutants(Ahmad et al.,2008;Kamal et al.,2011).The effect on enzyme activity is likely due to the fact that three of the six differences between mutant L3-3and parent L5(I12M,G14S,A15G) are in a loop adjacent to the substrate-binding site.These mutations may affect substrate binding and increase the reaction rate for the hydrolysis of the covalent reaction intermediate,but do not alter the substrate specificity.Although synergistic effects of mutations。
Progress in the eukaryotic cell cycle is driven by oscillations(振动) in the activities of CDKs(Cyclin-Dependent Kinases). CDK activity is controlled by periodic synthesis(周期复合体)and degradation of positive regulatory subunits(调节亚基), Cyclins, as well as by fluctuations in levels of negative regulators, by CKIs (CDK Inhibitors), and by reversible phosphorylation. The mammalian cell cycle consists of four discrete phases: S-phase, in which DNA is replicated; M-phase, in which the chromosomes are separated over two new nuclei in the process of mitosis. These two phases are separated by two so called “Gap” phases, G1 and G2, in which the cell prepares for the upcoming events of S and M, respectively (Ref.1). The different Cyclins, specific for the G1-, S-, or M-phases of the cell cycle, accumulate and activate CDKs at the appropriate times during the cell cycle and then are degraded, causing kinase inactivation. Levels of some CKIs, which specifically inhibit certain Cyclin/CDK complexes, also rise and fall at specific times during the cell cycle (Ref.2). A breakdown in the regulation of this cycle leads to uncontrolled growth and contribute to tumor formation. Defects in many of the molecules that regulate the cell cycle also lead to tumor progression. Key among these are p53, the CKIs (p15 (INK4B), p16 (INK4A), p18 (INK4C), p19 (INK4D), p21, p27 (KIP1)), and Rb (Retinoblastoma Susceptibility Protein), all of which act to keep the cell cycle from progressing until all repairs to damaged DNA have been completed.In mammalian cells, different Cyclin-CDK complexes are involved in regulating different cell cycle transitions: Cyclin-D -CDK4/6 for G1 progression, Cyclin-E -CDK2 for the G1-S transition, Cyclin-A-CDK2 for S-phase progression, and Cyclin-A/B-CDC2 for entry into M-phase. Apart from thesewell-known roles in the cell cycle, several Cyclins and CDKs are involved in processes not directly related to the cell cycle. Cyclin-D binds and activates the estrogen receptor. (Ref.6). The Cyclin-H -CDK7 complex is a component of both the CDK-activating kinase and the basal transcription factor TFIIH and can phosphorylate CDKs. Other Cyclins and CDKs (Cyclin-C-CDK8, Cyclin-T-CDK9, and Cyclin-K) are also associated with RNA Polymerase-II and phosphorylate the carboxyl-terminal repeat domain.Cyclin-G, a target of p53, recruits PP2A (Protein Phosphatase 2A) to dephosphorylate MDM2 (Mouse Double Minute 2) (Ref.3).Cyclins associate with CDKs to regulate their activity and the progression of the cell cycle through specific checkpoints. Disruption of Cyclin action leads to either cell cycle arrest, or to uncontrolled cell cycle proliferation. Mitogenic signals that are received by cell surface receptors communicate to the nuclear cell cycle machinery to induce cell division through growth factor receptors that target Ras, which signals to a number of cytoplasmic signaling cascades such as PI3K (Phosphatidylinositiol–3 Kinase), Raf and Rho. These proteins connect to the nuclear cell cycle machinery to mediate exit from Go into G1 and S-phase of the cell cycle. Activation of Ras leads to transcriptional induction of Cyclin-D1 in early G1 through a Ras-responsive element in the Cyclin-D1 gene promoter. Cyclin-D associates with CDK4 and CDK6 to form active Cyclin-D/CDK4 (or -6) complexes. This complex is responsible for the first phosphorylation of tumor suppressor Rb in G1 (Ref.1). Subsequently, Cyclin-E is synthesized. When Cyclin-E is abundant it interacts with the cell cycle checkpoint kinase CDK2 and allow progression of the cell cycle from G1 to S-phase. One of the key targets of activated CDK2 complexed with Cyclin-E is Rb. When dephosphorylated in G1, Rb complexes with and blocks transcriptional activation by E2F transcription factors. But when CDK2/Cyclin-E phosphorylates Rb, it dissociates from E2F, allowing E2F to activate the transcription of genes required for S-phase. E2F activity consists of a heterodimeric complex of an E2F polypeptide and a DP1 protein (Ref.5). One of the genes activated by E2F is Cyclin-E itself, leading to a positive feedback cycle as Cyclin-E accumulates. In S-phase, Cyclin-A is made, whichin complex with DK2 adds further phosphates to Rb. Cyclin-B is made in G2 and M-phases of the cellcycle (Ref.4). It combines with CDK1 (also called CDC2 or CDC28) to form the major mitotic kinase MPF (M-phase Promoting Factor). MPF causes entry of cells into mitosis and, after a lag, activates the system that degrades its Cyclin subunit. MPF inactivation, caused by the degradation of Cyclin-B, is required forexit from mitosis (Ref.2). 14-3-3s bind to the phosphorylated CDC2–Cyclin-B kinase and exports it fromthe nucleus. During G2-phase, CDC2 is maintained in an inactive state by the kinases Wee1 and Myt1 (Myelin Transcription Factor 1). As cells approach M-phase, the phosphatase CDC25 is activated by PLK (Polo-Like Kinase). CDC25 then activates CDC2, establishing a feedback amplification loop thatefficiently drives the cell into mitosis.All Cyclins are degraded by ubiquitin-mediated processes, and the mode by which these systems are connected to the cell-cycle regulatory phosphorylation network, are different for mitotic and G1 Cyclins (Ref.2). The decision by the cell to either remain in G1 or progress into S-phase is the result in part of the balance between Cyclin-E production and proteolytic degradation in the proteosome. Cyclin-E is targetedfor destruction by the proteosome through ubiquitination when associated with a complex of proteinscalled the SCF or F box complex. During G1-phase, the Rb-HDACs (Histone Deacetylases) repressor complex binds to the E2F-DP1 transcription factors, inhibiting the downstream transcription. Manydifferent stimuli exert checkpoint control including TGF-Beta, DNA damage, contact inhibition, replicative senescence and growth factor withdrawal. The first four act by inducing members of the INK4A family orKIP/CIP families of cell cycle kinase inhibitors. TGF-Beta additionally inhibits the transcription of CDC25A,a phosphatase that activates the cell cycle kinases. DNA damage activates the DNA-PK/ATM/ATR kinases, initiating cascades that inactivate CDC2–Cyclin-B.Both synthesis and destruction of Cyclins are important for cell cycle progression. The destruction of Cyclin-B by Anaphase-Promoting Complex/cyclosome is essential for metaphase-anaphase transition, and expression of indestructible Cyclin-B traps cells in mitosis (Ref.3). Cyclins-E and A have been implicated in the DNA replication initiation process in mammalian cells. In embryonic systems, Cyclin-E regulates replication in the absence of Cyclin-A. For centrosome duplication, in somatic cells Cyclin-A is required to induce DNA replication and it has also been implicated in activation of DNA synthesis, because of its appearance time relative to the onset time of DNA synthesis and its localization to sites of nuclear DNA replication. Cyclin-E regulates the transcription of genes that encode the replication machinery but has also been implicated in the initiation process in mammalian cells (Ref.1). Similarly, expression of indestructible Cyclin-A arrests cells in late mitosis. Overexpression of Cyclin-F also causes an accumulation of the G2/M (Ref.3).。
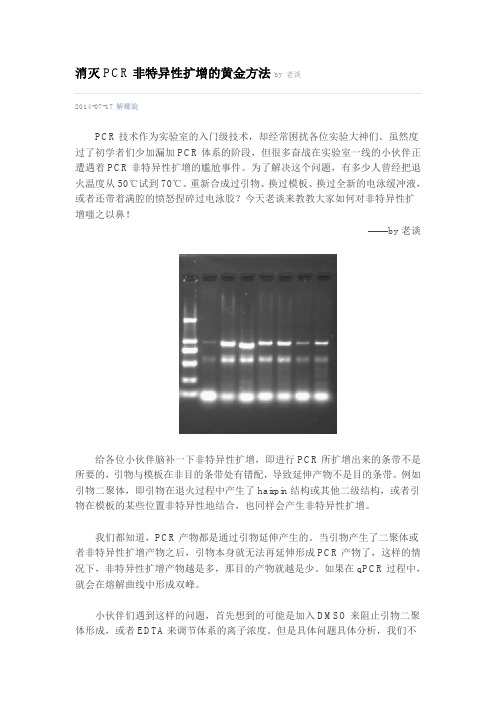
消灭PCR非特异性扩增的黄金方法by 老谈2014-07-17解螺旋PCR技术作为实验室的入门级技术,却经常困扰各位实验大神们。
虽然度过了初学者们少加漏加PCR体系的阶段,但很多奋战在实验室一线的小伙伴正遭遇着PCR非特异性扩增的尴尬事件。
为了解决这个问题,有多少人曾经把退火温度从50℃试到70℃、重新合成过引物、换过模板、换过全新的电泳缓冲液,或者还带着满腔的愤怒捏碎过电泳胶?今天老谈来教教大家如何对非特异性扩增嗤之以鼻!——by老谈给各位小伙伴脑补一下非特异性扩增,即进行PCR所扩增出来的条带不是所要的,引物与模板在非目的条带处有错配,导致延伸产物不是目的条带。
例如引物二聚体,即引物在退火过程中产生了hairpin结构或其他二级结构,或者引物在模板的某些位置非特异性地结合,也同样会产生非特异性扩增。
我们都知道,PCR产物都是通过引物延伸产生的。
当引物产生了二聚体或者非特异性扩增产物之后,引物本身就无法再延伸形成PCR产物了,这样的情况下,非特异性扩增产物越是多,那目的产物就越是少。
如果在qPCR过程中,就会在熔解曲线中形成双峰。
小伙伴们遇到这样的问题,首先想到的可能是加入DMSO来阻止引物二聚体形成,或者EDTA来调节体系的离子浓度。
但是具体问题具体分析,我们不能病急乱投医,这里老谈给小伙伴们整理了解决方法,希望可以帮助大家快速、准确的搞定这个“小问题”。
1、引物设计的过程中要用Primer premier 5.0来验证一下二聚体;2、引物合成后,先做一次梯度PCR,检测最合适的退火温度,一般高退火温度可以提高引物对模板的特异性从而降低引物二聚体;3、降低Mg2+浓度,镁离子浓度高,会导致大量的非特异性扩增,但是没有镁离子的话,也会导致Taq酶的失活;4、降低dNTP浓度,dNTP也是非特异性扩增的一个罪魁祸首,降低它的浓度,也能有效降低二聚体及其他非特异性扩增;5、降低引物浓度,一般的PCR引物都是过量的,降低了引物浓度自然也能降低引物之间形成二级结构的可能性;6、提高退火温度,这个道理很简单,引物的退火温度提高,引物间的二级结构形成可能性就会降低;7、延长退火时间,这个也可以减弱引物间结合的可能性;8、DMSO及甜菜碱,这些PCR促进剂,主要是用于CG含量高的模板上,降低DNA的二级结构的产生,但根据经验,加入DMSO之后需要同时提高一点退火温度来补平(qPCR不太适用);9、热启动法,通过95℃的高温热启动,高温解链,使得引物间的二级结构破坏,以此降低二聚体产生。

高三英语植物遗传修饰单选题50题1. The process of plant genetic modification often involves ____ genes from one organism to another.A. transferringB. transformingC. transmittingD. transplanting答案:A。
解析:本题考查与植物遗传修饰相关的动词辨析。
A选项transferring有转移、传递( 尤指将某物从一个地方、人或事物转移到另一个地方、人或事物)的意思,在植物遗传修饰中,经常涉及将基因从一个生物体转移到另一个生物体,符合概念。
B选项transforming主要表示改变、转变,强调的是形态、性质等方面的彻底改变,而不是基因的转移这个概念。
C选项transmitting侧重于传播、传送( 信号、信息等),不太适用于基因的操作。
D选项transplanting 主要指移植 器官、植物等),通常是比较宏观的物体,与基因的操作不符。
2. In plant genetic modification, a ____ is a small circular piece of DNA that can be used to carry new genes into a plant cell.A. plasmidB. plastidC. plasmodiumD. plasma答案:A。
解析:A选项plasmid(质粒)在植物遗传修饰中是一种小的环状DNA,可以用来携带新基因进入植物细胞,这是植物遗传修饰中重要的工具。
B选项plastid(质体)是植物细胞中的一种细胞器,与携带基因进入细胞的概念不同。
C选项plasmodium( 疟原虫)与植物遗传修饰毫无关系。
D选项plasma(血浆、等离子体)也与植物遗传修饰概念不相关。
3. Which of the following is a common method for plant genetic modification?A. Cross - breedingB. Mutation breedingC. Gene editingD. All of the above答案:D。

chemical-reaction-engineeri ng(答案)Corresponding Solutions for Chemical Reaction EngineeringCHAPTER 1 OVERVIEW OF CHEMICAL REACTION ENGINEERING (1)CHAPTER 2 KINETICS OF HOMOGENEOUS REACTIONS (3)CHAPTER 3 INTERPRETATION OF BATCH REACTOR DATA (7)CHAPTER 4 INTRODUCTION TO REACTOR DESIGN (20)CHAPTER 5 IDEAL REACTOR FOR A SINGLE REACTOR (23)CHAPTER 6 DESIGN FOR SINGLE REACTIONS (27)CHAPTER 10 CHOOSING THE RIGHT KIND OF REACTOR (34)CHAPTER 11 BASICS OF NON-IDEAL FLOW (36)CHAPTER 18 SOLID CATALYZED REACTIONS (45)Chapter 1 Overview of Chemical Reaction Engineering1.1 Municipal waste water treatment plant. Consider a municipal water treatment plant for a small community (Fig.P1.1). Waste water, 32000 m 3/day, flows through the treatment plant with a mean residence time of 8 hr, air is bubbled through the tanks, and microbes in the tank attack and break down the organic material(organic waste) +O 2 −−−→−microbesCO 2 + H 2OA typical entering feed has a BOD (biological oxygen demand) of 200 mg O 2/liter, while the effluent has a megligible BOD. Find the rate of reaction, or decrease in BOD in the treatment tanks.Figure P1.1Solution:)/(1017.2)/(75.183132/100010001)0200()(313200031320001343333s m mol day m mol day molgm L mg g L mg day day m dayday m VdtdN r A A ⋅⨯=⋅=-⨯⨯⨯-⨯-=-=--1.2 Coal burning electrical power station. Large central power stations (about 1000 MW electrical) using fluiding bed combustors may be built some day (see Fig.P1.2). These giants would be fed 240 tons of coal/hr (90% C, 10%H 2), 50% of which would burn within the battery of primary fluidized beds, the other 50% elsewhere in the system. One suggested design would use a battery of 10 fluidized beds, each 20 m long, 4 m wide, and containing solids to a depth of 1 m. Find the rate of reaction within theWaste Waste Clean200 mgMean residen Zerobeds, based on the oxygen used.Solution:380010)1420(m V =⨯⨯⨯=)/(9000101089.05.01024033hr bed molc hr kgckgcoal kgc hr coal t N c ⋅-=⨯-=⨯⨯⨯-=∆∆ )/(25.111900080011322hr m kmolO t N V r r c c O ⋅=-⨯-=∆∆-=-=)/(12000412000190002hr bed mol dt dO ⋅=+⨯= )/(17.4800)/(105.113422s m mol hr bed mol dt dO V r O ⋅=⋅⨯==-Chapter 2 Kinetics of Homogeneous Reactions2.1 A reaction has the stoichiometric equation A + B =2R . What is the order of reaction?Solution: Because we don’t know whether it is an elementary reaction or not, we can’t tell the index of the reaction.2.2 Given the reaction 2NO 2 + 1/2 O 2 = N 2O 5 , what is the relation between the ratesof formation and disappearance of the three reaction components? Solution: 522224O N O NO r r r =-=-2.3 A reaction with stoichiometric equation 0.5 A + B = R +0.5 S has the following rateexpression-r A = 2 C0.5 AC BWhat is the rate expression for this reaction if the stoichiometric equation is written asA + 2B = 2R + SSolution: No change. The stoichiometric equation can’t effect the rate equation, so it doesn’t change.2.4 For the enzyme-substrate reaction of Example 2, the rate of disappearance ofsubstrate is given by-r A =A06]][[1760C E A + , mol/m 3·sWhat are the units of the two constants? Solution: ][]6[]][][[][03A A C E A k s m mol r +=⋅=- 3/][]6[m mol C A ==∴sm mol m mol m mol s m mol k 1)/)(/(/][3333=⋅⋅=2.5 For the complex reaction with stoichiometry A + 3B → 2R + S and withsecond-order rate expression-r A = k 1[A][B]are the reaction rates related as follows: r A = r B = r R ? If the rates are not so related, then how are they related? Please account for the sings , + or - .Solution: R B A r r r 2131=-=-2.6 A certain reaction has a rate given by-r A = 0.005 C2 A , mol/cm 3·minIf the concentration is to be expressed in mol/liter and time in hours, what wouldbe the value and units of the rate constant?Solution:min)()(3'⋅⨯-=⋅⨯-cm molr hr L mol r A A 22443'300005.0106610)(minA A A A A C C r r cm mol mol hr L r =⨯⨯=⋅⨯=-⋅⋅⋅=-∴ AA A A A C C cmm ol m ol L C cmm olC L m ol C 33'3'10)()(=⋅⋅=∴⨯=⨯2'42'32'103)10(300300)(AA A A C C C r --⨯=⨯==-∴ 4'103-⨯=∴k2.7 For a gas reaction at 400 K the rate is reported as -dtdp A= 3.66 p2 A, atm/hr (a) What are the units of the rate constant?(b) What is the value of the rate constant for this reaction if the rate equation isexpressed as-r A = - dtdN V A1 = k C2 A , mol/m 3·sSolution:(a) The unit of the rate constant is ]/1[hr atm ⋅ (b) dtdN V r AA 1-=-Because it’s a gas reaction occuring at the fined terperatuse, so V=constant, and T=constant, so the equation can be reduced to22)(66.366.3)(1RT C RTP RT dt dP RT dt dP VRT V r A A A A A ==-=-=-22)66.3(AA kC C RT == So we can get that the value of1.12040008205.066.366.3=⨯⨯==RT k2.9 The pyrolysis of ethane proceeds with an activation energy of about 300 kJ/mol.How much faster the decomposition at 650℃ than at 500℃?Solution:586.7)92311731()10/(314.8/300)11(3211212=-⋅⋅=-==KK K mol kJ mol kJ T T R E k k Ln r r Ln7.197012=∴r r2.11 In the mid-nineteenth century the entomologist Henri Fabre noted that French ants (garden variety) busily bustled about their business on hot days but were rather sluggish on cool days. Checking his results with Oregon ants, I findRunning speed, m/hr150160230295370Temperatu re, ℃13 16 22 24 28 What activation energy represents this change in bustliness? Solution:RTE RTERTE ek eak t cons ion concentrat f let ion concentrat f ek r ---=⋅⋅=⋅='00tan )()(RET Lnk Lnr A 1'-=∴ Suppose Tx Lnr y A 1,==, so ,REslope -= intercept 'Lnk =)/(1-⋅h m r A 150 160 230 295 370 A Lnr-3.1780 -3.1135 -2.7506 -2.5017 -2.2752CT o / 13 16 22 24 28 3101-⨯T3.4947 3.4584 3.3881 3.3653 3.3206-y = 5417.9x - 15.686R2 = 0.9712340.00330.003350.00340.003450.00351/T-L n r-y = -5147.9 x + 15.686Also K REslope 9.5147-=-=, intercept 'Lnk == 15.686 , mol kJ K mol J K E /80.42)/(3145.89.5147=⋅⨯-=Chapter 3 Interpretation of Batch Reactor Data3.1 If -r A = - (dC A /dt) =0.2 mol/liter·sec when C A = 1 mol/liter, what is the rate ofreaction when C A = 10 mol/liter? Note: the order of reaction is not known.Solution: Information is not enough, so we can’t answer this kind of question.3.2 Liquid a sedomposes by first-order kinetics, and in a batch reactor 50% of A isconverted in a 5-minute run. How much longer would it take to reach 75% conversion?Solution: Because the decomposition of A is a 1st -order reaction, so we can express the rate equation as:A A kC r =-We know that for 1st -order reaction, kt C C LnAAo=, 11kt C C LnA Ao =, 22kt C CLn A Ao = Ao A C C 5.01=, Ao A C C 25.02=So 21)24(1)(11212Ln kLn Ln k C C Ln C C Ln k t t A Ao A Ao =-=-=- equ(1) min 521)(111===Ln kC C Ln k t A Ao equ(2) So min 5112==-t t t3.3 Repeat the previous problem for second-order kinetics. Solution: We know that for 2nd -order reaction, kt C C A A =-011, So we have two equations as follow:min 511211101k kt C C C C C AoAo Ao A A ===-=-, equ(1)2123)1(31411kt kt C C C C C AoAo Ao Ao A ===-=-, equ(2) So min 15312==t t , min 1012=-t t3.4 A 10-minute experimental run shows that 75% of liquid reactant is converted to product by a 21-order rate. What would be the fraction converted in a half-hour run?Solution: In a-21order reaction: 5.0A A A kC dtdC r =-=-, After integration, we can get:5.015.02A Ao C C kt -=, So we have two equations as follow:min)10(5.0)41(15.05.05.05.015.0k kt C C C C C Ao Ao AoA Ao ===-=-, equ(1) min)30(25.025.0k kt C C A Ao ==-, equ(2)Combining these two equations, we can get:25.05.1kt C Ao =, but this means 05.02<A C , whichis impossible, so we can conclude that less than half hours, all the reactant is consumed up. So the fraction converted 1=A X .3.5 In a hmogeneous isothermal liquid polymerization, 20% of the monomer disappears in 34 minutes for initial monomer concentration of 0.04 and also for 0.8 mol/liter. What rate equation represents the disappearance of the monomer?Solution: The rate of reactant is independent of the initial concentration of monomers, so we know the order of reaction is first-order,m onom er m onom er kC r =- And k C C Lnoomin)34(8.0= 1min 00657.0-=km onom er m onom er C r )min 00657.0(1-=-3.6 After 8 minutes in a batch reactor, reactant (C A0 = 1 mol/liter) is 80% converted; after 18 minutes, conversion is 90%. Find a rate equation to represent this reaction. Solution:In 1st order reaction, 43.1511111111212==--=Ln Ln X Ln k X Ln k t t A A , dissatisfied. In 2nd order reaction, 49/4/912.0111.01)11(1)11(11212==--=--=Ao Ao Ao Ao Ao Ao Ao A Ao A C C C C C C C C k C C k t t, satisfied.According to the information, the reaction is a 2nd -order reaction.3.7 nake-Eyes Magoo is a man of habit. For instance, his Friday evenings are all alike —into the joint with his week’s salary of $180, steady gambling at “2-up” for two hours, then home to his family leaving $45 behind. Snake Eyes’s betting pattern is predictable. He always bets in amounts proportional to his cash at hand, and his losses are also predictable —at a rate proportional to his cash at hand. This week Snake-Eyes received a raise in salary, so he played for three hours, but as usual went home with $135. How much was his raise? Solution:180=Ao n , 13=A n , h t 2=,135'=A n , h t 3;=, A A kn r α-So we obtain kt n n LnAAo=, ''')()(tn n Ln t n n Ln AAo A Ao= 3135213180'Ao n Ln Ln =, 28'=An3.9 The first-order reversible liquid reactionA ↔ R , C A0 = 0.5 mol/liter, C R0=0takes place in a batch reactor. After 8 minutes, conversion of A is 33.3% while equilibrium conversion is 66.7%. Find the equation for the this reaction. Solution: Liquid reaction, which belongs to constant volume system,1st order reversible reaction, according to page56 eq. 53b, we obtain121112102110)(1)(-+-+=+-==⎰⎰AX A A tX k k k k Lnk k X k k k dX dt t Amin 8sec 480==t , 33.0=A X , so we obtain eq(1)33.0)(1min8sec 480211121k k k k Lnk k +-+= eq(1) Ae AeAe c X X M C C k k K -+===1Re 21, 0==AoRo C C M , so we obtain eq(2) 232132121=-=-==AeAe c X X k k K ,212k k =∴ eq(2)Combining eq(1) and eq(2), we obtain1412sec 108.4min 02888.0---⨯==k 14121sec 1063.9min 05776.02---⨯===k kSo the rate equation is )(21A Ao A AA C C k C k dtdC r --=-=- )(sec 1063.9sec 108.401414A A A C C C -⨯-⨯=----3.10 Aqueous A reacts to form R (A→R) and in the first minute in a batch reactor itsconcentration drops from C A0 = 2.03 mol/liter to C Af = 1.97 mol/liter. Find the rate equation from the reaction if the kinetics are second-order with respect to A.Solution: It’s a irreversible second -order reaction system, according to page44 eq 12, we obtainmin 103.2197.111⋅=-k , so min015.01⋅=mol Lkso the rate equation is 21)min 015.0(A A C r -=-3.15 At room temperature sucrose is hydrolyzed by the catalytic action of the enzymesucrase as follows:Aucrose −−→−sucraseproductsStarting with a sucrose concentration C A0 = 1.0 millimol/liter and an enzyme concentrationC E0= 0.01 millimol/liter, the following kinetic data are obtained in a batch reactor (concentrations calculated from optical rotation measurements):Determine whether these data can be reasonably fitted by a knietic equation of the Michaelis-Menten type, or-r A =MA E A C C C C k +03 where C M = Michaelis constantIf the fit is reasonable, evaluate the constants k 3 and C M . Solve by the integral method.Solution: Solve the question by the integral method:AA M A A Eo A A C k Ck C C C C k dt dC r 5431+=+=-=-, MEo C C k k 34=, M C k 15=AAo A AoA Ao C C C C Lnk k k C C t -⋅+=-4451hrt ,AC ,mmol /L A Ao AAo C C C C Ln-AAo C C t -1 0.84 1.0897 6.25 20.681.20526.25C A , millimol /liter0.84 0.68 0.53 0.38 0.27 0.16 0.09 0.04 0.018 0.006 0.0025t,hr 1 2 3 4 5 6 7 8 9 10 113 0.53 1.3508 6.38304 0.38 1.5606 6.45165 0.27 1.7936 6.8493 6 0.16 2.1816 7.14287 0.09 2.6461 7.69238 0.04 3.3530 8.33339 0.018 4.0910 9.1650 10 0.006 5.1469 10.0604 110.00256.006511.0276Suppose y=A Ao C C t-, x=AAo A Ao C C C C Ln-, thus we obtain such straight line graphy = 0.9879x + 5.0497R 2 = 0.99802468101201234567Ln(Cao/Ca)/(Cao-Ca)t /(C a o -C a )9879.0134===Eo M C k C k Slope , intercept=0497.545=k k So )/(1956.00497.59879.015L mmol k C M ===, 14380.1901.09879.01956.0-=⨯==hr C C k k Eo M3.18 Enzyme E catalyzes the transformation of reactant A to product R as follows:A −−→−enzymeR, -r A = min22000⋅+liter molC C C A E AIf we introduce enzyme (C E0 = 0.001 mol/liter) and reactant (C A0 = 10mol/liter) into a batch rector and let the reaction proceed, find the time needed for the concentration of reactant to drop to 0.025 mol/liter. Note that the concentration of enzyme remains unchanged during the reaction.. Solution:510001.020021+=⨯+=-=-AA A A A C C C dC dt r Rearranging and integrating, we obtain:10025.0025.0100)(510)510(⎥⎦⎤⎢⎣⎡-+=+-==⎰⎰A Ao A Ao A A tC C C C Ln dC C dt t min 79.109)(5025.01010=-+=A Ao C C Ln3.20 M.Hellin and J.C. Jungers, Bull. soc. chim. France, 386(1957), present the data in Table P3.20 on thereaction of sulfuric acid with diethylsulfate in a aqueous solution at22.9℃:H 2SO 4 + (C 2H 5)2SO 4 → 2C 2H 5SO 4HInitial concentrations of H 2SO 4 and (C 2H 5)2SO 4 are each 5.5 mol/liter. Find a rate equation for this reaction.Table P3.20 t, minC 2H 5SO 4H , mol/li ter t, minC 2H 5SO 4H , mol/li ter1804.1141 1.18 194 4.31 48 1.38 212 4.45 55 1.63 267 4.86 75 2.24 318 5.15 96 2.75 368 5.32 127 3.31 379 5.35 146 3.76 410 5.42 1623.81∞(5.80)Solution: It’s a constant -volume system, so we can use X A solving the problem: i) We postulate it is a 2nd order reversible reaction system R B A 2⇔+ The rate equation is: 221R B A A A C k C C k dtdC r -=-=- L mol C C Bo Ao /5.5==, )1(A Ao A X C C -=, A A Ao Bo B C X C C C =-=, A Ao R X C C 2= When ∞=t , L mol X C C Ae Ao /8.52Re == So 5273.05.528.5=⨯=Ae X , L mol X C C C Ae Ao Be Ae /6.2)5273.01(5.5)1(=-⨯=-== After integrating, we obtaint C X k X X X X X LnAo AeA Ae A Ae Ae )11(2)12(1-=--- eq (1)The calculating result is presented in following Table.t,mi nLmol C R /,Lmol C A /,AXAAe AAe Ae X X X X X Ln---)12()1(AeAX X Ln -0 0 5.5 0 0 041 1.18 4.91 0.10730.2163 -0.227548 1.38 4.81 0.12540.2587 -0.271755 1.63 4.685 0.14820.3145 -0.329975 2.24 4.38 0.20360.4668 -0.488196 2.75 4.125 0.25 0.6165 -0.642712 7 3.31 3.8450.30090.8140 -0.845614 6 3.76 3.620.34181.0089 -1.044916 2 3.81 3.5950.34641.0332 -1.069718 0 4.11 3.4450.37361.1937 -1.233119 4 4.31 3.3450.39181.3177 -1.359121 2 4.45 3.2750.40451.4150 -1.4578267 4.86 3.07 0.4418 1.7730 -1.8197 318 5.15 2.925 0.4682 2.1390 -2.1886 368 5.32 2.84 0.4836 2.4405 -2.4918 379 5.35 2.825 0.4864 2.5047 -2.5564 4105.42 2.79 0.4927 2.6731 -2.7254 ∞5.82.60.5273——Draw AAe AAe Ae X X X X X Ln---)12(~ t plot, we obtain a straight line:y = 0.0067x - 0.0276R 2= 0.998800.511.522.530100200300400500tL n0067.0)11(21=-=Ao AeC X k Slope ,min)/(10794.65.5)15273.01(20067.041⋅⨯=⨯-=∴-mol L kWhen approach to equilibrium, BeAe c C C C k k K 2Re 21==, so min)/(10364.18.56.210794.642242Re 12⋅⨯=⨯⨯==--mol L C C C k k Be Ae So the rate equation ismin)/()10364.110794.6(244⋅⨯-⨯=---L mol C C C r R B A Aii) We postulate it is a 1st order reversible reaction system, so the rate equation isR A AA C k C k dtdC r 21-=-=- After rearranging and integrating, we obtaint k X X X Ln AeAe A '11)1(=-eq (2) Draw )1(AeAX X Ln -~ t plot, we obtain another straight line: -y = 0.0068x - 0.0156R 2 = 0.998600.511.522.530100200300400500x-L n0068.0'1-==AeX k Slope ,So 13'1min 10586.35273.00068.0--⨯-=⨯-=k133Re '1'2min 10607.18.56.210586.3---⨯-=⨯⨯-==C C k k AeSo the rate equation ismin)/()10607.110586.3(33⋅⨯+⨯-=---L mol C C r R A AWe find that this reaction corresponds to both a 1st and 2nd order reversible reaction system, by comparing eq.(1) and eq.(2), especially when X Ae =0.5 , the two equations are identical. This means these two equations would have almost the same fitness of data when the experiment data of the reaction show that X Ae =0.5.(The data that we use just have X Ae =0.5273 approached to 0.5, so it causes to this.)3.24 In the presence of a homogeneous catalyst of given concentration, aqueous reactant A is converted to product at the following rates, and C A alone determines this rate:C A ,mol/liter1 2 4 6 7 9 12-r A , mol/liter·hr0.06 0.1 0.25 1.0 2.0 1.0 0.5We plan to run this reaction in a batch reactor at the same catelyst concentration as used in getting the above data. Find the time needed to lower the concentration of A from C A0 = 10 mol/liter to C Af = 2 mol/liter.Solution: By using graphical integration method, we obtain that the shaped area is 50 hr.3.31 The thermal decomposition of hydrogen iodide04812162002 4 68 10 12 14Ca-1/Ra2HI → H 2 + I 2is reported by M.Bodenstein [Z.phys.chem.,29,295(1899)] as follows:T,℃ 508427 393 356 283k,cm 3/mol·s0.10590.003100.00058880.9×10-60.942×10-6Find the complete rate equation for this reaction. Use units of joules, moles, cm 3,and seconds.According to Arrhenius’ Law,k = k 0e -E/R Ttransform it,- In(k) = E/R·(1/T) -In(k 0)Drawing the figure of the relationship between k and T as follows:y = 7319.1x - 11.567R 2= 0.987904812160.0010.0020.0030.0041/T-L n (k )From the figure, we getslope = E/R = 7319.1 intercept = - In(k 0) = -11.567E = 60851 J/mol k 0 = 105556 cm 3/mol·sFrom the unit [k] we obtain the thermal decomposition is second-order reaction, so the rate expression is- r A = 105556e -60851/R T ·C A 2Chapter 4 Introduction to Reactor Design4.1 Given a gaseous feed, C A0 = 100, C B0 = 200, A +B→ R + S, X A = 0.8. Find X B ,C A ,C B . Solution: Given a gaseous feed, 100=Ao C , 200=Bo C , S R B A +→+0=A X , find B X , A C , B C0==B A εε, 202.0100)1(=⨯=-=A Ao A X C C4.02008.01001=⨯⨯==Bo A Ao B C X bC X 1206.0200)1(=⨯=-=B Bo B X C C4.2 Given a dilute aqueous feed, C A0 = C B0 =100, A +2B→ R + S, C A = 20. Find X A , X B , C B .Solution: Given a dilute aqueous feed, 100==Bo Ao C C ,S R B A +→+2, 20=A C , find A X , B X , B CAqueous reaction system, so 0==B A εε When 0=A X , 200=V When 1=A X , 100=VSo 21-=A ε, 41-==Ao Bo A B bC C εε8.01002011=-=-=Ao A A C C X , 16.11008.010012>=⨯⨯=⋅=Bo A Ao B C X C a b X , which is impossible. So 1=B X , 100==Bo B C C4.3 Given a gaseous feed, C A0 =200, C B0 =100, A +B→ R, C A = 50. Find X A , X B , C B . Solution: Given a gaseous feed, 200=Ao C , 100=Bo C ,R B A →+, 50=A C .find A X , B X , B C75.02005011=-=-=Ao A A C C X , 15.1>==BoAAo B C X bC X , which is impossible. So 100==Bo B C C4.4 Given a gaseous feed, C A0 = C B0 =100, A +2B→ R, C B = 20. Find X A , X B , C A . Solution: Given a gaseous feed, 100=+Bo Ao C C ,R B A →+2, 20=Bo C , Find A X , B X , A C0=B X , 200100100=+=B A V ,1=B X 15010050=+=R A V25.0200200150-=-=B ε, 5.01002110025.0-=⨯⨯-=-A ε842.02025.010020100=⨯--=B X , 421.0100842.010021=⨯⨯=A X34.73421.05.01421.0110011=⨯--⨯=+-=A A A Ao A X X C C ε4.6 Given a gaseous feed, T 0 =1000 K, π0=5atm, C A0=100, C B0=200, A +B→5R,T =400K, π=4atm, C A =20. Find X A , X B , C B .Solution: Given a gaseous feed, K T o 1000=, atm 50=π, 100=Ao C , 200=Bo CR B A 5→+, K T 400=, atm 4=π, 20=A C , find A X , B X , B C .1300300600=-=A ε, 2==Ao Bo AB bC C a εε, 5.041000540000=⨯⨯=ππT TAccording to eq page 87,818.05.010020115.0100201110000=⨯⨯+⨯-=+-=ππεππT T C C T T C C X Ao A AAo A A409.0200818.0100=⨯==Bo A Ao B aC X bC X130818.011200)818.0100200(1)(0=⨯+⨯-=+-=A A Ao A Ao Bo B X C T T X a b C C C εππ4.7 A Commercial Popcorn Popping Popcorn Popper. We are constructing a 1-literpopcorn to be operatedin steady flow. First tests in this unit show that 1 liter/min of raw corn feed stream produces 28 liter/minof mixed exit stream. Independent tests show that when raw corn pops its volumegoes from 1 to 31.With this information determine what fraction of raw corn is popped in the unit.Solution: 301131=-=A ε, ..1u a C Ao =, ..281281u a C C Ao A == %5.462813012811=⨯+-=+-=∴AA Ao A Ao A C C C C X εChapter 5 Ideal Reactor for a single Reactor5.1 Consider a gas-phase reaction 2A → R + 2S with unknown kinetics. If a spacevelocity of 1/min is needed for 90% conversion of A in a plug flow reactor, find the corresponding space-time and mean residence time or holding time of fluid in the plug flow reactor.Solution: min 11==sτ,Varying volume system, so t can’t be found.5.2 In an isothermal batch reactor 70% of a liquid reactant is converted in 13 min.What space-time and space-velocity are needed to effect this conversion in a plug flow reactor and in a mixed flow reactor? Solution: Liquid reaction system, so 0=A ε According to eq.4 on page 92, min 130=-=⎰AX AAAo r dC C t Eq.13, AAAo A A Ao R F M r X C r C C -=--=..τ, R F M ..τ can’t be certain. Eq.17, ⎰-=AX AAAo R F P r dX C 0..τ, so min 13...==R B R F P t τ5.4 We plan to replace our present mixed flow reactor with one having double thebolume. For the same aqueous feed (10 mol A/liter) and the same feed rate find the new conversion. The reaction are represented byA → R, -r A = kC1.5 ASolution: Liquid reaction system, so 0=A εA A Ao Ao r X C F V -==τ, 5.1)]1([)(A Ao A A Ao A Ao X C k X r C C C -=-- Now we know: V V 2=', Ao Ao F F =', Ao Ao C C =', 7.0=A XSo we obtain5.15.15.15.1)1()2)1(2A Ao A A Ao A Ao Ao X kC X X kC X F VF V -='-'==''52.8)7.01(7.02)1(5.15.1=-⨯='-'∴A AX X794.0='A X5.5 An aqueous feed of A and B (400liter/min, 100 mmol A/liter, 200 mmol B/liter) isto be converted to product in a plug flow reactor. The kinetics of the reaction is represented byA +B→ R, -r A = 200C A C Bmin⋅liter molFind the volume of reactor needed for 99.9% conversion of A to product.Solution: Aqueous reaction system, so 0=A εAccording to page 102 eq.19, ⎰⎰-=-==A f A fX AAX A A AoAo Ao r dX r dC C C t F V 001⎰-==A fX AAAo or dX C Vντ, min /400liter o =ν, L r dX r dX C V AAX A A o Ao A f3.1244001.0999.000=-⨯=-=∴⎰⎰ν5.9 A specific enzyme acts as catalyst in the fermentation of reactant A. At a givenenzyme concentration in the aqueous feed stream (25 liter/min) find the volume of plug flow reactor needed for 95% conversion of reactant A (C A0 =2 mol/liter ). The kinetics of the fermentation at this enzyme concentration is given byA −−→−enzymeR , -r A = litermolC C A A ⋅+min 5.011.0Solution: P.F.R, according to page 102 eq.18, aqueous reaction, 0=ε⎰-=A X AAAo r dX F V 0 )11(21251.05.010A AX A A A Ao X X Ln dX C C F V A+-⨯=+=∴⎰\L Ln4.986)95.005.01(125=+=5.11 Enzyme E catalyses the fermentation of substrate A (the reactant) to product R.Find the size of mixed flow reactor needed for 95% conversion of reactant in a feed stream (25 liter/min ) of reactant (2 mol/liter) and enzyme. The kinetics of the fermentation at this enzyme concentration are given byA −−→−enzymeR , -r A = litermolC C A A ⋅+min 5.011.0Solution: min /25L o =ν, L mol C Ao /2=, min /50mol F Ao =, 95.0=A X Constant volume system, M.F.R., so we obtainmin 5.199205.05.01205.01.095.02=⨯⨯+⨯⨯⨯=-==AAAo or X C Vντ,39875.4min /25min 5.199m L V o =⨯==τν5.14 A stream of pure gaseous reactant A (C A0 = 660 mmol/liter) enters a plug flowreactor at a flow rate of F A0 = 540 mmol/min and polymerizes the as follows3A → R, -r A = 54min⋅liter mmolHow large a reactor is needed to lower the concentration of A in the exitstream to C Af = 330 mmol/liter?Solution: 321131-=-=A ε, 75.0660330321660330111=⨯--=+-=Ao A A Ao A A C C C C X ε 0-order homogeneous reaction, according to page 103 eq.20A Ao AoAooX C F VC kVkk ===ντ So we obtainL X k C C F V A Ao Ao Ao 5.75475.05401=⨯==5.16 Gaseous reactant A decomposes as follows:A → 3 R, -r A = (0.6min -1)C AFind the conversion of A in a 50% A – 50% inert feed (υ0 = 180 liter/min, C A0 =300 mmol/liter) to a 1 m 3 mixed flow reactor.Solution: 31m V =, M.F.R. 1224=-=A ε According to page 91 eq.11, AAAoAAo AAAo oX X C X C r X C V+-=-==116.0ντmin/1801000)1(6.0)1(L LX X X A A A =-+= So we obtain 667.0=A XChapter 6 Design for Single Reactions6.1 A liquid reactant stream (1 mol/liter) passes through two mixed flow reactors in aseries. The concentration of A in the exit of the first reactor is 0.5 mol/liter. Find the concentration in the exit stream of the second reactor. The reaction is second-order with respect to A and V 2/V 1 =2.Solution:V 2/V 1 = 2, τ1 =011υV =A A A r C C --10 , 2τ = 022υV= 221A A A r C C --C A0=1mol/l , C A1=0.5mol/l , 0201υυ=, -r A1=kC2 A1 ,-r A2=kC2 A2 (2nd-order) , 2×2110A A A kC C C -=2221A A A kC C C -So we obtain 2×(1-0.5)/(k0.52)=(0.5-C A2)/(kC A22)C A2= 0.25 mol/l6.2 Water containing a short-lived radioactive species flows continuously through awell-mixed holdup tank. This gives time for the radioactive material to decay into harmless waste. As it now operates, the activity of the exit stream is 1/7 of the feed stream . This is not bad, but we’d like to lower it still more.One of our office secretaries suggests that we insert a baffle down the middle ofthe tank so that the holdup tank acts as two well-mixed tanks in series. Do you think this would help? If not, tell why; if so calculate the expected activity of the exit stream compared to the entering stream.Solution: 1st-order reaction, constant volume system. From the information offeredabout the first reaction,we obtain1τ=01100117171A A A A A A C k C C kC C C V ⋅-=-=υ If a baffle is added,022220212122212υυτττV V +=+==011υV =2222221210A A A A A A kC C C kC C C -+-=007176A A kC C =6/k …… ①。

New1H-Pyrazole-Containing Polyamine Receptors Able ToComplex L-Glutamate in Water at Physiological pH ValuesCarlos Miranda,†Francisco Escartı´,‡Laurent Lamarque,†Marı´a J.R.Yunta,§Pilar Navarro,*,†Enrique Garcı´a-Espan˜a,*,‡and M.Luisa Jimeno†Contribution from the Instituto de Quı´mica Me´dica,Centro de Quı´mica Orga´nica Manuel Lora Tamayo,CSIC,C/Juan de la Cier V a3,28006Madrid,Spain,Departamento de Quı´mica Inorga´nica,Facultad de Quı´mica,Uni V ersidad de Valencia,c/Doctor Moliner50, 46100Burjassot(Valencia),Spain,and Departamento de Quı´mica Orga´nica,Facultad deQuı´mica,Uni V ersidad Complutense de Madrid,A V plutense s/n,28040Madrid,SpainReceived April16,2003;E-mail:enrique.garcia-es@uv.esAbstract:The interaction of the pyrazole-containing macrocyclic receptors3,6,9,12,13,16,19,22,25,26-decaazatricyclo-[22.2.1.111,14]-octacosa-1(27),11,14(28),24-tetraene1[L1],13,26-dibenzyl-3,6,9,12,13,16,-19,22,25,26-decaazatricyclo-[22.2.1.111,14]-octacosa-1(27),11,14(28),24-tetraene2[L2],3,9,12,13,16,22,-25,26-octaazatricyclo-[22.2.1.111,14]-octacosa-1(27),11,14(28),24-tetraene3[L3],6,19-dibenzyl-3,6,9,12,13,-16,19,22,25,26-decaazatricyclo-[22.2.1.111,14]-octacosa-1(27),11,14(28),24-tetraene4[L4],6,19-diphenethyl-3,6,9,12,13,16,19,22,25,26-decaazatricyclo-[22.2.1.111,14]-octacosa-1(27),11,14(28),24-tetraene5[L5],and 6,19-dioctyl-3,6,9,12,13,16,19,22,25,26-decaazatricyclo-[22.2.1.111,14]-octacosa-1(27),11,14(28),24-tetra-ene6[L6]with L-glutamate in aqueous solution has been studied by potentiometric techniques.The synthesis of receptors3-6[L3-L6]is described for the first time.The potentiometric results show that4[L4]containing benzyl groups in the central nitrogens of the polyamine side chains is the receptor displaying the larger interaction at pH7.4(K eff)2.04×10⁴).The presence of phenethyl5[L5]or octyl groups6[L6]instead of benzyl groups4[L4]in the central nitrogens of the chains produces a drastic decrease in the stability[K eff )3.51×10²(5),K eff)3.64×10²(6)].The studies show the relevance of the central polyaminic nitrogen in the interaction with glutamate.1[L1]and2[L2]with secondary nitrogens in this position present significantly larger interactions than3[L3],which lacks an amino group in the center of the chains.The NMR and modeling studies suggest the important contribution of hydrogen bonding andπ-cation interaction to adduct formation.IntroductionThe search for the L-glutamate receptor field has been andcontinues to be in a state of almost explosive development.1 L-Glutamate(Glu)is thought to be the predominant excitatory transmitter in the central nervous system(CNS)acting at a rangeof excitatory amino acid receptors.It is well-known that it playsa vital role mediating a great part of the synaptic transmission.2However,there is an increasing amount of experimentalevidence that metabolic defects and glutamatergic abnormalitiescan exacerbate or induce glutamate-mediated excitotoxic damageand consequently neurological disorders.3,4Overactivation ofionotropic(NMDA,AMPA,and Kainate)receptors(iGluRs)by Glu yields an excessive Ca2+influx that produces irreversible loss of neurons of specific areas of the brain.5There is much evidence that these processes induce,at least in part,neuro-degenerative illnesses such as Parkinson,Alzheimer,Huntington, AIDS,dementia,and amyotrophic lateral sclerosis(ALS).6In particular,ALS is one of the neurodegenerative disorders for which there is more evidence that excitotoxicity due to an increase in Glu concentration may contribute to the pathology of the disease.7Memantine,a drug able to antagonize the pathological effects of sustained,but relatively small,increases in extracellular glutamate concentration,has been recently received for the treatment of Alzheimer disease.8However,there is not an effective treatment for ALS.Therefore,the preparation of adequately functionalized synthetic receptors for L-glutamate seems to be an important target in finding new routes for controlling abnormal excitatory processes.However,effective recognition in water of aminocarboxylic acids is not an easy task due to its zwitterionic character at physiological pH values and to the strong competition that it finds in its own solvent.9†Centro de Quı´mica Orga´nica Manuel Lora Tamayo.‡Universidad de Valencia.§Universidad Complutense de Madrid.(1)Jane,D.E.In Medicinal Chemistry into the Millenium;Campbell,M.M.,Blagbrough,I.S.,Eds.;Royal Society of Chemistry:Cambridge,2001;pp67-84.(2)(a)Standaert,D.G.;Young,A.B.In The Pharmacological Basis ofTherapeutics;Hardman,J.G.,Goodman Gilman,A.,Limbird,L.E.,Eds.;McGraw-Hill:New York,1996;Chapter22,p503.(b)Fletcher,E.J.;Loge,D.In An Introduction to Neurotransmission in Health and Disease;Riederer,P.,Kopp,N.,Pearson,J.,Eds.;Oxford University Press:New York,1990;Chapter7,p79.(3)Michaelis,E.K.Prog.Neurobiol.1998,54,369-415.(4)Olney,J.W.Science1969,164,719-721.(5)Green,J.G.;Greenamyre,J.T.Prog.Neurobiol.1996,48,613-63.(6)Bra¨un-Osborne,H.;Egebjerg,J.;Nielsen,E.O.;Madsen,U.;Krogsgaard-Larsen,P.J.Med.Chem.2000,43,2609-2645and references therein.(7)(a)Shaw,P.J.;Ince,P.G.J.Neurol.1997,244(Suppl2),S3-S14.(b)Plaitakis,A.;Fesdjian,C.O.;Shashidharan,S Drugs1996,5,437-456.(8)Frantz,A.;Smith,A.Nat.Re V.Drug Dico V ery2003,2,9.Published on Web12/30/200310.1021/ja035671m CCC:$27.50©2004American Chemical Society J.AM.CHEM.SOC.2004,126,823-8339823There are many types of receptors able to interact with carboxylic acids and amino acids in organic solvents,10-13yielding selective complexation in some instances.However,the number of reported receptors of glutamate in aqueous solution is very scarce.In this sense,one of the few reports concerns an optical sensor based on a Zn(II)complex of a 2,2′:6′,2′′-terpyridine derivative in which L -aspartate and L -glutamate were efficiently bound as axial ligands (K s )104-105M -1)in 50/50water/methanol mixtures.14Among the receptors employed for carboxylic acid recogni-tion,the polyamine macrocycles I -IV in Chart 1are of particular relevance to this work.In a seminal paper,Lehn et al.15showed that saturated polyamines I and II could exert chain-length discrimination between different R ,ω-dicarboxylic acids as a function of the number of methylene groups between the two triamine units of the receptor.Such compounds were also able to interact with a glutamic acid derivative which has the ammonium group protected with an acyl moiety.15,16Compounds III and IV reported by Gotor and Lehn interact in their protonated forms in aqueous solution with protected N -acetyl-L -glutamate and N -acetyl-D -glutamate,showing a higher stability for the interaction with the D -isomer.17In both reports,the interaction with protected N -acetyl-L -glutamate at physiological pH yields constants of ca.3logarithmic units.Recently,we have shown that 1H -pyrazole-containing mac-rocycles present desirable properties for the binding of dopam-ine.18These polyaza macrocycles,apart from having a highpositive charge at neutral pH values,can form hydrogen bonds not only through the ammonium or amine groups but also through the pyrazole nitrogens that can behave as hydrogen bond donors or acceptors.In fact,Elguero et al.19have recently shown the ability of the pyrazole rings to form hydrogen bonds with carboxylic and carboxylate functions.These features can be used to recognize the functionalities of glutamic acid,the carboxylic and/or carboxylate functions and the ammonium group.Apart from this,the introduction of aromatic donor groups appropriately arranged within the macrocyclic framework or appended to it through arms of adequate length may contribute to the recognition event through π-cation interactions with the ammonium group of L -glutamate.π-Cation interactions are a key feature in many enzymatic centers,a classical example being acetylcholine esterase.20The role of such an interaction in abiotic systems was very well illustrated several years ago in a seminal work carried out by Dougherty and Stauffer.21Since then,many other examples have been reported both in biotic and in abiotic systems.22Taking into account all of these considerations,here we report on the ability of receptors 1[L 1]-6[L 6](Chart 2)to interact with L -glutamic acid.These receptors display structures which differ from one another in only one feature,which helps to obtain clear-cut relations between structure and interaction(9)Rebek,J.,Jr.;Askew,B.;Nemeth,D.;Parris,K.J.Am.Chem.Soc.1987,109,2432-2434.(10)Seel,C.;de Mendoza,J.In Comprehensi V e Supramolecular Chemistry ;Vogtle,F.,Ed.;Elsevier Science:New York,1996;Vol.2,p 519.(11)(a)Sessler,J.L.;Sanson,P.I.;Andrievesky,A.;Kral,V.In SupramolecularChemistry of Anions ;Bianchi,A.,Bowman-James,K.,Garcı´a-Espan ˜a,E.,Eds.;John Wiley &Sons:New York,1997;Chapter 10,pp 369-375.(b)Sessler,J.L.;Andrievsky,A.;Kra ´l,V.;Lynch,V.J.Am.Chem.Soc.1997,119,9385-9392.(12)Fitzmaurice,R.J.;Kyne,G.M.;Douheret,D.;Kilburn,J.D.J.Chem.Soc.,Perkin Trans.12002,7,841-864and references therein.(13)Rossi,S.;Kyne,G.M.;Turner,D.L.;Wells,N.J.;Kilburn,J.D.Angew.Chem.,Int.Ed.2002,41,4233-4236.(14)Aı¨t-Haddou,H.;Wiskur,S.L.;Lynch,V.M.;Anslyn,E.V.J.Am.Chem.Soc.2001,123,11296-11297.(15)Hosseini,M.W.;Lehn,J.-M.J.Am.Chem.Soc.1982,104,3525-3527.(16)(a)Hosseini,M.W.;Lehn,J.-M.Hel V .Chim.Acta 1986,69,587-603.(b)Heyer,D.;Lehn,J.-M.Tetrahedron Lett.1986,27,5869-5872.(17)(a)Alfonso,I.;Dietrich,B.;Rebolledo,F.;Gotor,V.;Lehn,J.-M.Hel V .Chim.Acta 2001,84,280-295.(b)Alfonso,I.;Rebolledo,F.;Gotor,V.Chem.-Eur.J.2000,6,3331-3338.(18)Lamarque,L.;Navarro,P.;Miranda,C.;Ara ´n,V.J.;Ochoa,C.;Escartı´,F.;Garcı´a-Espan ˜a,E.;Latorre,J.;Luis,S.V.;Miravet,J.F.J.Am.Chem.Soc .2001,123,10560-10570.(19)Foces-Foces,C.;Echevarria,A.;Jagerovic,N.;Alkorta,I.;Elguero,J.;Langer,U.;Klein,O.;Minguet-Bonvehı´,H.-H.J.Am.Chem.Soc.2001,123,7898-7906.(20)Sussman,J.L.;Harel,M.;Frolow,F.;Oefner,C.;Goldman,A.;Toker,L.;Silman,I.Science 1991,253,872-879.(21)Dougherty,D.A.;Stauffer,D.A.Science 1990,250,1558-1560.(22)(a)Sutcliffe,M.J.;Smeeton,A.H.;Wo,Z.G.;Oswald,R.E.FaradayDiscuss.1998,111,259-272.(b)Kearney,P.C.;Mizoue,L.S.;Kumpf,R.A.;Forman,J.E.;McCurdy,A.;Dougherty,D.A.J.Am.Chem.Soc.1993,115,9907-9919.(c)Bra ¨uner-Osborne,H.;Egebjerg,J.;Nielsen,E.;Madsen,U.;Krogsgaard-Larsen,P.J.Med.Chem.2000,43,2609-2645.(d)Zacharias,N.;Dougherty,D.A.Trends Pharmacol.Sci.2002,23,281-287.(e)Hu,J.;Barbour,L.J.;Gokel,G.W.J.Am.Chem.Soc.2002,124,10940-10941.Chart 1.Some Receptors Employed for Dicarboxylic Acid and N -AcetylglutamateRecognitionChart 2.New 1H -Pyrazole-Containing Polyamine Receptors Able To Complex L -Glutamate inWaterA R T I C L E SMiranda et al.824J.AM.CHEM.SOC.9VOL.126,NO.3,2004strengths.1[L1]and2[L2]differ in the N-benzylation of the pyrazole moiety,and1[L1]and3[L3]differ in the presence in the center of the polyamine side chains of an amino group or of a methylene group.The receptors4[L4]and5[L5]present the central nitrogens of the chain N-functionalized with benzyl or phenethyl groups,and6[L6]has large hydrophobic octyl groups.Results and DiscussionSynthesis of3-6.Macrocycles3-6have been obtained following the procedure previously reported for the preparation of1and2.23The method includes a first dipodal(2+2) condensation of the1H-pyrazol-3,5-dicarbaldehyde7with the corresponding R,ω-diamine,followed by hydrogenation of the resulting Schiff base imine bonds.In the case of receptor3,the Schiff base formed by condensation with1,5-pentanediamine is a stable solid(8,mp208-210°C)which precipitated in68% yield from the reaction mixture.Further reduction with NaBH4 in absolute ethanol gave the expected tetraazamacrocycle3, which after crystallization from toluene was isolated as a pure compound(mp184-186°C).In the cases of receptors4-6, the precursor R,ω-diamines(11a-11c)(Scheme1B)were obtained,by using a procedure previously described for11a.24 This procedure is based on the previous protection of the primary amino groups of1,5-diamino-3-azapentane by treatment with phthalic anhydride,followed by alkylation of the secondary amino group of1,5-diphthalimido-3-azapentane9with benzyl, phenethyl,or octyl bromide.Finally,the phthalimido groups of the N-alkyl substituted intermediates10a-10c were removed by treatment with hydrazine to afford the desired amines11a-11c,which were obtained in moderate yield(54-63%).In contrast with the behavior previously observed in the synthesis of3,in the(2+2)dipodal condensations of7with 3-benzyl-,3-phenethyl-,and3-octyl-substituted3-aza-1,5-pentanediamine11a,11b,and11c,respectively,there was not precipitation of the expected Schiff bases(Scheme1A). Consequently,the reaction mixtures were directly reduced in situ with NaBH4to obtain the desired hexaamines4-6,which after being carefully purified by chromatography afforded purecolorless oils in51%,63%,and31%yield,respectively.The structures of all of these new cyclic polyamines have been established from the analytical and spectroscopic data(MS(ES+), 1H and13C NMR)of both the free ligands3-6and their corresponding hydrochloride salts[3‚4HCl,4‚6HCl,5‚6HCl, and6‚6HCl],which were obtained as stable solids following the same procedure previously reported18for1‚6HCl and2‚6HCl.As usually occurs for3,5-disubstituted1H-pyrazole deriva-tives,either the free ligands3-6or their hydrochlorides show very simple1H and13C NMR spectra,in which signals indicate that,because of the prototropic equilibrium of the pyrazole ring, all of these compounds present average4-fold symmetry on the NMR scale.The quaternary C3and C5carbons appear together,and the pairs of methylene carbons C6,C7,and C8are magnetically equivalent(see Experimental Section).In the13C NMR spectra registered in CDCl3solution, significant differences can be observed between ligand3,without an amino group in the center of the side chain,and the N-substituted ligands4-6.In3,the C3,5signal appears as a broad singlet.However,in4-6,it almost disappears within the baseline of the spectra,and the methylene carbon atoms C6and C8experience a significant broadening.Additionally,a remark-able line-broadening is also observed in the C1′carbon signals belonging to the phenethyl and octyl groups of L5and L6, respectively.All of these data suggest that as the N-substituents located in the middle of the side chains of4-6are larger,the dynamic exchange rate of the pyrazole prototropic equilibrium is gradually lower,probably due to a relation between proto-tropic and conformational equilibria.Acid-Base Behavior.To follow the complexation of L-glutamate(hereafter abbreviated as Glu2-)and its protonated forms(HGlu-,H2Glu,and H3Glu+)by the receptors L1-L6, the acid-base behavior of L-glutamate has to be revisited under the experimental conditions of this work,298K and0.15mol dm-3.The protonation constants obtained,included in the first column of Table1,agree with the literature25and show that the zwitterionic HGlu-species is the only species present in aqueous solution at physiological pH values(Scheme2and Figure S1of Supporting Information).Therefore,receptors for(23)Ara´n,V.J.;Kumar,M.;Molina,J.;Lamarque,L.;Navarro,P.;Garcı´a-Espan˜a,E.;Ramı´rez,J.A.;Luis,S.V.;Escuder,.Chem.1999, 64,6137-6146.(24)(a)Yuen Ng,C.;Motekaitis,R.J.;Martell,A.E.Inorg.Chem.1979,18,2982-2986.(b)Anelli,P.L.;Lunazzi,L.;Montanari,F.;Quici,.Chem.1984,49,4197-4203.Scheme1.Synthesis of the Pyrazole-Containing MacrocyclicReceptorsNew1H-Pyrazole-Containing Polyamine Receptors A R T I C L E SJ.AM.CHEM.SOC.9VOL.126,NO.3,2004825glutamate recognition able to address both the negative charges of the carboxylate groups and the positive charge of ammonium are highly relevant.The protonation constants of L 3-L 6are included in Table 1,together with those we have previously reported for receptors L 1and L 2.23A comparison of the constants of L 4-L 6with those of the nonfunctionalized receptor L 1shows a reduced basicity of the receptors L 4-L 6with tertiary nitrogens at the middle of the polyamine bridges.Such a reduction in basicity prevented the potentiometric detection of the last protonation for these ligands in aqueous solution.A similar reduction in basicity was previously reported for the macrocycle with the N -benzylated pyrazole spacers (L 2).23These diminished basicities are related to the lower probability of the tertiary nitrogens for stabilizing the positive charges through hydrogen bond formation either with adjacent nonprotonated amino groups of the molecule or with water molecules.Also,the increase in the hydrophobicity of these molecules will contribute to their lower basicity.The stepwise basicity constants are relatively high for the first four protonation steps,which is attributable to the fact that these protons can bind to the nitrogen atoms adjacent to the pyrazole groups leaving the central nitrogen free,the electrostatic repulsions between them being therefore of little significance.The remaining protonation steps will occur in the central nitrogen atom,which will produce an important increase in the electrostatic repulsion in the molecule and therefore a reduction in basicity.As stated above,the tertiary nitrogen atoms present in L 4-L 6will also contribute to this diminished basicity.To analyze the interaction with glutamic acid,it is important to know the protonation degree of the ligands at physiological pH values.In Table 2,we have calculated the percentages ofthe different protonated species existing in solution at pH 7.4for receptors L 1-L 6.As can be seen,except for the receptor with the pentamethylenic chains L 3in which the tetraprotonated species prevails,all of the other systems show that the di-and triprotonated species prevail,although to different extents.Interaction with Glutamate.The stepwise constants for the interaction of the receptors L 1-L 6with glutamate are shown in Table 3,and selected distribution diagrams are plotted in Figure 1A -C.All of the studied receptors interact with glutamate forming adduct species with protonation degrees (j )which vary between 8and 0depending on the system (see Table 3).The stepwise constants have been derived from the overall association constants (L +Glu 2-+j H +)H j LGlu (j -2)+,log j )provided by the fitting of the pH-metric titration curves.This takes into account the basicities of the receptors and glutamate (vide supra)and the pH range in which a given species prevails in solution.In this respect,except below pH ca.4and above pH 9,HGlu -can be chosen as the protonated form of glutamate involved in the formation of the different adducts.Below pH 4,the participation of H 2Glu in the equilibria has also to be considered (entries 9and 10in Table 3).For instance,the formation of the H 6LGlu 4+species can proceed through the equilibria HGlu -+H 5L 5+)H 6LGlu 4+(entry 8,Table 3),and H 2Glu +H 4L 4+)H 6LGlu 4(entry 9Table 3),with percentages of participation that depend on pH.One of the effects of the interaction is to render somewhat more basic the receptor,and somewhat more acidic glutamic acid,facilitating the attraction between op-positely charged partners.A first inspection of Table 3and of the diagrams A,B,and C in Figure 1shows that the interaction strengths differ markedly from one system to another depending on the structural features of the receptors involved.L 4is the receptor that presents the highest capacity for interacting with glutamate throughout all of the pH range explored.It must also be remarked that there are not clear-cut trends in the values of the stepwise constants as a function of the protonation degree of the receptors.This suggests that charge -charge attractions do not play the most(25)(a)Martell,E.;Smith,R.M.Critical Stability Constants ;Plenum:NewYork,1975.(b)Motekaitis,R.J.NIST Critically Selected Stability Constants of Metal Complexes Database ;NIST Standard Reference Database,version 4,1997.Table 1.Protonation Constants of Glutamic Acid and Receptors L 1-L 6Determined in NaCl 0.15mol dm -3at 298.1KreactionGluL 1aL 2aL 3bL 4L 5L 6L +H )L H c 9.574(2)d 9.74(2)8.90(3)9.56(1)9.25(3)9.49(4)9.34(5)L H +H )L H 2 4.165(3)8.86(2)8.27(2)8.939(7)8.38(3)8.11(5)8.13(5)L H 2+H )L H 3 2.18(2)7.96(2) 6.62(3)8.02(1) 6.89(5)7.17(6)7.46(7)L H 3+H )L H 4 6.83(2) 5.85(4)7.63(1) 6.32(5) 6.35(6) 5.97(8)L H 4+H )L H 5 4.57(3) 3.37(4) 2.72(8) 2.84(9) 3.23(9)L H 5+H )L H 6 3.18(3) 2.27(6)∑log K H n L41.135.334.233.634.034.1aTaken from ref 23.b These data were previously cited in a short communication (ref 26).c Charges omitted for clarity.d Values in parentheses are the standard deviations in the last significant figure.Scheme 2.L -Glutamate Acid -BaseBehaviorTable 2.Percentages of the Different Protonated Species at pH 7.4H 1L aH 2LH 3LH 4LL 11186417L 21077130L 3083458L 4083458L 51154323L 6842482aCharges omitted for clarity.A R T I C L E SMiranda et al.826J.AM.CHEM.SOC.9VOL.126,NO.3,2004outstanding role and that other forces contribute very importantly to these processes.26However,in systems such as these,which present overlapping equilibria,it is convenient to use conditional constants because they provide a clearer picture of the selectivity trends.27These constants are defined as the quotient between the overall amounts of complexed species and those of free receptor and substrate at a given pH[eq1].In Figure2are presented the logarithms of the effective constants versus pH for all of the studied systems.Receptors L1and L2with a nonfunctionalized secondary amino group in the side chains display opposite trend from all other receptors. While the stability of the L1and L2adducts tends to increase with pH,the other ligands show a decreasing interaction. Additionally,L1and L2present a close interaction over the entire pH range under study.The tetraaminic macrocycle L3is a better(26)Escartı´,F.;Miranda,C.;Lamarque,L.;Latorre,J.;Garcı´a-Espan˜a,E.;Kumar,M.;Ara´n,V.J.;Navarro,mun.2002,9,936-937.(27)(a)Bianchi,A.;Garcı´a-Espan˜a,c.1999,12,1725-1732.(b)Aguilar,J.A.;Celda,B.;Garcı´a-Espan˜a,E.;Luis,S.V.;Martı´nez,M.;Ramı´rez,J.A.;Soriano,C.;Tejero,B.J.Chem.Soc.,Perkin Trans.22000, 7,1323-1328.Table3.Stability Constants for the Interaction of L1-L6with the Different Protonated Forms of Glutamate(Glu) entry reaction a L1L2L3L4L5L6 1Glu+L)Glu L 3.30(2)b 4.11(1)2HGlu+L)HGlu L 3.65(2) 4.11(1) 3.68(2) 3.38(4) 3Glu+H L)HGlu L 3.89(2) 4.48(1) 3.96(2) 3.57(4) 4HGlu+H L)H2Glu L 3.49(2) 3.89(1) 2.37(4) 3.71(2)5HGlu+H2L)H3Glu L 3.44(2) 3.73(1) 2.34(3) 4.14(2) 2.46(4) 2.61(7) 6HGlu+H3L)H4Glu L 3.33(2) 3.56(2) 2.66(3) 4.65(2) 2.74(3) 2.55(7) 7HGlu+H4L)H5Glu L 3.02(2) 3.26(2) 2.58(3) 4.77(2) 2.87(3) 2.91(5) 8HGlu+H5L)H6Glu L 3.11(3) 3.54(2) 6.76(3) 4.96(3) 4.47(3) 9H2Glu+H4L)H6Glu L 2.54(3) 3.05(2) 3.88(2) 5.35(3) 3.66(4) 3.56(3) 10H2Glu+H5L)H7Glu L 2.61(6) 2.73(4) 5.51(3) 3.57(4) 3.22(8) 11H3Glu+H4L)H7Glu L 4.82(2) 4.12(9)a Charges omitted for clarity.b Values in parentheses are standard deviations in the last significantfigure.Figure1.Distribution diagrams for the systems(A)L1-glutamic acid, (B)L4-glutamic acid,and(C)L5-glutamicacid.Figure2.Representation of the variation of K cond(M-1)for the interaction of glutamic acid with(A)L1and L3,(B)L2,L4,L5,and L6.Initial concentrations of glutamate and receptors are10-3mol dm-3.Kcond)∑[(H i L)‚(H j Glu)]/{∑[H i L]∑[H j Glu]}(1)New1H-Pyrazole-Containing Polyamine Receptors A R T I C L E SJ.AM.CHEM.SOC.9VOL.126,NO.3,2004827receptor at acidic pH,but its interaction markedly decreases on raising the pH.These results strongly suggest the implication of the central nitrogens of the lateral polyamine chains in the stabilization of the adducts.Among the N-functionalized receptors,L4presents the largest interaction with glutamate.Interestingly enough,L5,which differs from L4only in having a phenethyl group instead of a benzyl one,presents much lower stability of its adducts.Since the basicity and thereby the protonation states that L4and L5 present with pH are very close,the reason for the larger stability of the L4adducts could reside on a better spatial disposition for formingπ-cation interactions with the ammonium group of the amino acid.In addition,as already pointed out,L4presents the highest affinity for glutamic acid in a wide pH range,being overcome only by L1and L2at pH values over9.This observation again supports the contribution ofπ-cation inter-actions in the system L4-glutamic because at these pH values the ammonium functionality will start to deprotonate(see Scheme2and Figure1B).Table4gathers the percentages of the species existing in equilibria at pH7.4together with the values of the conditional constant at this pH.In correspondence with Figure1A,1C and Figure S2(Supporting Information),it can be seen that for L1, L2,L5,and L6the prevailing species are[H2L‚HGlu]+and[H3L‚HGlu]2+(protonation degrees3and4,respectively),while for L3the main species are[H3L‚HGlu]+and[H4L‚HGlu]2+ (protonation degrees4and5,respectively).The most effective receptor at this pH would be L4which joins hydrogen bonding, charge-charge,andπ-cation contributions for the stabilization of the adducts.To check the selectivity of this receptor,we have also studied its interaction with L-aspartate,which is a competitor of L-glutamate in the biologic receptors.The conditional constant at pH7.4has a value of3.1logarithmic units for the system Asp-L4.Therefore,the selectivity of L4 for glutamate over aspartate(K cond(L4-glu)/K cond(L4-asp))will be of ca.15.It is interesting to remark that the affinity of L4 for zwiterionic L-glutamate at pH7.4is even larger than that displayed by receptors III and IV(Chart1)with the protected dianion N-acetyl-L-glutamate lacking the zwitterionic charac-teristics.Applying eq1and the stability constants reported in ref17,conditional constants at pH7.4of 3.24and 2.96 logarithmic units can be derived for the systems III-L-Glu and IV-L-Glu,respectively.Molecular Modeling Studies.Molecular mechanics-based methods involving docking studies have been used to study the binding orientations and affinities for the complexation of glutamate by L1-L6receptors.The quality of a computer simulation depends on two factors:accuracy of the force field that describes intra-and intermolecular interactions,and an adequate sampling of the conformational and configuration space of the system.28The additive AMBER force field is appropriate for describing the complexation processes of our compounds,as it is one of the best methods29in reproducing H-bonding and stacking stabiliza-tion energies.The experimental data show that at pH7.4,L1-L6exist in different protonation states.So,a theoretical study of the protonation of these ligands was done,including all of the species shown in5%or more abundance in the potentiometric measurements(Table4).In each case,the more favored positions of protons were calculated for mono-,di-,tri-,and tetraprotonated species.Molecular dynamics studies were performed to find the minimum energy conformations with simulated solvent effects.Molecular modeling studies were carried out using the AMBER30method implemented in the Hyperchem6.0pack-age,31modified by the inclusion of appropriate parameters. Where available,the parameters came from analogous ones used in the literature.32All others were developed following Koll-man33and Hopfinger34procedures.The equilibrium bond length and angle values came from experimental values of reasonable reference compounds.All of the compounds were constructed using standard geometry and standard bond lengths.To develop suitable parameters for NH‚‚‚N hydrogen bonding,ab initio calculations at the STO-3G level35were used to calculate atomic charges compatible with the AMBER force field charges,as they gave excellent results,and,at the same time,this method allows the study of aryl-amine interactions.In all cases,full geometry optimizations with the Polak-Ribiere algorithm were carried out,with no restraints.Ions are separated far away and well solvated in water due to the fact that water has a high dielectric constant and hydrogen bond network.Consequently,there is no need to use counteri-ons36in the modelization studies.In the absence of explicit solvent molecules,a distance-dependent dielectric factor quali-tatively simulates the presence of water,as it takes into account the fact that the intermolecular electrostatic interactions should vanish more rapidly with distance than in the gas phase.The same results can be obtained using a constant dielectric factor greater than1.We have chosen to use a distance-dependent dielectric constant( )4R ij)as this was the method used by Weiner et al.37to develop the AMBER force field.Table8 shows the theoretical differences in protonation energy(∆E p) of mono-,bi-,and triprotonated hexaamine ligands,for the (28)Urban,J.J.;Cronin,C.W.;Roberts,R.R.;Famini,G.R.J.Am.Chem.Soc.1997,119,12292-12299.(29)Hobza,P.;Kabelac,M.;Sponer,J.;Mejzlik,P.;Vondrasek,put.Chem.1997,18,1136-1150.(30)Cornell,W.D.;Cieplak,P.;Bayly,C.I.;Gould,I.R.;Merz,K.M.,Jr.;Ferguson,D.M.;Spelmeyer,D.C.;Fox,T.;Caldwell,J.W.;Kollman,P.A.J.Am.Chem.Soc.1995,117,5179-5197.(31)Hyperchem6.0(Hypercube Inc.).(32)(a)Fox,T.;Scanlan,T.S.;Kollman,P.A.J.Am.Chem.Soc.1997,119,11571-11577.(b)Grootenhuis,P.D.;Kollman,P.A.J.Am.Chem.Soc.1989,111,2152-2158.(c)Moyna,G.;Hernandez,G.;Williams,H.J.;Nachman,R.J.;Scott,put.Sci.1997,37,951-956.(d)Boden,C.D.J.;Patenden,put.-Aided Mol.Des.1999, 13,153-166.(33)/amber.(34)Hopfinger,A.J.;Pearlstein,put.Chem.1984,5,486-499.(35)Glennon,T.M.;Zheng,Y.-J.;Le Grand,S.M.;Shutzberg,B.A.;Merz,K.M.,put.Chem.1994,15,1019-1040.(36)Wang,J.;Kollman,P.A.J.Am.Chem.Soc.1998,120,11106-11114.Table4.Percentages of the Different Protonated Adducts[HGlu‚H j L](j-1)+,Overall Percentages of Complexation,andConditional Constants(K Cond)at pH7.4for the Interaction ofGlutamate(HGlu-)with Receptors L1-L6at Physiological pH[H n L‚HGlu]an)1n)2n)3n)4∑{[H n L‚HGlu]}K cond(M-1)L13272353 2.44×10³L2947763 4.12×10³L31101324 3.99×10²L423737581 2.04×10⁴L51010222 3.51×10²L6121224 3.64×10²a Charges omitted for clarity.A R T I C L E S Miranda et al. 828J.AM.CHEM.SOC.9VOL.126,NO.3,2004。
一、实验目的本实验旨在通过脂质体转染技术将目的基因导入细胞内,研究脂质体转染方法对基因表达的影响,为后续基因功能研究提供技术支持。
二、实验材料1. 细胞:人胚肾细胞HEK2932. 载体:pGL3-Basic(含有报告基因)3. 脂质体:Lipofectamine 30004. 细胞培养试剂:DMEM培养基、胎牛血清、青霉素-链霉素溶液5. 实验仪器:超净工作台、CO2培养箱、酶标仪、显微镜、PCR仪等三、实验方法1. 细胞培养:将HEK293细胞接种于6孔板,待细胞汇合至80%时进行实验。
2. 脂质体-DNA复合物制备:将pGL3-Basic质粒DNA和Lipofectamine 3000试剂按照说明书比例混合,室温孵育20分钟。
3. 细胞转染:将脂质体-DNA复合物加入细胞培养孔中,轻轻混匀,37℃、5%CO2培养箱中孵育6小时。
4. 洗涤:弃去转染液,用PBS缓冲液洗涤细胞两次。
5. 优化培养条件:将细胞分为实验组和对照组,实验组加入脂质体-DNA复合物,对照组加入等量无DNA的脂质体。
6. 重组蛋白表达检测:收集细胞,提取总蛋白,进行Western blot检测目的蛋白表达水平。
7. 报告基因表达检测:收集细胞,提取总RNA,进行实时荧光定量PCR检测报告基因表达水平。
四、实验结果1. Western blot结果:实验组细胞中目的蛋白表达水平明显高于对照组(P<0.05),表明脂质体转染成功。
2. 实时荧光定量PCR结果:实验组细胞中报告基因表达水平明显高于对照组(P<0.05),表明脂质体转染对基因表达有显著促进作用。
五、实验讨论1. 脂质体转染技术在基因研究中的应用:脂质体转染技术具有操作简便、转染效率高、安全性好等优点,是基因研究中最常用的转染方法之一。
2. 本实验中,脂质体转染成功地将目的基因导入细胞内,并显著提高了报告基因的表达水平。
这表明脂质体转染技术在本实验中具有良好的效果。
第6期孙晓康等:四氢嘧啶生物合成与应用研究进展·983·[21]Chen R,Zhu L,Lv L,et al.Optimization of the extraction and purification of the compatible solute ectoine fromHalomonas elongate in the laboratory experiment of a commercial production project[J].World Journal of Microbiol Microbiology&Biotechnology,2017,33(6):116[22]李珍爱,李海军,胡红涛,等.四氢嘧啶溶析结晶工艺的研究[J].现代化工,2022,42(11):207-210[23]Buommino E,Schiraldi C,Baroni A,et al.Ectoine from halophilic microorganisms induces the expression of hsp70and hsp70B′in human keratinocytes modulating the proinflammatory response[J].Cell Stress Chaperon,2005,10:197-203[24]Bissoyi A,Pramanik K.Effects of non-toxic cryoprotective agents on the viability of cord blood derived MNCs[J].Cryo Letters,2014,34:453-465[25]Sun H,Glasmacher B,Hofmann patible solutes improve cryopreservation of human endothelial cells[J].CryoLetters,2012,33:485-493[26]Bownik A,Stępniewska Z.Protective effects of bacterial osmoprotectant ectoine on bovine erythrocytes subjected tostaphylococcal alpha-haemolysin[J].Toxicon,2015,99:130-135[27]Zaccai G,Bagyan I,Combet J,et al.Neutrons describe ectoine effects on water H-bonding and hydration around asoluble protein and a cell membrane[J].Scientific Reports,2016,6:31434[28]Roychoudhry A,Bieker A,Häussinger D,et al.Membrane protein stability depends on the concentration of compatiblesolutes-a single molecule force spectroscopic study[J].Biological Chemistry,2013,394:1465-1474[29]Kolp S,Pietsch M,Galinski EA,et patible solutes as protectants for zymogens against proteolysis[J].BiochimBiophys Acta,2006,1764:1234-1242[30]Dwivedi M,Brinkkötter M,Harishchandra RK,et al.Biophysical investigations of the structure and function of the tearfluid lipid layers and the effect of ectoine[J].Biochim Biophys Acta,2014,1838:2716-2727[31]Bownik A,Stępniewska Z.Ectoine alleviates behavioural,physiological and biochemical changes in Daphnia magnasubjected to formaldehyde[J].Environ Sci Pollut Res Int,2015,20:15549-15562[32]Yao C,Lin Y,Mohamed MS,et al.Inhibitory effect of ectoine on melanogenesis in B16-F0and A2058melanoma celllines[J].Biochemical Engineering Journal,2013,78:163-169[33]Marini A,Reinelt K,Krutmann J,et al.Ectoine-containing cream in the treatment of mild to moderate atopic dermatitis:a randomised,comparator-controlled,intra-individual double-blind,multi-center trial[J].Skin Pharmacol Physiol,2014,27(2):57-65[34]Grether-Beck S,Timmer A,Felsner I,et al.Ultraviolet A-induced signaling involves a ceramide mediated autocrineloop leading to ceramide denovo synthesis[J].Journal of Investigative Dermatology,2005,125:545-553[35]Müller D,Lindemann T,Shah-Hosseini K,et al.Efficacy and tolerability of an ectoine mouth and throat spraycompared with those of saline lozenges in the treatment of acute pharyngitis and/or laryngitis:a prospective,controlled, observational clinical trial[J].Eur Arch Otorhinolaryngol,2016,273(9):2591-2597[36]Bilstein A,Heinrich A,Rybachuk A,et al.Ectoine in the Treatment of Irritations and Inflammations of the Eye Surface[J].Biomed Research International,2021,9:8885032[37]Kroker M,Sydlik U,Autengruber A,et al.Preventing carbon nanoparticle induced lung inflammation reducesantigen-specific sensitization and subsequent allergic reactions in a mouse model[J].Part Fibre Toxicol,2015,4(12):20 [38]Rieckmann T,Gatzemeier F,Christiansen S,et al.The inflammation reducing compatible solute ectoine does notimpair the cytotoxic effect of ionizing radiation on head and neck cancer cells[J].Scientific Reports,2019,9(1):6594 [39]Kanapathipillai M,Lentzen G,Sierks M,et al.Ectoine and hydroxyectoine inhibit aggregation and neurotoxicity ofAlzheimer'sβ-amyloid[J].FEBS Letters,2005,579(21):4775-4780[40]Dong R,Zhang J,Huan H,et al.High Salt Tolerance of a Bradyrhizobium Strain and Its Promotion of the Growth ofStylosanthes guianensis[J].International Journal of Molecular Sciences,2017,18(8):1625[41]Moghaieb R,Nakamura A,Saneoka H,et al.Evaluation of salt tolerance in ectoine-transgenic tomato plants(Lycopersicon esculentum)in terms of photosynthesis,osmotic adjustment,and carbon partitioning[J].GM Crops& Food,2011,2(1):58-65[42]Zeng F,Wu Y,Bo L,et al.Coupling of electricity generation and denitrification in three-phase single-chamber MFCsin high-salt conditions[J].Bioelectrochemistry,2020,133:107481[43]Dong Y,Zhang H,Wang X,et al.Enhancing ectoine production by recombinant Escherichia coli through step-wisefermentation optimization strategy based on kinetic analysis[J].Bioprocess Biosyst Eng,2021,44(7):1557-1566山东农业大学学报(自然科学版) 2022年第53卷总目次氮素形态及配比对番茄光合、产量和风味品质的影响····················································焦娟,魏珉,谷端银,等(1)不同配方肥料及用量对金桔产量和品质的影响·················································覃盈盈,邓荫伟,潘磊,等(10)土壤增施硒肥对西瓜产量、品质及养分吸收的影响···············································康利允,李晓慧,高宁宁,等(16)苹果园土壤养分与果实营养品质的多元分析·····························································王胜永,谭雪红(24)基于正交设计的姬松茸母种培养条件优化······························································张琴,成文竞(29)生物炭对连作土壤性质及菊花生长和品质的影响···············································张新俊,杨芳绒,张书文,等(34)不同氮素营养对小麦苗期根系发育及抗旱性的影响····················································卢毅,董放,田田,等(39)半干旱区水钾互作对春玉米氮代谢的影响···············································马襄鸿,曹国军,耿玉辉,等(46)有机农田杂草-主作物共生系统的氮素吸收及土壤肥力特征·····························································郭小鸥,崔晓辉(52)罗伯茨绿僵菌AAU-4对草地贪夜蛾幼虫的毒力及生长发育的影响·················································赵宗祥,王明伟,李蕾,等(60)何俊华双短姬蜂幼期形态记述········闫家河,刘经贤,刘腾腾,等(66)植物源杀虫剂在油桃栽培上的应用研究····················································王鹏,韩娟,王瑞,等(71)山东省黑松枯萎病病原鉴定、致病性及其生长适应性研究·················································吕娟,亓玉昆,季延平,等(77)基于灰数灰度的土壤有机质高光谱估测·················································丁天姿,任文静,李丽,等(85)基于随机森林与多源遥感数据的青海省降水空间分布·····························································侯方国,王化光(91)珠海一号高光谱影像在黄土高原大型煤矿区分类中的应用·················································王宏宇,周伟,官炎俊,等(98) 2个烤烟品种在不同典型产区的生长、产量及品质差异分析··············································刘昆霖,蔡宪杰,刘艳华,等(109)宜宾烟区不同海拔对土壤主要养分分布的影响·················································赵瑜,杨懿德,鄢敏,等(115)两种植物生长调节剂及用量对烟草幼苗根系发育的影响·················································李钊,雷晓,肖雨沁,等(123)掺建筑垃圾的可泵性回填土施工性能试验研究·················································杨伟军,闫宇洁,杨建宇(131)轴向应力作用下再生混凝土碳化性能研究···············································刘燕,刘舒畅,刘杏娟,等(138)基于AutoBANK的丁坞水库坝坡稳定性分析·················································刘永,马飞,张坤强,等(145)地下车库的顶板加固及实例分析·················丁敏宝,毛树果(150)芝加哥降雨过程线模型的改进········孙翀,王春婷,张泽玉,等(157)循环miRNA生物标记物的运动生理研究进展·················································陈淑婷,晁天乐,刘文萍(163)戊糖片球菌HM04发酵对无花果浆主要代谢产物及抗氧化活性的影响·········································李曼,马扶强,韩思睿,等(171)桃糖转运蛋白基因PpTST2的功能初探···············································王宁,孟祥光,文滨滨,等(180)野生藤茶资源的鉴别及指纹图谱评价···············································张朝阳,马世龙,秦邦,等(188)腐植酸对小麦生长发育的调控研究··············································赵晓燕,朱先哲,吴洪燕,等(197)华北平原冬小麦农田蒸散动态变化及其影响因子的通径分析··············································许俊东,张心如,关钧元,等(209)土元壳和卵鞘中甲壳素结构特征与比较分析··············································王晓云,解加卓,孙中涛,等(215)养殖盐度对双齿围沙蚕生长及品质的影响···············································杨帆,苗润泽,张煜皓,等(222)渤海黑牛的屠宰性能与肉质分析···············································高翰,李海鹏,李俊雅,等(228)光照和温度对麦可属生长动力学的影响·················································李俊鹏,潘伟斌,黄晓佳(240)不同园林植物根际土壤微生物群落代谢差异性研究··············································万平平,刘胡楠,张文婕,等(246)基于多尺度注意力残差网络的桃树害虫图像识别··············································类成敏,牟少敏,孙文杰,等(253)基于改进空间残差收缩网络模型的农作物病虫害识别···························································刘晓锋,高丽梅(259)园林植物常见病虫害识别··············································杨庆贺,丛晓燕,秦丽红,等(265)不同类型森林植被群落多样性与土壤养分的关联分析·······································································张栋(271)若尔盖湿地水质演化及其对植被多样性特征的指示作用·····························································孟妍君,秦鹏(278)水利开发对盐湖水质及重金属污染的影响················马涛(285)基于GIS的干旱半干旱地区未利用地空间变化的生态风险测度···························································王晓莹,刘新平(294)山东省典型地区盐碱地分布、治理模式研究及效益分析···············································李申,毕梅祯,王建丽,等(302)基于集对分析的德州市雨洪资源潜力研究·················································刘永,马飞,董小花,等(310)基于有限元的蔬菜大棚通风模拟研究···········王金翔,谢娅娅(314)组合工字钢结构钢梁受力性能试验研究与分析··············································任轶蕾,石鑫朔,任小强,等(320)取代1,2-乙二胺邻甲酰氨基苯甲酰胺化合物的设计、合成及生物活性···········································冯美丽,姚文俊,安晶晶,等(326)居住区规划中的公共空间景观营造——以宸曦家园小区为例·····························································陈泽宇,于斌(334)不同氮肥施用量对草莓生长和氮转运酶的影响·················································付君正,肖蓉,张蕊,等(339)苹果SHR亚家族基因特征及其器官表达谱分析··············································于婷婷,许阿飞,张佳林,等(346)基于GEO数据库分析番茄干旱胁迫关键基因与信号通路·················································杨巍,唐兵,周麟笔,等(355)不同细胞分裂素浓度对生菜穴盘基质育苗质量的影响···············································廖雅汶,成臣,卢占军,等(362)四种农作物秸秆基质化栽培平菇的研究········崔永峰,赵培强(368)连作对寒地双孢蘑菇土壤微生物的影响···················································付静,郑焕春,郭劲鹏(374)不同林分下樟子松根系分泌物对土壤环境及微生物的影响·····························································李军,赵彩平(380)一株高效降解麦秸木质素菌株的筛选及效能评价··············································赵文萱,鞠志刚,郑亚强,等(386)荞麦种子高萌发率虫生真菌菌株的筛选·················································彭雪,吴煜,张晓娜,等(393)干湿环境对河岸带氮素含量及空间分布特征的影响···············································陈丽慧,李晗,肖静文,等(401)藉河水环境质量与浮游植物群落结构特征···············孙小玉(406)丁字湾盐沼湿地不同植被生境大型底栖动物群落结构研究··············································纪莹璐,蒲思潮,陶卉卉,等(412)氮沉降对鼎湖山常绿阔叶林土壤生态的影响·············王昭(421)基于灰信息的土壤含水量高光谱灰色关联估测·················································李丽,李西灿,车红,等(429)栓皮栎和侧柏水分利用率与叶片生理对海拔梯度的协同演化·················································温哲华,侯沛轩,余新晓(433)不同配方施肥对酸化潮土及小麦产量的影响·················································王校辉,柴文安,刘铁干(440)不同投料方式对尾菜堆肥效果的影响···············································武凤霞,王小雪,肖强,等(445)西南区坡耕地紫色土离散元模型参数标定··············································聂晨旭,杨明金,李守太,等(454)松材线虫病疫木伐桩剥皮处理对褐梗天牛发生的影响·················································赵建文,高锋,董飘,等(464)不同林龄黄山松生物量和碳密度分配特性···················································孙伟韬,周瑾,李领寰(469)基于地基激光雷达的栾树分形特征分析·················································李辉,林沂,孟祥爽,等(475)农用离心泵内流体流动特性模拟···················王玫,宋志远(484)基于改进LSTM的苹果价格预测模型研究···················································卢超凡,史世凯,王鲁(491)新时期农村经营模式及其影响因素分析···························································葛舒梦,张化楠(497)基于主成分分析和同异分析法的小麦产量与品质综合评价·················································张凡,杨春玲,韩勇,等(503)黄土高原休闲期保护性耕作对冬小麦产量的Meta分析···················································李海康,贺亭峰,耿晶(510)山东省小麦和玉米的产量、肥料使用量及利用率演变趋势··············································马荣辉,董艳红,郭跃升,等(517)水分胁迫条件下玉米产量影响因素灰色关联分析···············································张莉,李西灿,程军伟,等(526)基于GIS和AHP的山东省苹果种植区适宜性评价····················································王凌,吴春晓,李响(531)豫东地区金顶谢花酥梨授粉液的筛选···············································王芳,范嘉林,谢一鸣,等(538)气相色谱-质谱法测定辣椒中虫螨腈残留及消解动态·················································刘晓鹏,刘秋蕊,马翠华(543)钻喙兰快速繁殖技术体系优化··············································郑秋桦,郑翼泽,刘博婷,等(548)不同杉木家系生长及材性变异规律·················································程琳,陈琴,潘晓芳,等(553)氮形态对沉水植物氮磷去除效果及沉积微生物群落结构的影响··············································程铁涵,周昕彦,曹玉成,等(560)疏勒河流域冲积平原天然植被生态需水量研究·········杨占荣(568)湿地植物生物炭对土壤镉的固化效果及植物生理的影响···············································普东伟,邱亮,周巧红,等(574)山东半岛及内陆近地表气温直减率场空间格局分析···············································张刘东,韩芳,乔显娟,等(584)基于水文模拟的城市河道场景构建—以青白江区1956大时代片区为例·········································李绍芃,周越,李晓溪,等(593)光伏驱动一体化装置处理农村生活污水的性能研究···············································张永平,李妮,温静静,等(599)基于目标流量下压力补偿灌水器膜片变化的数值模拟··············································刘娉楠,张金珠,王振华,等(605)基于网络层次分析法的水闸退役评估···················································刘志麟,苏子辰,孙刚(613)虹鳟传染性胰脏坏死性状全基因组关联分析············································欧阳少琪,赵云峰,蒋丽,等(618)纳米银在池塘微宇宙模型中的动态分布研究···············································张泽玉,张丽,罗人杰,等(624)一株G4P[X]型猪A群轮状病毒的分离与鉴定···················································傅安静,黄名英,张斌(629)鲁中肉羊FecB基因多态性与体尺性状的关联分析··············································张亚男,汪浩源,王舒君,等(634)爆炸荷载下钢筋混凝土面板动力响应本构模型分析···············································刘晓蓬,陈健云,周晶,等(640)不饱和聚酯树脂混凝土性能优化及抗冻性··············································刘佩玺,刘恒安,刘福胜,等(651)丘陵山地马铃薯精量中耕施肥机设计与仿真分析···············································方雪峰,沈鹏,宁旺云,等(656)。
四大因素,从源头解析Duplication展开全文导语:测序技术面世至今发生了诸多的技术革新,经历了sanger测序为代表的第一代测序、高通量为代表的第二代测序和单分子实时测序为代表的第三代测序。
迄今为止,高通量测序(next generation sequencing NGS)技术日趋成熟,正式进入临床疾病诊疗阶段,与我们生活息息相关。
Dup背景解读高通量测序检验流程可分为“实验室操作”(又称为“湿实验”)和“生物信息学分析”(又称“干实验”)两部分。
对应的实验操作部分,可点击高通量建库了解。
生物信息学主要是测序完成之后的数据分析和解读,包括数据的拆分、比对和汇总,其中数据的有效性,也就是报告中常见的duplication rate 这一名词,是生信分析的一个重要指标,它让我们对测序得出的数据进行一个大致的了解。
所谓Dup,即重复序列Duplicate reads(涉及相关概念可点击此处),这些重复序列在总测序序列中占比简称为Dup rate。
由于这些重复序列不能带来额外信息,相反会影响变异检测结果准确性,因此下游生信分析中这些重复序列是需要去除的去掉,这也就意味着Dup rate越高,数据利用率越低,测序成本浪费的也就越多。
因此在NGS 生信分析中首要了解的就是dup rate的占比。
常见测序对应Dup可能值测序类型Dup rate 值全外显子测序(WES)10%左右全基因组测序(WGS)10%左右全基因组DNA甲基化测序(WGBS)> 10%转录组测序(RNA-seq)30%~40%左右多重PCR测序和捕获Panel测序与测序的区域以及测序量有关影响Duplication Rate的因素高通量测序技术的不断革新,生物信息学的分析也不断进步与发展,就dup来源,根据其定义与现实的案列分析,客观来讲主要有以下几个方面:1.样本本身所导致的dup值2.建库过程中产生的dup值(片段化,接头连接,PCR扩增)3. Cluster生成对dup的影响(主要指上机之后)4. 光学分辨引起的dup通常来讲,我们认为的dup都是些无效数据,且基本上都是从建库过程中产生的,但实际案列告诉我们,有些时候dup也是“好”的有用数据,上机过程导致的dup值可能要要比我们建库过程中产生的dup值要大的多。
专利名称:IMPROVED PEDIATRIC FORMULA AND METHODS FOR PROVIDING NUTRITIONAND IMPROVING TOLERANCE发明人:BORSCHEL, Marlene, W.,LUEBBERS, Steven, T.,BLACK, Cynthia, J.,MCKAMY, Daniel,L.,COSTIGAN, Timothy申请号:US2001001295申请日:20010116公开号:WO01/056406P1公开日:20010809专利内容由知识产权出版社提供摘要:The present invention provides an improved pediatric formula and methods for providing nutrition to and enhancing tolerance in pediatric patients. The formula may be provided in powder, concentrate or ready-to-feed forms. The pediatric formula comprises, based on a 100 kcal basis, about 8 to about 16 grams carbohydrate (preferably about 9.4 to about 12.3 grams), about 3 to about 6 grams lipid (preferably about 4.7 to about 5.6 grams), about 1.8 to about 3.3 grams protein (preferably about 2.4 to about 3.3 grams), and a tolerance improver comprising about 37 to about 370 milligrams (preferably about 74 to about 222 milligrams, more preferably about 111 to about 148 milligrams) xanthan gum. The formula may also be provided in a powder, which comprises, based on 100 grams of powder, about 30 to about 90 grams carbohydrate (preferably about 48 to about 59 ), about 15 to about 30 grams lipid (preferably 22 to about 28 grams), about 8 to about 17 grams protein (preferably about 11 to about 17), and about 188 to about 1880 milligrams (preferably about 375 to about 1125, morepreferably about 375 to about 1125 milligrams) xanthan gum. The formula preferably further comprises vitamins and minerals and may further comprise a stabilizer. The methods comprise administering to a pediatric patient an effective amount of a pediatric formula according to the invention, as described above.申请人:ABBOTT LABORATORIES地址:US国籍:US代理机构:DIXON, J., Michael更多信息请下载全文后查看。
Improved Duplication Modelsfor Proteome Network EvolutionG¨u rkan Bebek1,Petra Berenbrink2,Colin Cooper3,Tom Friedetzky4,Joseph H.Nadeau5,and S.Cenk Sahinalp2, 1Department of EECS,Case Western Reserve University,Cleveland,OH44106-7071USA 2School of Computing Science,Simon Fraser University,Burnaby BC,V5A1S6Canada 3Department of Computer Science,King’s College,London WC2R2LS,UK4Department of Computer Science,Durham University,Durham,DH13LE,UK 5Genetics Department,Case Western Reserve University,Cleveland,OH44106-4955USA Abstract.Protein-protein interaction networks,particularly that of theyeast S.Cerevisiae,have recently been studied extensively.These net-works seem to satisfy the small world property and their(1-hop)degreedistribution seems to form a power law.More recently,a number of du-plication based random graph models have been been proposed with theaim of emulating the evolution of protein-protein interaction networksand satisfying these two graph theoretical properties.In this paper,weshow that the proposed model of Pastor-Satorras et al.does not gener-ate the power law degree distribution with exponential cutoffas claimedand the more restrictive model by Chung et al.cannot be interpretedunconditionally.It is possible to slightly modify these models to ensurethat they generate a power law degree distribution.However,even afterthis modification,the more general k-hop degree distribution achievedby these models,for k>1,are very different from that of the yeast pro-teome network.We address this problem by introducing a new networkgrowth model that takes into account the sequence similarity betweenpairs of proteins(as a binary relationship)as well as their interactions.The new model captures not only the k-hop degree distribution of theyeast protein interaction network for all k>0,but it also captures the1-hop degree distribution of the sequence similarity network,which againseems to form a power law.1IntroductionProtein-protein interactions play a central role in the execution of key biological functions of a cell.Such a relationship can be summarized in a graph(network) in which each node represents a protein and each(undirected)edge represents an interaction.A graph including all proteins in an organism and all possible interactions between these proteins can be called the proteome network of that organism.The structure of the yeast proteome network seems to reveal two interesting graph theoretic properties[20,35]:(i)The degree distribution of nodes(i.e.the Corresponding Author;cenk@cs.sfu.ca2proportion of nodes with degree k as a function of degree)approximates a power-law(i.e.is approximately ck−b for some constants c,b).(ii)The graph exhibits the small world effect.Small world phenomena and the power-law degree distributions have previ-ously been observed in a number of naturally occurring graphs such as commu-nication networks[14],web graphs[1,4,9,11,21,22],research citation networks [29],human language graphs[15],neural nets[36]etc.These two properties can not be observed in the classical random graph models studied by Erd¨o s and R´e nyi[13]in which edges between pairs of nodes are determined independently. However,it is possible to generate graphs that satisfy these properties by an iterative process that adds one new node to the graph at each step[1,2,6,8, 9,11,21].The new node is then connected to some b(b can be a constant or an independent random variable)of the existing nodes,each of which is chosen with probability proportional to its degree.Unfortunately such a preferential at-tachment model does not capture the essence of the genome evolution and hence can not be used to model proteome networks.According to Ohno’s model[25], the two underlying mechanisms for genome evolution is gene duplication and point mutations.6Recent work,thus,has focused on random graph models that grow via node duplications and get modified by mechanisms that emulate point mutations.Among these studies,the most promising one,which we call the general dupli-cation model,was described independently in[26,34,7].The general duplication model works in iterations;in each iteration t,one existing node(representing a gene or an associated protein)is chosen uniformly at random and is“duplicated”with all its edges.After the duplication step,to emulate mutations,also named as the divergence step,each edge of the new node is deleted with probability q. This is followed by inserting edges between the new node and every other node with probability r/t where t is the total number of nodes and r is a constant. With the right selection of parameters q and r,the general duplication model well approximates the degree distribution of the yeast proteome network.Thefirst serious study to formally analyze the degree distribution of the general duplication model was by Pastor-Satorras et al.who,in[26],claim that the distribution of both the general yeast proteome network and the duplication model is a“power law with exponential cut-off”.This means that the fraction of nodes with degree k among all nodes is independent of time and is approximated by f k=ck−b·a−k;here a,b,c are constants.However,they make a number of simplifying assumptions in their analysis to get this result.For instance,they approximate the probability for generating a node with degree k by the proba-6After a gene duplication event,one of the genes may accumulate deleterious muta-tions and be lost,or both copies of the gene may be retained.Two possible evolu-tionary reasons for keeping both copies can be(i)selection for increased levels of expression,or(ii)divergence of gene function[23,30].Functional divergence can be produced through complementary degeneration[16].Although the duplicated regions of the genomes have been described and listed before(for instance S.Cerevisiae[31, 37]),there is no certain schema of how duplications formed the current shape of the genomes.3 bility of duplicating a node with degree k+1only and subsequently deleting asingle edge.This assumption also reduces the number of singletons.They furtherapproximate this probability with a function linear in k.A more recent analysis of the degree distribution of the general duplicationmodel,for the special case that r=0is given by Chung et al.[10].As per[10],we will refer to this special case as the pure duplication model.In contrast to[26],Chung et al.claim that the fraction of nodes with degree k is independent oftime and is of the form f k=ck−b;here b is a function of p=1−q and values of b≤2are possible for some p.The pure duplication model creates singletonnodes,i.e.nodes that are not connected to any other node of the graph.Since,a node can only get a new edge if one of its neighbors is copied,a singleton willremain singleton during the whole graph generation process.Note that in thismodel all non-singleton nodes form one connected component.In a separate work,van Noort et al.[24]show that the gene coexpressionnetwork in S.Cerevisiae have scale-free and small-world network properties.By using the homology relations between the genes in coexpression network,they present a model which can generate networks with similar scale-free andsmall-world properties.The model starts with a number of genes which havea number of transcription factor binding sites(TFBSs)and genes sharing aminimum number of TFBSs considered coexpressed.At every time step eachgene can be duplicated or deleted with certain probabilities.Also,at every timestep a TFBS of a gene can be deleted or a new TFBS from another gene canbe acquired by a gene with certain corresponding probabilities.Different frommany,van Noort et al.[24]consider deleting or inserting a TFBS of the genewhich deletes a set of connections,or adds a set of links to the gene.Hence,in their approach the connections of genes were considered with groups.VanNoort et al.[24]claim that the model generates a degree distribution with aslope similar to the coexpression network of S.Cerevisiae7.Additionally,averageclustering coefficient8,and shortest path length of the networks were compared.Although these are measures to understand the topology of a network,they arenot sufficient to claim that two networks are similar at all.There is also another study presented by Przulj et al.[28],in which a differentapproach to model these networks has been studied.Przulj et al.[28]claim thata random geometric model better captures the currently accepted protein pro-tein interaction networks.A geometric disc graph is formed by connecting twonodes of the graph with an edge,if their distance in the metric space is smallerthan a certain threshold.Przulj et al.[28]argue that the scale-free property ofthe proteomes is a result of the noise in the available data at the moment and 7Numerical results were not presented in[24].Hence,the simulation results given draws certain amount of question about how close the degree distribution,i.e.the power-law exponent,was.8The clustering coefficient of a node is the ratio between the actual number of edges between neighbors of a node and the maximum possible number of edges between these neighbors.Average clustering coefficient of a network is the average of cluster-ing coefficients over all units in the system.[36]4the degree distribution of such networks should follow the Poisson distribution. By counting the number of different motifs in the networks,they form a measure of local network structure and using this they compare different models with the available proteomes.According to the experiments they carry out,a three di-mensional geometric disc graph with same number of nodes but six times larger edge count has similar number of motifs as the proteomes they worked on.Al-though,the network motifs considered capture local properties of the networks, in their work,Przulj et al.[28](i)do not take into account Ohno’s Theory[25] which states that,the proteome network should be generated through a process, which attributes the genome sequence growth and evolution to subsequent gene duplications followed by mutations on the gene sequences,(ii)do not consider global properties of the networks before drawing conclusions,such as the aver-age degree or the degree distribution.Moreover,the work presented has vague descriptions on how scale free networks are formed.For instance,there are many models available that can generate scale free networks,but not every scale free network necessarily is generated by emulating proteome network growth i.e.du-plication and divergence.The most recent study that was presented by Ispolatov et al.[18]focuses on duplication-divergence models with completely asymmetric divergence.In a completely asymmetric divergence process,links are removed from the dupli-cated node only.In their study,Ispolatov et al.examines this model where the evolution is characterized by a single parameter,the link retention probability. They claim that,this single-parameter duplication-divergence network growth model can approximate the degree distribution of real protein-protein interac-tion networks.Although their model generates similar degree distributions,in reality the network lacks the local structure similarity.For instance,this model would not generate any triangular subgraphs(a clique of three in the network) since the duplication would generate cycles of even length or degree one nodes. However,cycles of any size exists in vast numbers in the real proteome network.In most of these studies the protein-protein interactions identified by high-throughput yeast two-hybrid screens or inferred from mass spectrometry of coim-munoprecipitated protein complexes were considered.However,analysis based on the agreement of the interaction and expression data show that almost less than half of these interactions are biologically relevant[12].In a recent study,Han et al.[17]showed that low coverage makes determination of the true topology of the network difficult.Han et al.also showed that sampling the real network through these experiments(since the experiments only reveal partial networks),regard-less of the topology of the network that we are looking for,the topology of the sub network that is sampled would have a degree distribution similar to a power law.In other words,according to these experiments,it is not clear whether the proteome network has a power law degree distribution or not.However,in this paper,we assume that the proteome network should be generated through a pro-cess,which attributes the genome sequence growth and evolution to subsequent gene duplications followed by mutations on the gene sequences.Previously,it has been been shown that this process would generate a network with power-law5 degree distribution[26,34,7].Moreover,we show that the degree distribution of the general duplication model is a power law.We can summarize our contributions as follows.(i)We show that the degree distribution of the pure duplication model(r=0)cannot be a power law as stated in[10].(ii)We show that the degree distribution of the general duplication model can not be a power law with exponential cut-offas stated in[26].In fact, for r>0,it is simply a power law.It is also possible to slightly modify the pure duplication model so that it achieves a power law degree distribution but these details are left to a more complete version of the paper[5]due to space limitations.(iii)The(1-hop)degree distribution of a graph is the distribution of nodes with degree k as a function of k.A more general notion is the -hop degree distribution which is defined to be the distribution of nodes that can reach k nodes in at most -hops as a function of k.We observe in this paper that the general duplication model does not capture the -hop degree distribution of the yeast proteome network for >1.(iv)We describe a new model that takes into account the sequence similarity between protein pairs as a binary relationship in addition to their interactions.Our model accurately captures the -hop degree distribution of the yeast proteome network for all >0and yields a good approximation to the degree distribution of the sequence similarity network.Our specific contributions are as follows.Wefirst show in Section2that the(expected)proportion of singletons generated by the pure duplication model (r=0)grows in time.In fact,the only limiting(time independent)solution is f0=1and f k=0for all k>0.Note that for the case p=q=0.5the average degree of nodes in the pure duplication model does not change over time(see Lemma3).Together with the fact that the fraction of singletons increases in time,this implies that(i)the average degree of non-singletons must increase in time and(ii)there is a single connected component of size o(t)with increasing average degree.It is quite possible that this connected component of the network generated by the pure duplication model exhibits a power law with parameter b≤2,however this is difficult to establish.In the rest of Section2,we show that the degree distribution of the general duplication model(in fact,any random model based on duplications)is not a power law with exponential cut-offas claimed in[26].We achieve this by showing a bound for the maximum degree of the general duplication model and contrasting it with that of a network which exhibits power law with exponential cut-off.In[5]we proved that the general duplication model for r>0and a slightly modified version of the pure duplication model indeed achieve a power law de-gree distribution as per the yeast proteome network.(Due to space limitations we omit these proofs.)However,a more general measure for capturing the topo-logical properties of a network is the -hop degree distribution for all >0. Under this measure(for >1),we show that the(modified)general duplication model is quite different from the yeast proteome network.In Section3,wefinally present our sequence similarity enhanced model which is based on the observation that the interactions of sequence-wise similar pro-6teins are highly correlated.The model thus employs sequence similarity edges between pairs of nodes/proteins to better capture the mechanisms for updat-ing the interactions after a duplication event.Our model not only captures the degree distribution of the yeast proteome network but also yields a much bet-ter approximation to its -hop degree distribution for >1.Moreover we have observed that the average clustering coefficients of networks generated by this model and the original proteome network are almost equal to each other.1.1PreliminariesWefirst define the general duplication model formally.The general duplication model grows iteratively in discrete time steps.Let G(t−1)be the network at the end of time step t−1.In time step t exactly one new node is generated and will be denoted as v t.For any node v s,we will denote its degree(or expected degree if the context is clear)at time step t≥s by d s(t).(i)At each time step t,the new node v t is generated by picking one of the nodes w in G(t−1)uniformly at random and“duplicating”it to create v t;i.e.v t will initially be connected to all neighbors of w.(ii)The edges incident to v t are updated through the following random process. Each edge e is considered independently and is deleted with probability q(= 1−p).Then,each node u which is not connected to v t is considered independently and an edge between u and v t is created with probability r/t.As mentioned earlier,when r=0we have the pure duplication model;we show in the next section that it can not achieve a power law degree distribution as stated in[10].To address this problem the pure duplication model can be modified via a new step(3)where v t is connected to a uniformly chosen random node(either at all times or only if it had become a singleton at the end of step (2)).As a result,v t never has degree0.Let F k(t)denote the number of nodes of degree k at the end of step t in the random process and let F(t)=(F0(t),F1(t),···)be the degree sequence.Also let F k(t)=E F k(t)be the expected value,and f k(t)=F k(t)/t the expected fraction of nodes of degree k.Finally let e(t)be the number of edges in G(t)and e(t)=E e(t);similarly let h(t)be the average degree of a node(averaged over all nodes)in G(t),and h(t)=E h(t).We say a model has a power law degree sequence if we canfind b,c>0constant such that f k(t)→f k as t→∞where f k=(1+O(1/k))ck−b.2On the General Duplication ModelThis section is on the previous studies on the analysis of the general duplication model.Wefirst show in Section2.1that the fraction of singletons in the pure duplication model grows with time in such a way that F0(t)→t is the only consistent limiting solution.This implies that,unless f k=0for k≥1then F k(t)=tf k,where f k is a time independent solution for the limiting proportion of nodes of degree k.In fact,for the particularly interesting case that p=q=71/2,we show that the expected number of non singletons at time step t is between O (√t )and O (t/log log t ).This contradicts the assumption in Eqn(6)of [10].Thus,without some modification,the pure duplication model of [10]cannot have a power law degree distribution in the form F k (t )∼ctk −b for any constants c,b .Section 2.2is on the analysis in [26]which predicts the general duplication model to have a degree distribution of the form ‘power law with exponential cut-off’;i.e.there exists constants a,b,c such that,as t →∞,we have f k (t )∼ck −b a −k for k →∞.We show that this cannot be true by demonstrating that the expected maximum degree for a power law with exponential cut-offis O (log t )whereas the general duplication model has expected maximum degree of Ω(t p ).2.1Properties of the pure duplication modelLemma 1.The expected proportion of singletons,f 0(t ),in the pure duplication model is a non-decreasing function of t and tends to a limit f 0≤1.If also we have that f k (t )→f k for k ≥1then f 0=1and f k =0for k ≥1.Proof.We have the following recurrence for singletons in the pure du-plication model:F 0(t +1)=F 0(t )+ k ≥0F k (t )q kt .Thus writing F k (t )=tf k (t )we have(t +1)(f 0(t +1)−f 0(t ))=k ≥1f k (t )q k ≥0,and we see that f 0(t +1)≥f 0(t ).As f 0(t )≤1it follows that f 0(t )→f 0≤1from below as t →∞.Suppose next that for some k ≥1,k constant,f k (t )→f k >0,then k ≥1f k q k =c >0.Thus there exists T such that for t ≥T ,k ≥1f k (t )q k ≥c/2>0and f 0(t +1)≥f 0(t )+c 2(t +1).Iterating this we getf 0(t )≥c 2log t/T +O (1/T )+f 0(T )i.e.,f 0(t )>1for t large enough,which is impossible.2This lemma excludes the existence of power law solutions f k ∼ck −bfor finite k ≥1(which are suggested in [10]),but we cannot exclude non-limiting degree distributions by this argument.It is possible to obtain a tighter estimate on the proportion of singletons in the network for the particularly interesting case that p =q =1/2.As per8Lemma 3(see below),this case preserves the (expected)average degree of the nodes throughout the generation of G (t ).Thus,e (t )=e (0)·t (where e (0)is the number of edges of G (0)).Lemma 2.Consider the case q =1/2.Let F +(t )=t −F 0(t ),the number of non-singleton nodes at timet and F +=E F +.Then,there are constants c 1,c 2>0such that c 1√t ≤F +(t )≤c 2t/log log t .Proof.We have the following recurrence:F +(t +1)=F +(t )+1t k ≥0F k (t )(1−(1/2)k )(1)Thus:F +(t +1)=F +(t )+F +(t )t −F +(t )t k ≥1F k (t )F (t )12(2)As F 1(t )≤F +(t ),one can easily check F +(t )≥F +(0)√t giving the lowerbound.Now let g (k )=1/2k ,which is convex and thus for any set of λk for which λk =1,we must have λk g (k )≥g ( kλk ).Now pick λk =F k (t )F +(t ).We have kF k (t )=2e (t )=2e (0)t .Thus:k ≥1F k (t )F +(t ) 12 k ≥ 12 2e (t )/F +(t )(3)By substituting (3)into (2)and using e (t )=e (0)t we get:F +(t +1)≤F +(t )+F +(t )t 1− 122e (0)t/F +(t ) .This is only satisfied if F +(t )≤c 2t/log log t .This can be verified as follows.Let c 2=4e (0)log 2.Either F +(t )≤c 2t/log log t ,or if not we can substitute this lower bound into the exponent on the right hand side and iterate the recurrence on t to obtain a contradiction.2Lemma 3(below)states that the expected number of edges is e (t )=ct 2p and consequently the expected average degree is h (t )=2ct 2p −1.Thus for p <0.5the average degree decreases over time and for p >0.5it increases.Only for p =0.5the average degreeremains constant;however as the proportion of singletons is ≥1−O 1log log t due to Lemma 2,the average degree of non-singletons (whichall form a single connected component)is ≥c log log t .Proposition 1.The power law exponent b in [10]is given by the solution of 1=bp −p +p b −1and has the value 2when p =1/2.This is incompatible with e (t )=2e (0)t unless the connected component is of size o (t ).9To see this,recall that kF k (t )=2e (t ).Under the assumption that we have apower law degree distribution at p =1/2,then F k (t )∼ck −2t ande (t )=ct 2 k ≥11+O 1k k −1.However k ∗k =1k −1diverges as k ∗→∞,and we cannot have e (t )=2e (0)t ,unless we truncate k ∗at a finite value.Lemma 4(below)sets the expected maximum degree in the pure model at Ω(t p ),and the power law assumption itself is not compatible with k ∗being finite.It is however still possible that a power law with exponent b =2holds for the connected component C .Putting k ∗=O (t 1/2)we see that k −1=O (log t )which gives e (t )=2e (0)t provided |C |=O (t/log t ),in accordance with the results of Lemma 2. 10 203040 50 60 70 80 901001 10100P e r c e n t a g e o f s i n g l e t o n s Percentage of running time Fraction of Singletons 0.40.50.60.7Fig.1.Percentage of singletons in the pure duplication model as function of time (each curve is for a different value of p )Lemma 3.The expected total number of edges and the expected average degree of nodes at step t satisfye (t )∼e (0)t 2p and h (t )∼h (0)t 2p −1Proof.The number of edges at time t +1in terms of the number of edges at time t isE (e (t +1)|e (t ))=e (t )+1t s ≤tpd s (t ).10The first term is trivial;the second term is obtained by considering the possibility that each given node v s is duplicated at time t ;then pd s (t )would be the expected number of its edges retained.Because the sum of the degrees of all nodes is twice the number of edges,we have,taking expectations again,thate (t +1)= 1+2p te (t )which has a solution e (t )∼e (0)t 2p .2Figure 2.1shows the percentage of the singletons in the network over the time for different values of p .The model was run until 1000000non-singleton nodes were created.The plot uses a linear scale on the y-axis (percentage of singletons)and a logarithmic scale on the x-axis (running time). 0 100200300 400 5006001 10100A v e r a g e D e g r e e Percentage of running time Average Degree of the Connected Component0.40.50.60.7Fig.2.Average degree of non-singleton nodes in the pure duplication model as function of time (each curve is for a different value of p )Figure 2.1shows the average degree over time for different values of p .Again,the model was run until 1000000non-singleton nodes were created.The average degree of the network increases by time and the larger the value of p is,the larger is the increases of the average degree.2.2On the degree distribution of the general duplication modelThe next lemma shows that the degree distribution of the general duplication model can not be a power law with exponential cut-offas suggested in [26].Lemma 4.Let a,b,c >0be constants.The degree distribution of the general duplication model cannot be in the form F k (t )∼ctk −b a −k as claimed in [26].Proof.Denote by k max,the expected maximum degree in G(t).Assume an exponential cut-offi.e.F k(t)∼tck−b a−k.Then k≥k0F k(t)=o(1)for k0>log t/log a,and so k max=O(log t/log a).On the other hand consider the expected degree of the node v s at time t+1, which is a non-decreasing function of t.Even in the worst case situation(r=0)we have:d s(t+1)=d s(t)+d s(t)tp(4)as the degree of v s can only increase if one of its neighbors is picked at time t and the edge is retained.Thus:d s(t+1)=d s(t) 1+p t =d s(s) 1+p s · 1+p s+1 ... 1+p t Since log(1+x)=x−O(x2)we haveexp t τ=s log(1+p/τ) ∼exp p t τ=s1/τ =e p log(t/s)which implies that d s(t+1)=Ω(d s(s)(t/s)p)and that k max=Ω(t p)contra-dicting the claim.2 Wefinally prove that for r>0there are no degenerate limiting solutions of the form f0=1,f k=0,k≥1for the general model of[26].Lemma5.For any r>0constant,the general model does not have a degener-ate limiting solution of the form f0=1,f k=0,k≥1.Proof.We have the following recurrence for the expected number of sin-gletons:F0(t+1)=F0(t)+ k≥0F k(t)t q k 1−r t−r t F0(t).Assuming the existence of a limiting solution F k(t)=f k t we have(after taking limits):(1+r−e−r)·f0=e−r k≥1f k q k.If f0=1then k≥1f k q k=0,but1+r−e−r>0for r>0contradicting this.23An Enhanced Duplication Model Based on Protein Sequence SimilarityThe general duplication model well approximates the degree distribution of the yeast proteome network as observed previously in[26].(In fact,we have shown in[5]that this degree distribution is simply a power law for r>0;due to spacelimitations this proof is omitted.)In Figure 3we compare the degree distribu-tion of the yeast proteome network from the Database of Interacting Proteins (DIP)[38]9to that of the (modified)general duplication model with the best fit-ting 10parameters p =0.465and r =0.08.Although the DIP database is incom-plete and includes several interactions which are not commonly observed,it still provides the most comprehensive protein-protein interaction data for the yeast S.Cerevisiae .As observed earlier,the degree distribution of the yeast proteome network is very similar to that of the general model with the above parameters. 1 10100100010000 1 10100# n o d e s degree Degree Distribuiton of the Protein Protein Interaction NetworksDIP Yeast Data General ModelFig.3.The degree distribution of the proteome interaction network of the yeast and that of the general model with parameters q =0.535,r =0.08The degree distribution is one possible measure for testing the structural similarity of two networks.Unfortunately structurally very different networks can have identical degree distributions.For example in an (infinite)2-dimensional grid all nodes have degree 4,similar to a collection of cliques of size 5.The grid obviously forms a single connected component whereas the 5-cliques are not connected at all.Thus it is desirable to use additional measures for testing the similarity of two networks more accurately.A more refined measure of structural similarity is achieved by comparing the -hop degree distribution of the general duplication model and the yeast proteome network.In a given network,the -hop degree of a node is defined to be the total number of unique nodes it can reach in at most hops.Clearly the 1-hop degree of a node is its own degree.9The DIP yeast data has ≈15000interactions among 6700known yeast proteins.The DIP network has only 4700of the proteins present in the network,which also means that there are about 2000singletons in the network.10For all plots,the fits were achieved by calculating the average slope in both curves.。