最新LightTools设计实例汽车仪表盘导光按钮设计
- 格式:doc
- 大小:174.00 KB
- 文档页数:5
IntroductionBacklights are used for compact, portable, electronic devices with flat panel Liquid Crystal Displays (LCDs) that require illumination from behind. Applications include devices as small as hand-held palm pilots and as large as big-screen TVs. Goals for backlight design include low power consumption, large area with small thickness, high brightness, uniform luminance, and controlled viewing angle, either wide or narrow. To achieve these challenging design goals with a cost effective and timely solution, it is necessary to use computer-aided optical design tools to expedite the design. This paper describes fea-tures in ORA’s LightTools® illumi-nation design and analysis software that enable the development of state-of-the-art backlight designs. Optical Design and Analysis Tools for BacklightsIllumination or lighting systems take light from one or more sources and transform it in some way to produce a desired light distribution over an area or solid angle. Illumination design software must be able to model the geometric and optical properties of different types of light sources and transforming elements, and it must also be able to evaluate the paths of light using optical ray tracing through the model to calcu-late the final light distribution.The light distributions are calculatedusing Monte Carlo simulations tocalculate illuminance, luminance, orluminous intensity over the desiredareas and/or angles. Rays are startedfrom random locations and direc-tions from the source(s), tracedthrough the optical system, and col-lected on receivers. Illuminance canbe calculated for rays collected onsurface receivers and intensity forrays collected on far field receivers.By defining a luminance meter forsurface receivers, the spatial orangular variation of luminance canbe calculated from that surface.In some cases, it may be importantto analyze the chromaticity of a dis-play. The spectral energy distribu-tion of the sources (such as LEDs)can be specified. The output of CIEcoordinates, together with corre-lated color temperature (CCT),quantifies the colorimetric behaviorof the display. An RGB photorealis-tic rendering of the display outputcan also be generated. All of theseanalyses are available in LightTools.Aspects of backlight displays makeparticular demands on illuminationanalysis software. As will be dis-cussed, the means by which light isextracted from a backlight relies oneither dense patterns of paint dots orpatterned microstructures. Model-ing microstructure arrays in particu-lar can result in extremely largemodel sizes if created explicitly as aCAD model. LightTools providesthe capability to define arrays of 3Dtextures that ray trace and renderaccurately but are not explicitly con-structed as part of the geometricmodel, thereby resulting in muchsmaller model sizes and much fasterray tracing.A second aspect of backlight analy-sis involves ray splitting and scatter-ing from the surfaces of the lightguide. Because Monte Carlo simu-lations are used to analyze the illu-mination performance, a potentiallylarge number of rays must be tracedto get sufficient accuracy for com-parison of designs. It is most effec-tive to trace rays that carry most ofthe flux. This can be achieved byusing probabilistic ray splitting totrace the paths with the most flux,and allowing use of aim areas orsolid angles for scattering surfaces todirect scattered light in “important”directions (i.e., toward the displayobserver).What is a Backlight?A typical backlight consists of alight source, such as a Cold CathodeFluorescent (CCFL) or Light Emit-ting Diodes (LEDs), and a rectangu-lar light guide, which is also referredto as a light pipe. Other elementsthan can be used include a diffuser,which enhances display uniformity,and a brightness enhancement film(BEF), which enhances displaybrightness.The light source is usually located atone edge of the light guide to mini-mize the thickness of the display.Edge lighting typically uses totalinternal reflection (TIR) to propa-gate light along the length of the dis-Optical Design Toolsfor Backlight Displaysplay. Figure 1 shows a schematic ofa typical backlight design.The backlight designer has severaloptions for modeling light sources inLightTools. CCFL sources of differ-ent shapes (e.g., straight, L-shaped,U-shaped, or W-shaped, shown inFigure2) can be rapidly definedusing the Fluorescent Lamp CreationUtility. Reflectors for the lamp canbe defined using a variety of Light-Tools geometric primitives, such ascylinders, elliptical troughs, andextruded polygons; reflectorsdefined in CAD systems may also beimported via standard data exchangeformats (IGES, STEP, SAT andCATIA).If LEDs are used, the designer canchoose the desired LED model frompre-stored catalogs of models fromAgilent,LumiLeds, Nichia, orOsram.Once the light is directed into theside of the light guide, the problembecomes extracting the light out ofthe light guide perpendicular to thedirection of propagation.As shown in Figure 3, the availablepower is highest at the source end ofthe light guide and falls off withincreasing distance from the source.To obtain uniform output, the extrac-tion efficiency must increase withdistance from the light source.Developing a light guide that exhib-its the necessary variation in extrac-tion efficiency is one of the primarytasks in designing a backlight.Two extraction techniques can beused. The printed light extractiontechnique uses patterns of paint dotson the bottom of the light guide toscatter light upward and out of thetop of the light guide. The secondtechnique, molded light extraction,relies on TIR from microstructuresor textures patterned on the bottomsurface to redirect light out of the topof the light guide.LightTools supports the design oflight guides via the BacklightDesign Utility. This tool (Fig-ure 4) assists the user in creat-ing the different parts of abacklight. There are optionsfor adding source/reflectorcomponents to the model, BEFmodeling, and setting up areceiver for illumination analy-sis. The main focus of theBacklight Utility is multipletabs for setting up and modify-Figure 2. Fluorescent Lamp Building Blocks ReflectorDiffuser(BEF)Light SourceLight GuideFigure 1. Schematic of a Typical Backlighting extraction mechanisms of differ-ent types.For backlights using the printed light extraction method, the Backlight Utility provides options for linear variation in paint dot size and aspect ratio, as well as linear variation of dot spacing along the length of the light guide. This type of pattern variation will often give a good start-ing point for a uniform display, but is not sufficient to meet the final uni-formity requirements. Additional control of output uniformity can be obtained by allowing non-linear variation of extraction parameters.An approach that gives very flexible control with a minimum of parame-ters is to define the variation of a parameter in terms of a quadraticBezier curve. The LightTools 2D Zone Utility is used to set up nonlin-ear patterns.Figure 5 shows an example using painted light extraction in which three parameters (paint dot width, height, and vertical spacing) are var-ied to create variable extraction behavior.The output uniformity is shown in Figure 6. The slice on the right shows that the average output lumi-nance is constant.The second extraction method,molded light extraction, uses the 3D texture capability in LightTools . The 3D texture feature is designed to ray trace repetitive structures very effi-ciently and store the information very compactly. Models created using explicit geometry can trace more than 30 times slower and have model files more than 100 times larger than equivalent models cre-ated using 3D textures. Three differ-ent basic shapes are available: spheres, prisms, and pyramids (Figure 7).The Backlight Utility provides a means for setting up linearly varying patterns of the microstructure types.2.521.510.50510152025Bezier with Control NetZone NumberFigure 5. Variable Light Extraction Using Quadratic Bezier CurvesFigure 4. LightTools Backlight Design UtilityThe 3D Texture Utility can be used to vary the texture parameters non-linearly using a quadratic Bezier curve. An example where a groove microstructure (modeled using the prism 3D texture) is used as an extraction mechanism is shown in Figure8.The resulting light guide and its per-formance is shown in Figure 9. Optical Calculations for BacklightsTwo of the most important optical quantities for backlight displays are display luminance and illuminance uniformity on the top of the light guide. Calculation of luminous intensity and various colorimetric quantities (CIE coordinates andCCTs) are important as well.LightTools has built-in support forthese calculations and a number offeatures to aid in understanding theresults of the Monte Carlo simula-tions used to generate the data.Monte Carlo simulations are thefoundations of the illumination cal-culations in LightTools. It is gener-ally understood that random numbergenerators are used to pick startingray positions, directions, and wave-lengths to sample the light distribu-tions on the receivers. Theconvergence of the simulations canbe dramatically affected by how the“random” numbers are chosen.Using low discrepancy (Sobol) num-ber sequences, which are not randomat all, can improve the reduction oferror from to 1/N, where Nis the number of rays at the receiver.A comparison of colorimetric resultsusing random number sequences(Figure 10) and Sobol numbersequences (Figure 11) is shown onpage 6. For this case, it would take128,000 rays using a random num-ber generator to equal the accuracyof a 16,000-ray Sobol sequence sim-ulation. It is important to recognizethe simulation convergence speedwhen comparing different software,since it is the speed with which youget to a certain accuracy level, notthe speed it takes to trace a certainnumber of rays, that is important.Receivers in LightTools collect raydata for illumination calculations.1N⁄Figure 7. Sphere, Prism and Pyramid 3D Textures-0.4-0.2-0.00.20.440302010-0.4-0.2-0.00.20.440302010XXY Y403020100.00.10.20.30.4Figure 6. Output Uniformity of Backlight Using Paint DotsThe ray data is collected on data meshes for analysis and display. The user can interactively control the dimensions or number of bins in the data meshes. For a given num-ber of rays on the receiver, meshes with a small number of bins will have low spatial or angular resolu-tion but high relative accuracy (low error), while meshes with a large number of bins will have better reso-lution but lower accuracy (greater error). An error estimate can be dis-played for each bin in a mesh to help the user decide if enough rays have been traced in the simulation to meet the resolution and accuracy neces-sary to assess the design(Cassarly,W.J., Fest, E.C., andJenkins,D.G., 2002). If more raysare needed, the user may interac-tively continue the simulation untilthe goals are met.An important aspect of backlightanalysis involves ray splitting andscattering from the surfaces of thelight guide. The nature of the lightguide is that a ray can bounce aroundthe inside of the light guide numer-ous times prior to becomingabsorbed or exiting the guide. If aray is split into a transmitted andreflected part for each surface inter-action, an extremely large number ofsplit rays result, most of which carrylittle energy, thereby slowing theanalysis. An example of this isshown in Figure 12, which showsthe many paths of a single startingray due to beam splitting.A simulation was run where 2000rays were started from the sourceand, due to ray splitting, 277,948rays were collected on the receiver(Figure 13). Because most of therays reaching the receiver had littleenergy, the error for the result was42%.If, instead, one traces the ray proba-bilistically, with the probability of a-0.4-0.2-0.00.20.440302010-0.4-0.2-0.00.20.440302010XXY Y403020100100200300400 Figure 9. Light Guide Performance with Groove MicrostructureBezier with Control NetZone Number0.350.30.250.20.150.10.05010203040XFigure 8. Definition of a Groove Microstructureray transmitting or reflecting deter-mined by the Fresnel loss coeffi-cients or scattering properties at the surface, the bulk of the ray tracing time will be spent following the flow of the energy in the system, thereby speeding analysis. The results of a simulation where 200,000 rays were started from the source are shown in Figure 14. In this case 118,969 rays reached the receiver with an error estimate of 6% for the calculation. The probabilistic ray trace mode reduced the error in the calculation by 7x and, at the same time, reduced the calculation time by 42%.Finally, diffusers are sometimes used above the top surface of the light guide to improve the angular unifor-mity of the display. Because diffus-ers spread rays over a wide angle, few rays would be scattered into the luminance meter aperture, and cal-culating the luminance normal to the display as measured by a typical luminance meter would require an extremely large number of rays. LightTools provides for aim areas or aim cones to be associated with scat-tering surfaces to allow the user to indicate where the scattered ray sam-ples should be directed. This is a form of importance sampling and is another method for improving the convergence of a Monte Carlo simulation.Figure 15 shows a luminance meter and a backlight with a diffuser with-out an aim cone. Two thousand rays were traced from the source, and the luminance meter collected 40 rays, as shown by the raster plot of spatial luminance.The value of importance sampling can be seen in Figure 16, whichshows the same case but with an aim cone added to the diffuser. The aim cone is matched to the acceptance angle of the luminance meter aper-ture. When a ray is incident on the diffuser, LightTools will generate the scattered ray (with the flux into the aim area determined appropriately based on the full angular distribution of the diffuser model) into the aim cone, so that the luminance meter collects all of the scattered rays, thereby improving the convergence of the simulation. In this case, of the 2000 rays started, 1416 rays (71%) were collected by the luminance meter.Figure 11. Colorimetric Calculations using Sobol SequenceSobol: 16,000 raysFigure 12. Light Guide Traced with Ray SplittingFigure 10. Colorimetric Calculations using Random NumberRandom: 16,000 raysAdditionalConsiderationsBacklights are widely used with Liq-uid Crystal Displays (LCDs), which are polarizing components. The capability to model polarizing com-ponents such as linear polarizers and quarter wave plates and evaluate their effects via polarization ray trac-ing can be critical to the success of an analysis. LightTools provides simple linear polarizer and retarder models, as well as specification of polarization components by their Jones or Mueller matrices. The polarization ray tracing feature,which the user can enable when needed, tracks the polarization state of the ray as it propagates using a Stokes vector.It is often necessary to treat compo-nents with optical coating with vari-ous transmission, reflectance, and polarization properties. Coatings are defined in LightTools in terms of their performance, which is often the only information available to the user. The average or the individual S or P values of reflectance and transmittance can be specified interms of any two of the following parameters: angle of incidence, wavelength, X position, or Y posi-tion. A utility to convert coating stack definitions into the LightTools performance coating format is also available.While most backlights use printed or molded extraction techniques, other approaches are possible. One is to use scattering from particles in the light guide itself. If the particle sizes and density are controlled appropri-ately, Mie scattering from the parti-cles can efficiently extract light from the light guide (Tagaya, et al., 2001:6274). LightTools can simu-late volume scattering according tothe Mie theory for spherical particlesFigure 15. Spatial Luminance for Diffuser without Aim ConeFigure 13. Results of Ray Splitting SimulationFigure 14. Results of Probabilistic Ray Trace3280 East Foothill Boulevard, Pasadena, California 91107Telephone: (626) 795-9101 FAX: (626) 795-0184E-mail: service@ Web site: or according to a user defined angu-lar distribution.Exporting completed optical designs to CAD systems is often a necessary step toward manufacturing the light guide. Support of standardexchange formats such as STEP, SAT, or IGES is needed to accom-plish this. In the case of molded extraction designs, this also requires that the 3D texture definitions of the molded features be translated into explicit geometry for the dataexport, because data exchange stan-dards support the transfer of explicit geometry only. LightTools supports the standard formats and can option-ally export files with 3D textures converted to explicit geometry so that the entire backlight is repre-sented in the exchange file.SummaryThe field of backlight design contin-ues to evolve rapidly in response to market demand for better perfor-mance and reduced costs. This evolution is supported by the devel-opment of illumination design soft-ware with features specifically intended to reduce the design cycle time for new backlight development. Key features in LightTools address-ing model creation and size, ray trace and simulation time, and calcu-lation of a wide range of optical parameters relevant to the design of backlights have been identified and demonstrated.Version 5.0 of LightTools , available in 2004, will add noise-tolerant illu-mination optimization to the features aimed at backlight designers. This will allow light extraction patterns, which maximize power and unifor-mity, to be determined automati-cally.ReferencesCassarly, W. J., E. C. Fest, D. G. Jen-kins, “Error estimation and smooth-ing of 2D illumination andchromaticity distributions,” SPIE Proc ., V ol. 4769, 2002.Tagaya, A., M. Nagai, Y . Koike, K. Yokoyama, “Thin Liquid-Crystal Display Backlight System with Highly Scattering Optical Transmis-sion Polymers,” Applied Optics-OT , Vol. 40, Dec. 2001.Figure 16. Spatial Luminance for Diffuser with Aim Cone。
LightTools在LED背光设计中的应用金鹏1,叶浩21.北京大学深圳研究生院2.莎益博设计系统商贸(上海)有限公司摘要:在背光的设计中,一个主要的目标和挑战是保证在垂直于光的传播方向上提升光的利用效率。
在背光模组中,是通过导光板来实现这一过程的,设计的关键就在于找到一种合理的网点分布以获得均匀的亮度分布。
利用光学软件模拟可以自动优化这一过程从而简化设计流程。
关键词:背光模组;导光板;LightTools;自动优化中图分类号:文献标识码:The application of LightTools in LED backlights design(Peng Jin; Shenzhen Graduate School, Peking UniversityHao Ye; Cybernet CAE Systems(Shanghai)Co., Ltd)Abstract:In the backlight design, a major goal and challenge is to ensure that light efficiency has been enhanced in the direction that is perpendicular to the propagation direction of light. In the backlight module, this process is achieved through the light guide plates. the key of the design is to find a reasonable distribution of nodes to obtain uniform brightness distribution. Optical software can automatically optimize and simplify this design processKeywords:backlight module; light guide plate; LightTools; automatic optimization1 引言近年来液晶显示器(LCD)获得迅速发展,并逐渐以主流产品出现在显示市场,相应的,作为LCD显示的核心技术之一的背光源技术也得到了很大的发展【1】。
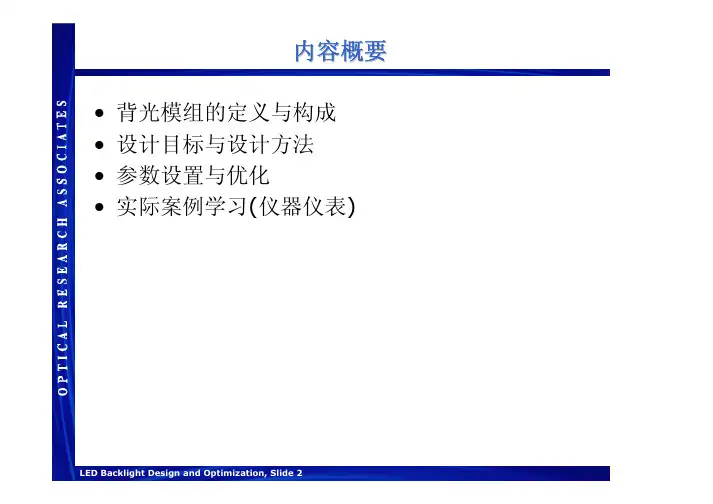
内容概要•背光模组的定义与构成•设计目标与设计方法•参数设置与优化•实际案例学习(仪器仪表)背光模组的定义•一般构成–导光板•通常其材料为塑料•注射成型或印刷式的网点(导光板下表面)–光源和反射罩•(典型光源CCFL and LED )–其他常用的光学元件扩散片(可提高均匀性)反射片•一些元件能否被使用取决于它的尺寸大小和成本以及其它要求Schematic of a typical backlight designLight source Light guideDiffuserReflectorAppliquéTransparency主要设计目标•在垂直光的传播方向上提升光的利用效率Light SourcePreferred direction of light extractionDirection of light propagationLight guideLight extraction from a light guide设计过程: 均匀性•光能量的传播是随导光板的长度变化的-出光的提取效率要随导光板的长度的增加而增加•改变光提取效率的方法:-改变网点密度,网点大小, 网点排布间距Distance from the sourceAvailable powerExtraction efficiencyUniform output背光网点设计•网点模型:印刷式的或注射成型的网点在背光设计中经常用到这两种网点来获得亮度均匀的背光•最佳的设计参数是优化后得到的网点密度分布Pattern Generator+CADIllumination SoftwareOutputOKUnacceptable优化过程通过不断反复调整网点参数进行优化,可以得到最终最佳的亮度与均匀性。
-可以通过做样品或软件模拟来完成光线追迹后输出模拟结果对比输出结果与初始要求网点参数设置计算新的网点更新模型完成OKNot OK网点参数的确定–为避免产生莫尔条纹,每个区域网点的密度是不一样的网点参数确定方法:–定义网点密度为二维网格值–定义网格值•网点的大小为变量•网点的数量和大小都为变量假设给定网点大小与形状通过计算在一个区域内变化网点的数量,得到想要的网点密度–网点密度的变化应该是缓慢而平滑的–人眼对突变是很敏感的,对渐变却不敏感变化网点数量的其他方法–分子动力学方法–多联骨牌法Mosaic Structure withObservableRectilinear Substructure Smooth Variation withObservableRectilinear SubstructureSmooth Variation withSinusoidal Shifts假设给定网点位置排布–经常用的排布一般为六角形通过计算在一个区域内变化网点的大小通过计算在一个区域内变化网点的大小,,得到想要的网点密度–出光的效率和网点排布的密度是成比例的Mosaic Structure using Hexagonal Pattern Smooth Variation using Hexagonal Pattern Smooth Variation using Rectilinear Pattern网点可以在位置的附近移动偏移网点可以在位置的附近移动偏移,,进行随机的变化, 但并不会重叠–也可以对网点的大小进行随机控制Dither X,Y=1,0Dither X,Y=0,1Dither X,Y=1,1Dither X,Y=0,0Dither X,Y=.2,.2Dither X,Y=.5,.5光线追迹与模拟评估此商业照明软件可以对背光进行设计模拟评估–运用蒙特卡罗随机光线追迹的方法来进行光度计算和模拟–模拟结果的精确度取决于光线追迹的数量和分辨率的高低高分辨率低精度低分辨率高精度高分辨率高精度--更多的光线--模拟评估可以使用优化函数进行模拟可以使用优化函数进行模拟,,比较输出结果与要求比较输出结果与要求,,进行评估-可使用优化函数限定统计噪声的最小值•当达到设计目标时可以中止优化函数•可增加光线的数目MF = ∑W i 2(V i -T i )2W i = Weight of i th MF item V i = Current Value of i th MF item T i = Target of i thMF itemLuminancewith 10,000 RaysLuminancewith1,000,000 RaysMF = ∑W i 2(V i + ∈i -T i )2MF = ∑W i 2(V i -T i )2 +Noise网点优化•BPO 通过改变网点的间距和大小来达到设计的要求•网点优化可以是2维的平面网点也可以是3维的网点•我们可以定义个接收面来接收并计算背光板表面的亮度和照度BPO 自动优化网点的过程•BPO 提供有效的优化网点的过程方法案例1: 印刷式导光板的网点优化在开始的时候使用均匀的印刷式网点进行优化得到合理的网点参数Small Source(e.g., LED)2D Display案例2: 注射成型网点的优化–网点大小相同,对排布的位置做优化处理来提高光的利用效率–这个例子是使用注射成型的网点进行优化LEDStartFinalTexture Density Output案例3: 两个LED, 非对称排布•使用注射成型的网点排布•两个LED–LED 采用非对称排布LEDsStartFinalTexture Density Output案例4: 两个LED, 对称排布•使用注射成型的网点排布•两个LED–LED 采用对称排布LEDsStartFinalTexture Density OutputSetupBitmap AppliquéSide ViewTop ViewLEDTextureAcrylic Light PipeBlue Filteron kph Appliqué•如下位图是作为优化的目标illuminance inthe blackregionsOptimization Results15 minutes2.33Ghz processor100,000 rays/iteration Iteration 1Iteration 2Iteration 3Iteration 4Iteration 5Iteration 6•模拟结果Illuminance Chart (1M rays) PhotoRealistic Rendering (100M rays)亮点边缘照明不足•需要新的目标区域设定全覆盖整个面积原有仪表盘结构新的仪表盘结构•最后的结果Photorealistic Rendering (100M rays)结论•网点的优化和模型设置及参数类型选择有紧密联系•介绍了用LightTools 进行设计和分析的一个汽车仪表盘背光的例子。

光电工程实践—照明系统光学设计院系:年级专业:姓名:学号:指导教师:职称:2015年6月一、课程设计的目的、任务与要求目的:使学生掌握照明系统设计的基本知识,培养学生进行照明系统设计的技能,通过该课程设计,要求学生会对照明系统进行初始设置、物体模型的建立、光源的设置、进行一些简单的照明系统的设计。
任务:将学生已有的一些光度学、LED相关的知识,结合照明设计的学习,融合到一些简单的照明系统的设计中来,完成一些简单的照明系统设计。
要求:掌握和照明系统设计相关联的一些基本理论知识,掌握照明设计软件的使用方法,要求会根据给定的任务进行实际设计并对照明系统进行优化。
二、课程设计的设计目标1、利用lighttools设计一个矿灯反光杯,用于在矿灯前方形成集中的光斑以照明。
LED光源发光全角度为170度;反光杯内表面反射,孔径为78mm,在距离光源1000mm处形成100mm左右的圆形光班。
2、设计一个TIR透镜,透镜可以对小角度的光线进行处理,从而减小LED发光角度,实现准直均匀照明。
三、设计过程3.1矿灯反光杯设计过程3.1.1立方体积光源尺寸0.2*1*1;坐标位置(0,0,0)角度(0,0,0),Z坐标为0;出射度100lm;定位面:下角度85°,由发光全角度170°决定的。
3.1.2通过单片式镜头设计反光杯放置平板光学元件坐标(0,0,-10)角度(0,0,0);反光杯在光源左侧,即坐标-10位置;平板为直径为78mm的圆形,与孔径值是一样的;厚度0.1mm即可将其后表面设置为二次曲面面型,曲面系数C为-1,半径给初始值R为15,凹面;将后表面的光学属性设置为简单反射镜,使反光杯的内表面反光;将边的光学属性改为平滑光学,使边透明,方便在3D图形中看清元件的结构,如图3-1a。
接收表面建立虚拟表面,其坐标为(0,0,1000)角度为(0,0,0);接收面为半径为60mm的圆形,添加接收器。
LightTools软件在均匀光分布的照明系统设计中的应用胡志威;彭润玲;秦汉;林朋飞【摘要】以模拟单颗LED的均匀配光为例,介绍了LightTools软件在照明系统设计中的应用,以便更进一步地掌握和使用LightTools软件.文中借助LightTools软件,在单颗LED上建立反光杯模型,在反光杯出光口建立透镜阵列,并在目标照射面上建立目标区域的强度网格,通过LightTools软件的优化模块进行优化后,可在目标区域得到均匀的光强分布.利用LightTools 软件进行辅助设计和优化模拟,具有很高的可信度,也可以大大缩短照明设计的周期.%With the simulation of single LED light distribution even as an example, LightTools software in lighting system design of the application is introduced in order to further control and use LightTools software. With LightTools software, a reflector model is established above a single LED component and lens array is made on the exit of the reflector, then an intensity mesh for a certain region of the target surface is established After optimization in LightTools, the intensity distribution can be uniform in the target area. The design and optimization with LightTools demonstrate high credibility, and the lighting design cycle could also be greatly shortened.【期刊名称】《光学仪器》【年(卷),期】2012(034)004【总页数】5页(P49-53)【关键词】均匀光强;透镜阵列;照明设计;LightTools【作者】胡志威;彭润玲;秦汉;林朋飞【作者单位】上海理工大学光电信息与计算机工程学院,上海200093;上海理工大学光电信息与计算机工程学院,上海200093;上海理工大学光电信息与计算机工程学院,上海200093;上海理工大学光电信息与计算机工程学院,上海200093【正文语种】中文【中图分类】TH741.4引言与传统光源相比,LED光源具有寿命长、能耗低、响应时间短等优点,它是21世纪具有竞争力的新型固体光源,正逐渐取代传统光源[1]。
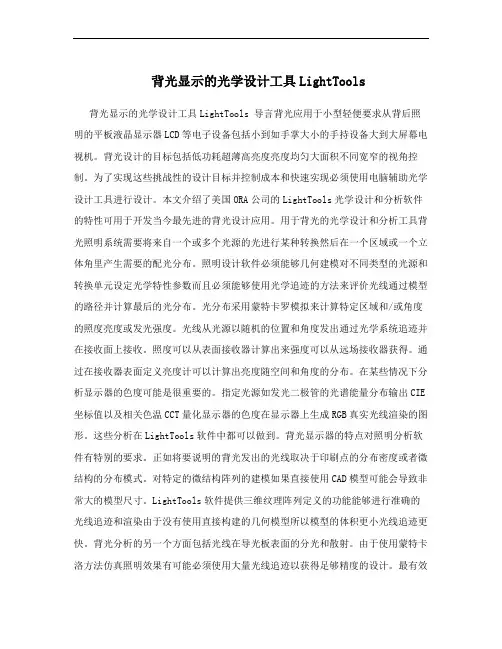
背光显示的光学设计工具LightTools 背光显示的光学设计工具LightTools 导言背光应用于小型轻便要求从背后照明的平板液晶显示器LCD等电子设备包括小到如手掌大小的手持设备大到大屏幕电视机。
背光设计的目标包括低功耗超薄高亮度亮度均匀大面积不同宽窄的视角控制。
为了实现这些挑战性的设计目标并控制成本和快速实现必须使用电脑辅助光学设计工具进行设计。
本文介绍了美国ORA公司的LightTools光学设计和分析软件的特性可用于开发当今最先进的背光设计应用。
用于背光的光学设计和分析工具背光照明系统需要将来自一个或多个光源的光进行某种转换然后在一个区域或一个立体角里产生需要的配光分布。
照明设计软件必须能够几何建模对不同类型的光源和转换单元设定光学特性参数而且必须能够使用光学追迹的方法来评价光线通过模型的路径并计算最后的光分布。
光分布采用蒙特卡罗模拟来计算特定区域和/或角度的照度亮度或发光强度。
光线从光源以随机的位置和角度发出通过光学系统追迹并在接收面上接收。
照度可以从表面接收器计算出来强度可以从远场接收器获得。
通过在接收器表面定义亮度计可以计算出亮度随空间和角度的分布。
在某些情况下分析显示器的色度可能是很重要的。
指定光源如发光二极管的光谱能量分布输出CIE 坐标值以及相关色温CCT量化显示器的色度在显示器上生成RGB真实光线渲染的图形。
这些分析在LightTools软件中都可以做到。
背光显示器的特点对照明分析软件有特别的要求。
正如将要说明的背光发出的光线取决于印刷点的分布密度或者微结构的分布模式。
对特定的微结构阵列的建模如果直接使用CAD模型可能会导致非常大的模型尺寸。
LightTools软件提供三维纹理阵列定义的功能能够进行准确的光线追迹和渲染由于没有使用直接构建的几何模型所以模型的体积更小光线追迹更快。
背光分析的另一个方面包括光线在导光板表面的分光和散射。
由于使用蒙特卡洛方法仿真照明效果有可能必须使用大量光线追迹以获得足够精度的设计。

先搞个序言天气冷大家多穿点衣服。
今年气候比较异常,感冒病毒变种显著增多。
千万不要在这个时候感冒,否则,你可能会是下一种猪流感的创始人。
如果别人家破人亡了,你要记得,那是你干的。
关于背光源信息显示如今这个社会有很多种信息显示技术,其中一些被用于照明显示。
我们今天所广泛使用的平板显示是基于LCD显示技术的,它通常都需要一个叫做背光源的照明系统。
这一章我们将通过一个简单的例子来介绍背光源设计,这个过程中可能会占用一部分内存。
一个背光源系统的大体结构如下图所示:·Light source(光源)。
正如这篇文章中的例子里,光源通常都是一个带有反射镜的冷阴极射线管(CCFL)。
而对于小型的显示器则一般使用一个到多个LED。
·Rectangular light guide(矩形导光板)。
它通常被人们叫做导光管,用来传输从边缘光源发出的用于照明液晶板的光线。
·Additional layers(增光板)。
许多背光系统利用显示器前面的散射或者增光装置(BEF)来适当的改变光照的均匀性和角度。
这个设计的重点在于把光线传输到垂直于原来的传播方向,这样就可以更好的为导光板上面的LCD液晶板提供照明。
这里有许多种传输方式,其中一些将会在backlight tutorial(背光指南)中描述和示范。
其中最主要的两种方式是印刷式输出(paint dots)和模型化输出(3D texture)。
不过这两种输出方式都依赖于lighttools中的property zone。
设计一个数字图像显示器在这篇文章的例子里,我们假定一个廉价的数字图像显示设备。
它由一个照明范围为3.5×5 inch(88.9×127mm)组成,附带一个存储记忆卡槽,这样你可以利用它来显示存储在一个数码相机里或个人电脑里的数字照片。
对于这些图片,控制操作等等,它具有充分的处理能力。
这个例子里不打算介绍这个设备里的包装,电源,处理器等器件,只是尽量简洁的描述显示器。
厦门理工学院光电工程课程设计实践—Lighttools设计应用————————————————————————————————作者:————————————————————————————————日期:光电工程实践—照明系统光学设计院系:年级专业:姓名:学号:指导教师:职称:2015年6月一、课程设计的目的、任务与要求目的:使学生掌握照明系统设计的基本知识, 培养学生进行照明系统设计的技能, 通过该课程设计, 要求学生会对照明系统进行初始设置、物体模型的建立、光源的设置、进行一些简单的照明系统的设计。
任务: 将学生已有的一些光度学、LED相关的知识,结合照明设计的学习,融合到一些简单的照明系统的设计中来,完成一些简单的照明系统设计。
要求:掌握和照明系统设计相关联的一些基本理论知识,掌握照明设计软件的使用方法,要求会根据给定的任务进行实际设计并对照明系统进行优化。
二、课程设计的设计目标1、利用lighttools设计一个矿灯反光杯,用于在矿灯前方形成集中的光斑以照明。
LED光源发光全角度为170度;反光杯内表面反射,孔径为78mm,在距离光源1000mm处形成100mm左右的圆形光班。
2、设计一个TIR透镜,透镜可以对小角度的光线进行处理,从而减小LED发光角度,实现准直均匀照明。
三、设计过程3.1矿灯反光杯设计过程3.1.1立方体积光源➢尺寸0.2*1*1;➢坐标位置(0,0,0)角度(0,0,0),Z坐标为0;➢出射度100lm;➢定位面:下角度85°,由发光全角度170°决定的。
3.1.2通过单片式镜头设计反光杯放置平板光学元件➢坐标(0,0,-10)角度(0,0,0);➢反光杯在光源左侧,即坐标-10位置;➢平板为直径为78mm的圆形,与孔径值是一样的;➢厚度0.1mm即可将其后表面设置为二次曲面面型,曲面系数C为-1,半径给初始值R为15,凹面;➢将后表面的光学属性设置为简单反射镜,使反光杯的内表面反光;➢将边的光学属性改为平滑光学,使边透明,方便在3D图形中看清元件的结构,如图3-1a。
LightTools设计实例--汽车仪表盘导光按钮设计LightTools自带增光片元件库和光源库,其增光片元件库包括3M公司所有的BEF和DBEF;其光源库包括4大LED公司(Agilent, Lumileds,Nichia,Osram)的近400种LED光源,对设计LED照明的LCDTV有极大的方便。
传统导光板的网点设计更是及其方便,既可以模拟二维印刷点排布,也可以模拟三维的微结构铺设,目前微结构网点包括五种形状:球、棱镜、金字塔、圆锥、圆柱,极大的提高设计者的工作效率。
Cybernet中国使用LightTools对汽车仪表盘导光按钮的设计如下:重点:采用两颗小功率LED,实现导光按钮上的三个字母均匀发光。
设计步骤1.LED光源模拟仿真2.导光按钮的几何建模3.几何模型的材料属性、光学属性设定4.受光分析面,亮度计的设置5.光线追迹,结果分析6.根据分析结果修改按钮的几何模型,重复光线追迹过程,直至模拟仿真结果达到系统设计要求。
(采用LT的优化模块,可代替繁琐的模型更改,缩短项目开发周期)针对LED光源仿真这里简单说明一下参数,光源模型中都有详尽的参数设定以下介绍主要的参数(根据模拟目的不同,需要的参数也不同)•光束(lm)或者是辐射功率(mW)•光谱特性•配光分布•空间強度分布根据波长范围进行光源定义•LightTools可以高效灵活的设定光源.•LightTools可以提出包含面,体积的面光源和体积光源的定做方案.•LightTools中Ray Data的设定,可以使用Radiant Imaging测定的光源.•以放射量或测光能量为单位可以在光源中定义全部光能量.•用户定义的Aim领域和Aim锥体可以引出最佳性能.•为了配合这个高效的功能,计划在光源中定义连续的光谱.LightTools在导光按钮的几何建模上更有强大的内置建模能力通过Solidworks Link模块 LightTools完全继承来自SolidWorks的特征树可为使用过Solidworks的工程师提供熟悉的设计环境。
网点设计编制部门:研发部适用区域:□全公司 ■其它:研发部发布范围:研发部培训岗位:研发部执行负责人:流程Owner:文件批准人:生效日期:年 月 日填写说明:1、“执行负责人”由起草人手签姓名,“流程Owner”由编制部门负责人手签姓名,“文件批准人”需要编制部门上级领导手签姓名。
2、适用区域、发布范围、培训岗位、生效日期需要执行负责人进行勾选或者填写。
所属部门 研发部流程Owner页码2 / 131、 目的规范导光板网点设计作业流程。
2、 范围适用于研发部导光板网点设计。
3、 职责研发部结构工程师导光板设计参考文件,4、 管理条例4.1 流程图:4.2 作业流程说明: 4.2.1 建模:1) 直接利用LightTools 的3D 建模功能建模光学元件建模 结构元件建模所属部门 研发部流程Owner页码3 /132) 使用其他CAD 软件建模 (如AutoCAD ,Pro/E,CATIA,UG 等),再以IGS,STEP ,SAT 格式导入。
4.2.2 导光板texture建立:4.2.3 导光板及2D/3D Texture 表面特性设置.依次点开菜单。
2DTexture 建立: 3DTexture 建立:123所属部门 研发部 流程Owner 页码 4 / 134.2.4 Texture特性设置,依次点开菜单。
1 2所属部门 研发部 流程Owner 页码 5 / 134.2.5 反射片表面特性设置所属部门 研发部 流程Owner 页码 6 / 134.2.6 扩散板光学特性设置所属部门 研发部流程Owner页码7 / 134.2.7 光源建立,光源建立是决定模拟准确度的关键,大多数背光模组使用两种光源:CCFL 、LED在Lighttools 中可以利用三种方式来建构光源:1) 整体光源模型在lighttools 中建立,最准确,但必须知道光源的结构,大厂商如PHILIPS ,OSRAM ,CREE 一般可以提供。
L i g h t T o o l s设计实例汽车仪表盘导光按
钮设计
LightTools设计实例--汽车仪表盘导光按钮设计
LightTools自带增光片元件库和光源库,其增光片元件库包括3M公司所有的BEF和DBEF;其光源库包括4大LED公司(Agilent, Lumileds,Nichia,Osram)的近400种LED光源,对设计LED照明的LCDTV有极大的方便。
传统导光板的网点设计更是及其方便,既可以模拟二维印刷点排布,也可以模拟三维的微结构铺设,目前微结构网点包括五种形状:球、棱镜、金字塔、圆锥、圆柱,极大的提高设计者的工作效率。
Cybernet中国使用LightTools对汽车仪表盘导光按钮的设计如下:
重点:采用两颗小功率LED,实现导光按钮上的三个字母均匀发光。
设计步骤
1.LED光源模拟仿真
2.导光按钮的几何建模
3.几何模型的材料属性、光学属性设定
4.受光分析面,亮度计的设置
5.光线追迹,结果分析
6.根据分析结果修改按钮的几何模型,重复光线追迹过程,直至模拟仿真
结果达到系统设计要求。
(采用LT的优化模块,可代替繁琐的模型更改,缩短项目开发周期)
针对LED光源仿真这里简单说明一下参数,光源模型中都有详尽的参数设定以下介绍主要的参数(根据模拟目的不同,需要的参数也不同)•光束(lm)或者是辐射功率(mW)
•光谱特性
•配光分布
•空间強度分布
根据波长范围进行光源定义
•LightTools可以高效灵活的设定光源.
•LightTools可以提出包含面,体积的面光源和体积光源的定做方案.
•LightTools中Ray Data的设定,可以使用Radiant Imaging测定的光源.
•以放射量或测光能量为单位可以在光源中定义全部光能量.
•用户定义的Aim领域和Aim锥体可以引出最佳性能.
•为了配合这个高效的功能,计划在光源中定义连续的光谱.
LightTools在导光按钮的几何建模上更有强大的内置建模能力
通过Solidworks Link模块 LightTools完全继承来自SolidWorks的特征树可
为使用过Solidworks的工程师提供熟悉的设计环境。
双向式数据交流功能保证
了在LightTools 和Solidworks中的特征实时同步。
高精确度的仿真结果比较
下方图片是照明解析的结果,对应从按钮中文字的位置(受光面)发射出的光线的照度分布输出。
对应上图的矩形图,用不同的颜色表示能量的大小。
从如下照度分布图中我们可以分析此系统的仿真结果基本达到设计要求。
蒙特卡罗光线追迹
LED光源,按钮模型,受光面参数均设定好之后方可进行光学仿真,仿真采用蒙特卡罗光线追迹。