模式识别-第二章聚类分析
- 格式:ppt
- 大小:3.11 MB
- 文档页数:36

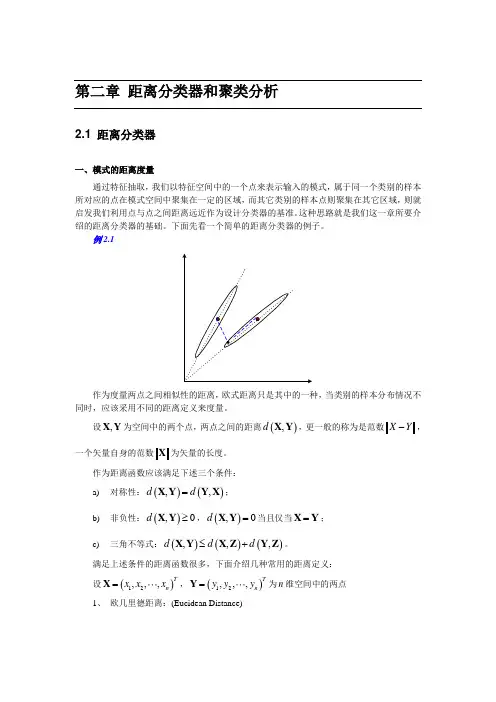
第二章 距离分类器和聚类分析2.1 距离分类器一、模式的距离度量通过特征抽取,我们以特征空间中的一个点来表示输入的模式,属于同一个类别的样本所对应的点在模式空间中聚集在一定的区域,而其它类别的样本点则聚集在其它区域,则就启发我们利用点与点之间距离远近作为设计分类器的基准。
这种思路就是我们这一章所要介绍的距离分类器的基础。
下面先看一个简单的距离分类器的例子。
例2.1作为度量两点之间相似性的距离,欧式距离只是其中的一种,当类别的样本分布情况不同时,应该采用不同的距离定义来度量。
设,X Y 为空间中的两个点,两点之间的距离(),d X Y ,更一般的称为是范数X Y -,一个矢量自身的范数X 为矢量的长度。
作为距离函数应该满足下述三个条件: a) 对称性:()(),,d d =X Y Y X ;b) 非负性:(),0d ≥X Y ,(),0d =X Y 当且仅当=X Y ; c) 三角不等式:()()(),,,d d d ≤+X Y X Z Y Z 。
满足上述条件的距离函数很多,下面介绍几种常用的距离定义: 设()12,,,Tn x x x =X ,()12,,,Tn y y y =Y 为n 维空间中的两点1、 欧几里德距离:(Eucidean Distance)()()1221,ni i i d x y =⎡⎤=-⎢⎥⎣⎦∑X Y2、 街市距离:(Manhattan Distance)()1,ni i i d x y ==-∑X Y3、 明氏距离:(Minkowski Distance)()11,mnm i i i d x y =⎡⎤=-⎢⎥⎣⎦∑X Y当2m =时为欧氏距离,当1m =时为街市距离。
4、 角度相似函数:(Angle Distance)(),T d ⋅=X YX Y X Y1nTi i i x y =⋅=∑X Y 为矢量X 和Y 之间的内积,(),d X Y 为矢量X 与Y 之间夹角的余弦。
模式识别中的聚类分析方法聚类分析是一种常用的机器学习方法,用于将大量数据分为不同的类别或群组,并在其中寻找共性和差异性。
在模式识别中,聚类分析可以帮助我们理解数据集中不同对象之间的关系,以及它们之间的相似性和差异性。
本文将介绍聚类分析的基本概念、算法和应用,以及一些实用的技巧和方法,以帮助读者更好地理解和应用这一方法。
一、聚类分析的基础概念在聚类分析中,我们通常会面对一个数据点集合,其特征被表示为$n$个$d$维向量$x_{i}=(x_{i1},x_{i2},…,x_{id})$。
聚类分析的目标是将这些数据点划分为$k$个不同的类别或群组$G_{1},G_{2},…,G_{k}$,并使得同一类别中的数据点相似性较高,不同类别之间的相似性较低。
为了完成这个任务,我们需要先定义一个相似性度量方法,用于计算数据点之间的距离或相似度。
常用的相似性度量方法包括欧式距离、余弦相似度、Jaccard相似度和曼哈顿距离等,具体选择哪一种方法取决于我们要研究的数据类型和应用要求。
定义了相似性度量方法后,我们可以使用聚类算法将数据点分成不同的类别。
聚类算法的主要分类包括层次聚类和基于中心点的聚类。
层次聚类是通过自下而上的方法将数据点归属到不同的类别中,以便于构建聚类树或聚类图。
基于中心点的聚类则是通过不断地计算每个数据点离其所属类别的中心点的距离来更新类别簇,直到收敛为止。
通常来说,基于中心点的聚类算法更快且更易于应用,因此被广泛应用于实际问题中。
二、聚类分析的主要算法1. K-means 聚类算法K-means 聚类算法是一种基于中心点的聚类算法,其核心思想是通过不断更新每个数据点所属的类别,同时更新该类别的中心点,直到找到最优的聚类结果。
具体而言,K-means 聚类算法首先需要预设$k$个初始的聚类中心点,然后计算每个数据点与这$k$个聚类中心的距离,并将其分配到最近的一个聚类中心点所代表的类别中。
完成初始聚类后,算法会重新计算每个类别的中心点,并根据新的中心点重新分配所有数据点,直到所有数据点都不再变换为止。
毕业设计(论文) 模式识别中聚类分析算法综述院别专业名称信息与计算科学班级学号学生姓名指导教师2013年06月10日模式识别中聚类分析算法综述摘要聚类分析是将数据分类到不同的类或者簇的过程,聚类分析是一种探索性的分析,在分类的过程中,人们不必事先给出一个分类的标准,聚类分析能够从样本数据出发,自动进行分类。
从实际应用的角度看,聚类分析是数据挖掘的主要任务之一。
而且聚类能够作为一个独立的工具获得数据的分布状况,观察每一簇数据的特征,集中对特定的聚簇集合作进一步地分析。
聚类分析还可以作为其他算法(如分类和定性归纳算法)的预处理步骤。
本文对模式识别中聚类分析算法进行了综述,主要论述了顺序算法、层次算法和基于代价函数最优的聚类算法,其中层次算法分为合并算法和分裂算法,其中合并算法又包括最短距离法、最长距离法、中间距离法、重心法、类平均距离法;而基于代价函数最优的聚类算法则分为K均值算法和迭代自组织的数据分析算法。
本文首先介绍了聚类算法的应用范围及其意义,并对聚类算法的基本分类进行了简单介绍,同时对可能聚类的数量进行了阐述。
之后,详细介绍了上述各类算法的算法思想及其具体的实现步骤,并在顺序算法一章中给出了BSAS算法的改进,并运用MATLAB对层次算法和基于代价函数最优的聚类算法中的几个具体算法进行了代码实现,通过对样品图片的识别分类认识了聚类算法的具体应用,并且认识到了几类算法各自的特点。
其中,层次算法中的五个算法实现步骤较为简单,但在其实现过程中需要输入一个合适的阈值,阈值的大小直接影响最后的结果,而且相同的阈值,不同的算法可能得到不同的结果。
而K均值算法的实现结果则与阈值无关,只需定义迭代次数和类中心个数。
与之相比,ISODATA 算法则具有自组织性,会在计算过程中不断调整类中心的个数。
关键词:聚类分析,顺序算法,层次算法,基于代价函数最优的聚类算法The Overview of Pattern Recognition Clustering AlgorithmAuthor:WhuenkmnknTutor:CnunnknhcfjujAbstractCluster analysis is a data classification into different classes or clusters in the process, Cluster analysis is an exploratory analysis, in the classification process, people do not give a classification criterion in advance, cluster analysis to the data from the sample starting, automatic classification. From a practical perspective, Cluster analysis is one of the main tasks of data mining. Moreover clustering can be used as a separate tool to obtain the distribution of the data, observe characteristics of the data in each cluster and make a further analysis on particular clustered sets. Cluster analysis can also be used as other algorithms’(such as classification and qualitative induction algorithm) preprocessing step.In this paper, clustering algorithms in pattern recognition are reviewed, mainly discussing the sequential algorithm, hierarchical algorithms and clustering algorithm based on cost function optimization. Hierarchical algorithm is divided into division algorithm and merging algorithm, which also includes the shortest distance algorithm, the longest distance algorithm, the middle distance algorithm, center of gravity algorithm, the class average distance algorithm; while the clustering algorithm based on cost function optimization is divided into K-means algorithm and iterative self-organizing data analysis algorithms. At first this paper describes the application of clustering algorithm and its significance, and give a brief introduction of the basic clustering algorithm, while the possible number of clusters are described. And then the algorithm ideas and concrete steps to achieve of various algorithms above are detailed. At the same time, the improved BSAS algorithm is gave in the chapter about the sequential algorithm and several specific algorithms in the hierarchical clustering algorithm and the algorithm based on cost function optimization are coded by MATLAB. Through identifying sample images, I get to know the specific application and the characteristics of different clustering algorithms. The five specific hierarchical algorithms’ are easy to achieve by several simple steps, while its implementation process need to enter an appropriate threshold value. The threshold value directly affects the final clustering results and different algorithms may produce different results with the same threshold value. While the results of K-means algorithm is independent of the threshold, simply define the number ofiterations and the number of cluster center. In contrast, ISODATA algorithm is self-organization and will adjust the number of cluster center continuously during the calculation process.Key Words: Cluster Analysis, Sequential Algorithm, Hierarchical Algorithm, Clustering Algorithm Based on Cost Function Optimization目录1 绪论 (1)课题背景及意义 (1)聚类算法的种类 (1)可能聚类的数量 (2)2 聚类算法Ⅰ:顺序算法 (4)基本顺序算法方案描述 (4)聚类数的估计 (5)2.3 BSAS的改进 (6)2.4 改进阶段 (7)3 聚类算法Ⅱ:层次算法 (9)合并算法 (9)最短距离法 (10)最长距离法 (11)中间距离法 (12)重心法 (12)类平均距离法 (13)分裂算法 (14)4 聚类算法Ⅲ:基于代价函数最优的聚类算法 (16)K均值算法 (16)迭代自组织的数据分析算法 (16)结论 (19)致谢 (20)参考文献 (20)附录 A (20)附录 B (24)1 绪论将物理或抽象对象的集合分成由类似的对象组成的多个类的过程被称为聚类。
第二章 聚类分析2.1 聚类分析的相关概念定义 对一批没有标出类别的模式样本集,按照样本之间的相似程度分类,相似的归为一类,不相似的归为另一类,这种分类称为聚类分析,也称为无监督分类。
模式相似/分类的依据把整个模式样本集的特征向量看成是分布在特征空间中的一些点,点与点之间的距离即可作为模式相似性的测量依据。
聚类分析是按不同对象之间的差异,根据距离函数的规律(大小)进行模式分类的。
聚类分析的有效性聚类分析方法是否有效,与模式特征向量的分布形式有很大关系。
若向量点的分布是一群一群的,同一群样本密集(距离很近),不同群样本距离很远,则很容易聚类;若样本集的向量分布聚成一团,不同群的样本混在一起,则很难分类;对具体对象做聚类分析的关键是选取合适的特征。
特征选取得好,向量分布容易区分,选取得不好,向量分布很难分开。
两类模式分类的实例:一摊黑白围棋子 选颜色作为特征进行分类,用“1”代表白,“0”代表黑,则很容易分类;选大小作为特征进行分类,则白子和黑子的特征相同,不能分类(把白子和黑子分开)。
特征选择的维数在特征选择中往往会选择一些多余的特征,它增加了维数,从而增加了聚类分析的复杂度,但对模式分类却没有提供多少有用的信息。
在这种情况下,需要去掉相关程度过高的特征(进行降维处理)。
降维方法设有N 个样本,它们的特征维数是n ,则有n*n 维的相关矩阵R = [ r ij ]nxn 其中,r ij 是第i 维与第j 维特征之间的相关系数:jjii ij ij r σσλ= 这里:σii 和σjj 分别是第i 个和第j 个分量的标准差,λij 是第i 个和第j 个分量的协方差。
分析:(1)根据相关系数的性质:1r 0ij ≤≤(利用柯西不等式证明)(2)r ij =0:表示两个分量完全不相关(3)r ij =1:表示两个分量完全相关结论:若rij->1,则表明第i 维特征与第j 维特征所反映的特征规律接近,因此可以略去其中的一个特征,或将它们合并为一个特征,从而使维数降低一维。