低相干干涉仪及相应光纤传感器的研究
- 格式:pdf
- 大小:203.54 KB
- 文档页数:5
《干涉型光纤振动传感器定位精度及解调算法研究》篇一一、引言光纤振动传感器是现代工业安全监测和物联网应用中的重要设备之一,它通过感知外界振动信号来传递信息。
其中,干涉型光纤振动传感器因其高灵敏度、抗电磁干扰等优点,在诸多领域得到广泛应用。
然而,其定位精度及解调算法的优化一直是研究的热点和难点。
本文将针对干涉型光纤振动传感器的定位精度及解调算法进行研究,为进一步提高传感器的性能提供理论依据和技术支持。
二、干涉型光纤振动传感器的工作原理及特性干涉型光纤振动传感器主要利用光干涉原理进行工作。
当光在光纤中传播时,外界振动会使得光纤发生微小形变,进而导致光程差的改变,产生干涉现象。
通过检测这种干涉信号,可以实现对振动信息的感知和传输。
干涉型光纤振动传感器具有高灵敏度、抗电磁干扰、长距离传输等优点,但同时也存在定位精度受多种因素影响的问题。
三、定位精度影响因素分析干涉型光纤振动传感器的定位精度受多种因素影响,主要包括以下几个方面:1. 光纤形变的不均匀性:由于外界振动作用在光纤上,使得光纤发生形变,而形变的不均匀性会导致干涉信号的失真,从而影响定位精度。
2. 噪声干扰:在实际应用中,传感器会受到各种噪声的干扰,如光子噪声、电子噪声等,这些噪声会降低信号的信噪比,进而影响定位精度。
3. 传感器参数设置:传感器的参数设置也会对定位精度产生影响,如光源的功率、波长等参数的设置都会影响传感器的性能。
四、解调算法研究为了提高干涉型光纤振动传感器的定位精度,需要研究有效的解调算法。
常见的解调算法包括:频谱分析法、时域分析法、小波变换法等。
本文将重点研究时域分析法和频谱分析法在提高定位精度方面的应用。
1. 时域分析法:时域分析法通过分析干涉信号的时域特征来提取振动信息。
针对光纤形变的不均匀性,可以采用基于高阶差分法的算法来消除形变的影响。
此外,通过设置合理的阈值和滤波器来减小噪声的干扰,提高信号的信噪比,从而提高定位精度。
基于干涉原理和光纤布拉格光栅的复合参数光纤传感器一、本文概述随着科技的飞速发展,光纤传感器技术以其独特的优势在多个领域得到了广泛应用。
其中,基于干涉原理和光纤布拉格光栅的复合参数光纤传感器,作为一种高精度、高灵敏度的测量工具,正逐渐成为研究热点。
本文旨在深入探讨这种传感器的原理、设计、制造及其在实际应用中的性能表现。
文章首先将对干涉原理和光纤布拉格光栅的基本理论进行介绍,阐述它们如何被应用于光纤传感器的设计中。
随后,将详细介绍复合参数光纤传感器的结构和工作原理,包括其如何实现多参数的测量以及测量过程中的关键技术问题。
接着,文章将重点分析复合参数光纤传感器的性能特点,如灵敏度、分辨率、测量范围等,并通过实验数据验证其在实际应用中的准确性和可靠性。
还将探讨传感器在不同环境条件下的稳定性和适应性,以及其在不同领域的应用前景。
文章将总结复合参数光纤传感器的技术优势,分析当前研究中存在的问题和挑战,并对未来的研究方向和应用前景进行展望。
通过本文的阐述,读者可以对基于干涉原理和光纤布拉格光栅的复合参数光纤传感器有一个全面而深入的了解,为其在实际应用中的推广和优化提供理论支持和实践指导。
二、干涉原理和光纤布拉格光栅的基本理论干涉原理是光学中的一个基本概念,描述的是当两束或多束相干光波在空间相遇时,它们的光强分布将发生特定的变化,形成明暗相间的干涉条纹。
这种干涉现象的产生,源于光波在传播过程中存在的相位差和振幅差。
在光纤传感器中,干涉原理的应用主要依赖于光纤中光波的传播特性,通过特定的结构设计和光路布置,使得不同路径上的光波产生干涉,从而实现对外部物理量的测量。
光纤布拉格光栅(Fiber Bragg Grating, FBG)则是一种基于光纤的光学元件,通过在光纤中引入周期性的折射率变化,使得特定波长的光波在光纤中产生反射。
这种反射光波的波长与光纤光栅的周期和折射率变化幅度有关,因此,当外部物理量(如温度、压力等)引起光纤光栅的折射率或周期变化时,反射光波的波长也会发生相应的变化。
干涉型光纤传感器的信号处理系统近年来,传感器在朝着灵敏、精巧、适应性强和智能化、网络化的方向发展。
在这一过程中,光纤传感器作为传感器家族的新成员,由于其优越的性能而倍受青睐。
在各种光纤传感器中以干涉型光纤传感器的灵敏度最高。
干涉仪结构的光纤传感器系统,通过深入研究随机信号的互相关函数和基于AR模型的功率谱估计,设计出具有事件发生检测功能的传感器信号处理算法。
此算法可以对外界振动进行实时预警,并实现高速、高精度的定位。
该技术可用于检测第三方入侵,对需要防护的地域、管线进行监控、报警并提供精确定位。
研究成果对于长距离分布式干涉型光纤传感器的实用化具有重要的理论意义和实际应用价值,并在工业和国防领域具有应用前景。
本文设计的光纤传感系统分为传感线路、光收发模块、数据采集和信号处理等部分。
传感线路部分是一种基于马赫一泽德干涉仪的双向干涉结构。
当干涉仪中的干涉臂受到外力引起的振动时,光纤中传输的光信号的相位会发生变化,从而导致输出干涉波形的变化。
干涉信号经光电转换、数据采集送至信号处理系统,经信号处理分析后可以对外界振动发生的位置进行定位。
信号处理部分由DSP和PC机共同组成,DSP用于实现事件发生检测算法,PC机实现定位算法。
通过实验分析表明,事件发生检测算法可以显著地改善光纤传感器的性能,提高系统准确性,降低误报率。
在合理设置采样率的基础上,可以实现lOOM的定位误差。
采用DSP和PC机合理分配运算负担,可以满足光纤传感器系统实时监控的要求。
第一章绪论1.1引言传感器是感受规定的被测物理量并按一定规律将其转换为有用信号的器件或装置,它在工业生产、国防建设和科学技术等各个领域都发挥着巨大作用。
近年来,传感器在朝着灵敏、精巧、适应性强和智能化、网络化的方向发展。
在这一过程中,光纤传感器作为传感器家族的新成员,由于其优越的性能而倍受青睐。
与传统的传感器相比,光纤传感器具有以下的优势:首先,光纤是一种耐高压,抗腐蚀的介质,能在电磁或电子传感器不能工作的恶劣环境下运行。
《干涉型光纤振动传感器定位精度及解调算法研究》篇一摘要:本文针对干涉型光纤振动传感器(Interferometric Fiber-optic Vibration Sensor,IFVS)的定位精度及解调算法进行了深入研究。
通过分析IFVS的原理和特性,探讨了影响定位精度的主要因素,并对现有解调算法进行了优化。
通过实验验证了改进算法的有效性和可行性,为IFVS在振动监测和定位领域的应用提供了理论依据和技术支持。
一、引言随着光纤传感技术的不断发展,干涉型光纤振动传感器因其高灵敏度、抗电磁干扰等优点,在安防、机械故障诊断、地质灾害监测等领域得到了广泛应用。
然而,传感器的定位精度及解调算法是影响其应用效果的关键因素。
因此,研究IFVS的定位精度及解调算法具有重要的理论和实践意义。
二、干涉型光纤振动传感器原理及特性IFVS通过测量光在光纤中传播时的相位变化来感知外界振动。
其基本原理是利用光干涉现象,将光分为两束或多束,分别传输至不同位置后再次相遇产生干涉。
当外界振动作用于传感器时,会引起光程差的变化,进而导致干涉信号的相位变化,从而实现对振动的检测和定位。
三、影响定位精度的主要因素IFVS的定位精度受多种因素影响,包括光源稳定性、光纤传输损耗、环境噪声等。
其中,解调算法的准确性直接决定了定位精度的优劣。
传统的解调算法在处理复杂信号时往往存在一定误差,无法满足高精度要求。
四、解调算法优化研究针对传统解调算法的不足,本文提出了一种基于小波变换和自适应阈值的解调算法。
该算法能够有效地提取出干涉信号中的有用信息,抑制噪声干扰,提高解调精度。
同时,通过自适应阈值设置,实现了对不同强度信号的自动识别和处理,提高了算法的适应性和鲁棒性。
五、实验验证与分析为了验证改进算法的有效性和可行性,我们进行了大量实验。
实验结果表明,经过优化的解调算法在处理复杂信号时具有更高的精度和稳定性。
同时,通过对不同位置、不同强度的振动信号进行测试,验证了IFVS在振动监测和定位方面的优越性能。
1. 了解光纤干涉传感的基本原理和实验方法。
2. 掌握光纤干涉传感器的构造及其在测量中的应用。
3. 通过实验验证光纤干涉传感器的测量精度和可靠性。
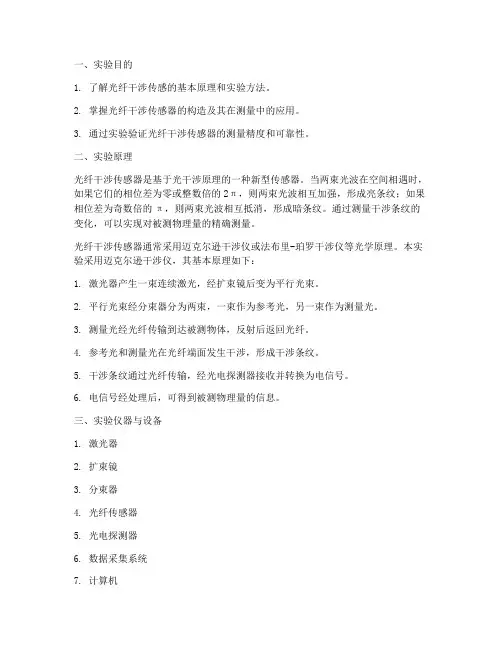
二、实验原理光纤干涉传感器是基于光干涉原理的一种新型传感器。
当两束光波在空间相遇时,如果它们的相位差为零或整数倍的2π,则两束光波相互加强,形成亮条纹;如果相位差为奇数倍的π,则两束光波相互抵消,形成暗条纹。
通过测量干涉条纹的变化,可以实现对被测物理量的精确测量。
光纤干涉传感器通常采用迈克尔逊干涉仪或法布里-珀罗干涉仪等光学原理。
本实验采用迈克尔逊干涉仪,其基本原理如下:1. 激光器产生一束连续激光,经扩束镜后变为平行光束。
2. 平行光束经分束器分为两束,一束作为参考光,另一束作为测量光。
3. 测量光经光纤传输到达被测物体,反射后返回光纤。
4. 参考光和测量光在光纤端面发生干涉,形成干涉条纹。
5. 干涉条纹通过光纤传输,经光电探测器接收并转换为电信号。
6. 电信号经处理后,可得到被测物理量的信息。
三、实验仪器与设备1. 激光器2. 扩束镜3. 分束器4. 光纤传感器5. 光电探测器6. 数据采集系统7. 计算机1. 将激光器、扩束镜、分束器、光纤传感器、光电探测器和数据采集系统连接成实验电路。
2. 打开数据采集系统,设置采集参数。
3. 启动激光器,调节扩束镜和分束器,使激光束通过光纤传感器。
4. 测量参考光和测量光的强度,记录数据。
5. 改变被测物理量,观察干涉条纹的变化,记录数据。
6. 对采集到的数据进行处理,得到被测物理量的信息。
五、实验结果与分析1. 当被测物理量改变时,干涉条纹发生相应的变化。
根据干涉条纹的变化规律,可以计算出被测物理量的变化量。
2. 通过实验验证,光纤干涉传感器的测量精度较高,可满足实际应用需求。
3. 分析实验数据,探讨影响光纤干涉传感器测量精度的因素,并提出改进措施。
六、实验总结1. 本实验成功实现了光纤干涉传感器的测量,验证了其测量精度和可靠性。
太原理工大学博士研究生学位论文干涉型光纤振动传感器定位精度及解调算法研究摘要分布式光纤传感具有本征安全、抗电磁干扰、耐腐蚀、可大范围连续监测等优势,近年来得到了国内外的广泛关注。
振动传感作为分布式光纤传感领域中主要的研究方向之一,在民用设施周界安防、油气管道安全监测、桥梁结构健康监测、军事基地入侵预警等领域具有广阔的应用前景。
干涉型光纤振动传感技术包括前向传输光干涉型和后向散射光干涉型两类。
基于前向传输光干涉型光纤振动传感器,如萨格纳克(Sagnac)干涉仪和马赫泽德(Mach-Zehnder)干涉仪,是将被测的振动信号转换为光纤中前向传输光的相位变化,再通过干涉将相位变化转换成光强变化。
它结构相对简单、响应速度快,但振动定位精度较低。
而后向散射光干涉型光纤振动传感器,如相位敏感光时域反射仪(phase-sensitive optical time domain reflectometer,Φ-OTDR),是利用高相干光脉冲在光纤中传输时产生的后向瑞利散射光的干涉效应,通过建立后向散射光信号与时间的关系获得振动位置信息,其定位精度高,但存在振动信号解调复杂以及实时性不高等问题。
本文围绕干涉型光纤振动传感器的定位精度及解调算法开展研究,主要内容包括:(1)研究了基于混沌光源的Sagnac高精度振动定位系统,利用外腔反馈半导体混沌激光器作为系统光源,再结合振动频谱中的高阶零频点进行定位。
实验了在12.101 km长的传感光纤上22 m的振动定位误差。
太原理工大学博士研究生学位论文(2)研究了基于计数脉冲方法的Mach-Zehnder高精度振动定位系统,将调制后的周期性脉冲序列后注入到干涉结构中,通过分析干涉脉冲序列包络特征定位振动发生的位置。
实验结果表明,当脉冲宽度为20 ns时,在总长940 m的传感光纤长度上,振动定位误差为9 m。
(3)研究了基于包络正交解调算法的Φ-OTDR振动相对振幅表征方法。
![[实验报告]干涉法研究光纤温度传感器特性](https://uimg.taocdn.com/7ba81b6b48d7c1c708a145dc.webp)
干涉法研究光纤温度传感器特性摘要:采用光纤双光束干涉的方法研究并测量了其干涉条纹随温度的变化情况。
实验结果表明,测量方法简便可行,易于实现,实验现象明显。
关键词:光纤折射率,温度,干涉THE STUDY OF CHRACTERISTICS OF OPTICAL FIBERTEMPERATURE SENSORAbstract:Adopting the method of interference of two light beams, the change of the interferometric fringes with temperature is measured. The experimentalresults show that the method is simple and easy to achieve. The phenomenonis evident.Keywords:optical fiber,temperature,interference1引言光纤折射率不仅是波长的函数,而且与光纤的环境温度密切相关。
光纤折射率是光纤设计与制作的重要参数之一,也是商用化光纤产品的特性参数。
光纤折射率的温度相关特性对于光纤光缆设计、光纤传感器设计、光纤探测仪器和光纤测试等具有重要意义。
[1]光通过在光纤内部的传输,受到外界因素(如温度等)的影响,光波的振幅、光强、香味、偏振态等会发生变化。
所以,如果测出这些光的参量随外界因素的变化规律便可利用光纤实现各种传导功能。
2原理和仪器用激光器照射两根紧贴放置的形状一样的光纤的一端,由于激光相干性极高,在另一端能观察到明显的干涉条纹,通过改变其中一根光纤的局部温度,导致光纤内部折射率改变,从而光程发生变化,反映在干涉条纹上,即能观察到干涉条纹移动,记录条纹移动级数N,进而求的折射率改变,调节温度,得到该光纤折射率随温度变化关系。
其实验仪器如下图所示:图1 干涉法测光纤折射率的温度特性装置图令通过加热器的光相位为ϕ,波长为λ,加热器中光纤的长度为L ,光纤折射率为n ,则有2nL πϕλ∆=当温度改变导致光纤折射率和长度改变时()()()22n n L L nL n L L n ππϕλλ∆=+∆+∆-≈∆+∆⎡⎤⎣⎦ 考虑受温度影响,上式化为2n n L L T T L T ϕπλ∆∆∆⎛⎫=+ ⎪∆∆∆⎝⎭对于石英玻璃光纤 1.46n ≈,5110o n T C -∆∆=⨯, 线膨胀系数 7510o L L T C -∆∙∆=⨯, 试验用氦氖激光器波长约630nm ,带入即可得()217.02o N rad m C L T L Tϕππ∆∆==⨯∙∆∆ 即单位长度光纤变化单位温度产生的条纹移动为17级。
高精度低相干干涉仪的基本原理1. 介绍高精度低相干干涉仪是一种测量光学相位差的精密仪器,其原理基于干涉比较的方法。
高精度低相干干涉仪具有高精度、高分辨率、抗噪声能力强的特点,在光学测量和精密仪器中得到广泛应用。
2. 干涉现象在单色光照射下,当光波通过两个光学路径并重新合成时,会出现干涉现象。
干涉现象是指两束光波叠加后形成明暗相间的干涉条纹。
干涉现象的产生是由于光的波动性质引起的。
当两束光波相遇时,它们会相互作用并发生叠加,根据叠加的结果,可以得到不同的干涉效果。
3. 光程差和相位差在干涉现象中,两束光波的相位差起着关键作用。
相位差表示的是两束光波的振动的起点之间的差异。
通过改变光的传播路径,可以改变相位差的大小。
光程差是指两束光波传播路径的长度差,通常用符号ΔL或Δx表示。
光程差与相位差之间存在着简单的线性关系。
光程差ΔL与相位差Δφ的关系可以通过以下公式表示:ΔL = λΔφ / (2π)其中,λ是光的波长。
4. 干涉仪的构成和工作原理高精度低相干干涉仪通常由两个关键部分组成:光源和干涉仪。
4.1 光源高精度低相干干涉仪中常用的光源是激光。
激光具有单色性好、亮度高的特点,能够产生稳定且相干度较高的光束。
4.2 干涉仪高精度低相干干涉仪通常采用迈克尔逊干涉仪的结构。
迈克尔逊干涉仪由半透镜、分束器、反射镜和检测器等主要组成。
光从光源经过分束器分为两束,分别经过两个光路,再通过反射镜反射回来重新合成。
分束器部分光束透射,部分光束反射,使得原本平行的两束光相交形成干涉。
通过调整一个反射镜的位置,可以改变光的传播路径长度,从而改变光程差。
当光程差满足一定条件时,会形成明亮的干涉条纹;当光程差改变时,干涉条纹会随之移动,颜色也会发生变化。
4.3 干涉条纹的解释干涉条纹的出现是由于光程差造成的相位差改变。
当两束光波的相位差为整数倍的2π时,相长干涉发生,形成明亮的条纹;当相位差为奇数倍的π时,相消干涉发生,形成暗的条纹。
文章编号:025827025(2006)1121537205光纤光栅传感器干涉型解调仪的稳定性分析和改进阳 莎,蔡海文,黄 冲,耿健新,瞿荣辉,方祖捷(中国科学院上海光学精密机械研究所,上海201800)摘要 提出了一种利用两种不同温度系数的光纤光栅对来对解调仪的不稳定性进行改进的方法,并进行了理论分析,研究了影响该解调仪稳定性的几个因素.将所研制的传感器布设在东海大桥上,组成传感网络,并用改进后的光纤光栅解调系统对传感器的信号进行解调.在大桥竣工测试时,该传感解调系统表现出较好的性能.关键词 光纤光栅;解调;传感;相位补偿中图分类号 TN 253;TP 212.14 文献标识码 AStability Analysis and Improvement of An Inteferometric Interrogation forFiber B ragg G rating SensorsYAN G Sha ,CA I Hai 2wen ,HUAN G Chong ,GEN G Jian 2xin ,QU Rong 2hui ,FAN G Zu 2jie(S hanghai I nstitute of O ptics and Fine Mechanics ,T he Chinese A cadem y of S ciences ,S hanghai 201800,China )Abstract A compensation method with theoretical analysis is proposed to compensate the instability of interrogation by using a pair of fiber Bragg grating (FB G )with different thermal coefficients.The factors that influenced the stability of interrogation had been investigated.Several sensors were installed in Donghai Bridge and formed a sensor network.The signals f rom sensors were demodulated by the improved interrogator on the final test of Donghai Bridge ,which shows good performance.K ey w ords fiber Bragg grating ;demodulator ;sensor ;phase compensation 收稿日期:2006204210;收到修改稿日期:2006205229 基金项目:上海市科学技术委员会科研计划项目(03dz11003)资助课题. 作者简介:阳 莎(1981—),男,湖北天门人,中国科学院上海光学精密机械研究所信息光学实验室硕士研究生,主要从事光纤光栅制作、光纤传感等方面的工作.E 2mail :yangsuo @ 导师简介:瞿荣辉(1973—),男,湖北人,中国科学院上海光学精密机械研究所研究员,博士生导师,目前研究方向为光纤激光器及光纤传感.E 2mail :rhqu @1 引 言 随着经济的发展,我国基础设施建设的规模不断加大,新建的高楼、道路、桥梁、大坝几乎遍地开花.对于这些建筑物健康状况的传感、测控成为一个关系国计民生的重要课题.传感器和传感技术成为科学研究和技术开发的热点.光纤和光纤光栅相对于环境温度和应力应变具有敏感特性,而且其具有体积小、重量轻、抗电磁干扰性强、耐高温、耐潮湿、耐腐蚀、集信息传输与传感于一体等一系列优点,已经被广泛应用于传感系统[1,2].光纤光栅传感的基本原理,是测量其反射光谱峰值波长值随待测传感量的变化.在实际应用系统中实现峰值波长的准确测量,是这一技术的关键问题之一.文献[3]报道了用一种基于3×3耦合器的马赫2曾德尔干涉仪(MZI )来测量光纤光栅反射峰值波长移动量的方法.该干涉仪具有动态范围大、可判断波长移动方向等优点.但是,与通常光纤干涉仪的特点一样,其特性会随环境温度、外界机械力和振动而变化.稳定性成为仪器实用化的主要障碍.本文对3×3光纤耦合器构成的非平衡马赫2曾第33卷 第11期2006年11月中 国 激 光C H IN ESE J OU RNAL O F L ASERSVol.33,No.11November ,2006德尔干涉仪解调系统的稳定性进行了实验研究,分析了基本原因,采用两个不同温度系数的光纤光栅组成光纤光栅对作为补偿器,对干涉仪的漂移作实时的监控和补偿,改进了干涉仪解调系统的稳定性.该解调系统在东海大桥应力温度传感系统中进行了现场实验,取得了较好的效果.2 光纤光栅的解调和补偿2.1 干涉仪解调原理光纤布拉格光栅(FB G )的谐振波长随应变和温度的改变有很好的线性特性.实验测定,对于1550nm 波段的石英光纤,光纤光栅的应变系数和温度系数分别为α=1.2p m/με,β=11p m/℃[4].光纤光栅的这种线性特性正被广泛地应用于应变和温度的传感器.在光纤光栅传感系统中,必须解决测定其峰值波长的解调技术.光纤马赫2曾德尔干涉仪[5]和扫描法布里2珀罗(F 2P )干涉仪[6]是最常用的方法.实验中采用的是基于马赫2曾德尔干涉仪的解调技术,如图1所示.其中,FB G1~FB G3表示光纤光栅传感探头.宽带光源发出的光经过2×2耦合器后入射到多个光纤布拉格光栅传感头,各光纤布拉格光栅反射相应波长的信号光,经耦合器进入扫描光纤法布里2珀罗滤波器(FFP ),并在不同时间被扫描后进入非平衡马赫2曾德尔干涉仪.马赫2曾德尔干涉仪的三个输出由三个光电二极管同时探测,经放大后由数据采集卡发送给计算机,再用Labview 编程进行计算和处理.图1光纤光栅传感解调仪的结构图Fig.1Schematic diagram of FB G sensor interrogation文献[3]已经作了分析,指出采用3×3耦合器构成马赫2曾德尔干涉仪作为解调器,具有灵敏度不存在死区、能区分相移方向、可进行相位展开(Phase 2unwrapping )扩大量程等优点.但是与许多干涉仪型的解调技术一样,存在着稳定性的问题.实验采用如图1中虚线框内的两个光纤光栅FB G 2a 和FB G 2b 组成的补偿模块[7],改善干涉仪的稳定性.在无外界扰动的情况下,干涉仪将相位转换为波长的公式为<=2πn ΔL/λ,(1)式中<为干涉仪两臂的相位差,n 为光纤的折射率,ΔL 为干涉仪两臂的臂长差,λ为光栅的反射波长.由传感光纤布拉格光栅反射的光波长的变化,在马赫2曾德尔干涉仪上产生干涉相位差的变化为d <=-2πn ΔL λ2d λ=χd λ,(2)这里引入一个比例系数χ=-2πn ΔL λ2,对于不同中心波长的传感光纤布拉格光栅,其取值也不同.χ的取值也可以根据实际波形的周期计算和测定.考虑到3×3耦合器分束比偏离1∶1∶1的情况,以及三个探测器灵敏度及其放大电路放大倍数的差别,经推导[3],解调后信号光的相位变化计算得tanΔ<(t )=3[α3I 2(t )-α2I 3(t )]α3I 2(t )+α2I 3(t )-2α2α3I 1(t ),(3)其中I 1,I 2,I 3为进入数据采集卡的三个通道的信号,即干涉仪三个输出端口的信号光经光电转换和放大后的电信号.α2和α3分别为I 2和I 3两个通道相对于I 1通道的比值,它反映了耦合器偏离1∶1∶1分束比及三路光电转换特性的差异.从式(3)可以看出,通过测三路放大后的信号I 1,I 2和I 3的值,就可以得到相位的变化,进而由式(2)计算出入射光波的波长变化.2.2 稳定性分析及补偿措施测试光源光强的起伏,将会直接影响测量信号的大小.在用式(3)计算相移时,光源光强的起伏将会自动抵消.当然,这要求光电转换处于线性的范围内.从干涉仪相位角的测量得到波长的变化,必须保证干涉仪两臂的折射率和臂长不变.实际上,恰恰是由于外界条件的变化,主要是温度和应力的波动,导致光经过干涉仪两臂时的光程差的变化,引起了干涉仪的相位漂移.一般光纤干涉仪两臂的长度都比较长,因此光程差漂移的影响比较严重.由式(1)可见,讨论干涉仪的相位变化至少应当考虑波长、折射率、臂长三个因素δ<=-2πn ΔL λ2δλ+2πΔL λδn +2πn λδ(ΔL )=δ<λ+δ<env ,(4)式中第一项在本工作中是待测量;后两项反映了由8351中 国 激 光 33卷 环境的变化导致的干涉仪相位的随机漂移,即合并表示为δ<env ,它一般是一个缓变量.δ<λ为传感光纤光栅的相移.光纤的热膨胀系数α=0.55×10⁻⁶K -1,热光系数β=6.67×10⁻⁶K -1.实验中,干涉仪的臂长差为ΔL =1.6mm ,每臂长约L =1m ,若两臂的温度差变化ΔT ,则δ<env =2πΔL λδn +2πn λδ(ΔL )=2πΔL λn ・β・ΔT +2πn λL ・α・ΔT ,其中n =1.4502为光纤纤芯的折射率.对于波长为1550nm 的光波来说,当ΔT =0.1℃时,δ<env =0.05165×2π.干涉仪在1550nm 处干涉曲线的周期为1.5nm ,所以两臂的温度变化相差0.1℃时δ<env 对应的波长改变量为2π1.5nm =δ<env Δλ,即Δλ=77.48p m.可以看出温度的微小变化给干涉仪带来很大的波动.再加上外界的振动、应力等因素的影响,干涉仪的稳定性就会更差,这对于解调仪的实用化是一个很大的障碍.图2为在传感光栅未受到外力作用的条件下,实验测量得到的在50min 内相位(通过式(2)转换为波长的变化,以皮米为单位)的漂移情况.曲线2是在无补偿情况下传感光栅波长相位的漂移.可以看出,对于未受应力影响、峰值波长没有变化的传感光栅,解调后的光信号波长在不到1h 的时间中发生了30多皮米的漂移.这种漂移就是由于干涉仪受到外界扰动所引起的.无补偿情况下的这种漂移对于快速变化的待测应变的传感,影响还不是很大,但是对于缓慢变化和小的待测应变的传感,影响就很大.图2有补偿和无补偿情况下解调仪的测试信号曲线Fig.2Interrogated signal curves with andwithout compensation为了能够准确直观地观察到传感光栅波长的变化,我们需要监测马赫2曾德尔干涉仪的漂移情况.为此,采用由两个不同温度系数的光纤光栅组成的光纤光栅对构成补偿模块,如图1中虚线方框所示.这两个光纤光栅分别固定封装在高、低膨胀系数的两种材料上,本文采用铝块和石英.封装后可以测量得到它们的峰值波长温度系数,然后在不受外力的条件下安装在解调仪内部.解调仪在使用的时候,在每一次测量传感光纤光栅波长变化的同时,也测量补偿模块光纤光栅的波长变化.这两个补偿光栅反射的光波,经过干涉仪后的相位变化可以表示为δ<a =γa δT +δ<env ,(5a )δ<b =γb δT +δ<env ,(5b )其中δ<a 和δ<b 表示两补偿光栅的相位变化,γa 和γb 为补偿模块中两个光纤光栅的相位温度系数,它等于峰值波长温度系数乘以式(2)中的系数χ,可以事先测定.δT 为补偿模块处的温度变化.由式(5a )和(5b )可以得到δT =(δ<a -δ<b )/(γa -γb ),(6a )δ<env =(γb δ<a -γa δ<b )/(γa -γb ),(6b )由此可见,测量补偿模块中的两个光纤光栅的相移,就得到环境因素引起的随机漂移因子δ<env .将其代入式(4),就可以扣除干涉仪的零漂相移,得到传感光纤光栅的相移δ<λ,从而补偿干涉仪漂移的影响.由上述补偿原理可知,补偿模块中两个光纤光栅的峰值波长,不能与传感光纤光栅的峰值波长相同,这一点在传感相同设计时需要加以考虑.图2中曲线1是根据上述方法对曲线2的数据作实时校正后的波长,可以看到零漂降到了1~2p m 量级,反映出良好的补偿效果.图3为在实验室中对安装在悬臂梁上的传感光纤光栅进行测量的实验结果.对悬臂梁施加应力,使光纤光栅的波长逐次变化10p m ,20p m ,30p m ,40p m ,50p m ,然后再释放施加在光栅上的力,如此重复三次.由多波长计和解调仪同时观察其波长变化量,其数据如表1所示.解调仪检测到的波长变化,经补偿模块的数据校正后,如图3中曲线3所示,曲线1和2为干涉仪测得的两个补偿光栅的信号,反映了干涉仪的漂移情况.补偿计算的波长变化量与多波长计测试结果相差在2p m 之内.从图中还可以看出,每次释放施加的力后,光栅的波长变化又回到了零点,说明补偿效果良好.如果没有经过补偿光栅的补偿,则每次释放施加的力后,解调仪显示的波长变化值就不会回到零点,而是相对零点有一个偏移,这个偏移量与干涉仪受到的扰动大小有关,图3中曲线1和2的信号就反映了扰动的大小.9351 11期 阳 莎等:光纤光栅传感器干涉型解调仪的稳定性分析和改进图3对光栅多次施力重复三次的解调曲线Fig.3Interrogated curves by pressing the FB G sensorfor several times表1解调仪和多波长计测试结果的比较T able 1Comparison of test result betw een interrogationand multi 2w avelength meterMulti 2wavelength display /pmInterrogation display /pm First Second Third 001010111211202121213031323240414242505151512.3 其他不稳定性因素除了干涉仪两臂的折射率和臂长之外,还有几个方面的因素会对解调仪的稳定性有所影响.第一,构成干涉仪的2×2和3×3光纤耦合器的稳定性,是一个重要因素.虽然这两种元件都是市场供应的成熟产品,在光纤通信系统中广泛应用,但是对于干涉仪来说,还有更高的要求,耦合器的保偏性、分束比随温度的波动等因素都会影响到解调仪的稳定性.其次,在解调仪中采用的扫描光纤法布里2珀罗滤波器的稳定性也是需要考虑的因素.虽然在该解调仪中光纤法布里2珀罗滤波器主要用于传感光纤光栅波长的解复用,不起确定波长的作用,但是它的温度稳定性,包括其驱动器的稳定性,还是一个必须考察的问题.实验发现,由于驱动光纤法布里2珀罗滤波器工作的三角波电压会发生漂移,使得光纤法布里2珀罗滤波器的扫描范围发生变化.三角波电压的频率不稳定性也对解调结果带来影响.而且即使是在恒定的电压下,随着周围温度等的影响,光纤法布里2珀罗滤波器的透射波长和峰值功率也都会有比较大的变化.此外,实际应用中的电磁干扰对解调仪的影响也需要检验,特别是对于微弱信号的检测,必须采用良好的电磁屏蔽.文献[3]介绍了采用相位展开算法扩大传感测量范围的方法.根据非平衡马赫2曾德尔干涉仪的原理,干涉周期与臂长差成反比.由式(2)可得,检测的相移对于波长变化的灵敏度正比于臂长差:5<5λ=-2πn ΔL λ2.适当增加臂长差,将提高这一灵敏度,也即提高被测量对于噪声和漂移干扰的比值:δ<λ/δ<env ,有利于测量的稳定性.但是另一方面,也增加了相位展开计算的工作量和精度要求.因为ΔL 的增加将减小干涉仪的自由光谱区:Δλ=λ2/(n ΔL ).这需要在设计传感系统和解调仪时,根据实际使用要求做出折中考虑.3 光纤光栅准分布式传感系统和解调仪的实际应用 在东海大桥进行了使用文中研制的光纤光栅传感解调仪的实验.为了监测大桥的健康情况,在东海大桥斜拉索部位的桥箱里安装了光纤光栅应变传感器.每个桥箱里分别安装五个不同探测点,用来探测五个不同部位的应变情况.其中三个探测点同时安装应变传感器和温度传感器,两个探测点只安装应变传感器.温度传感器用来监测桥箱内温度的变化,以补偿应变传感器的温度效应.每个桥箱内的八个传感光栅组成一个传感网络,其传感信号用解调仪解调并显示出来.图4为安装的一个应变传感器的图片.图4传感器安装的现场图Fig.4Local picture of installed sensor在大桥竣工测试中,仪器记录了不同负载下的应变情况.静载测试时,24辆卡车缓缓地在桥上前进,并在两个斜拉索之间的主通航孔停留几分钟.动载测试时,2辆卡车一组以不同速度驶过大桥.大桥静载测试时,24辆卡车一齐开到停泊点,451中 国 激 光 33卷 然后静止不动.撤消静载时,是分批启动撤走.图5为加静载和撤消静载时,其中一个传感器的波长变化曲线.可以看出传感器反映了加静载和撤消静载时卡车的应变情况.图5在桥面加静载和撤消静载时一个传感器波长的变化曲线Fig.5Wavelength change of a sensor by adding andremoving static load onbridge图6两辆卡车以10km/h (a ),20km/h (b )和40km/h (c )的速度从桥面驶过时的测试信号Fig.6Interrogated signal when two trucks run throughthe bridge with the volocity of 10km/h (a ), 20km/h (b )and 40km/h (c ) 图6(a ),(b ),(c )分别为卡车以10km/h ,20km/h 和40km/h 的速度从桥上驶过时,其中一个传感器测得的信号.从图中可以看到,两辆卡车驶过桥面时引起先后应变的变化.行驶速度越快,测试信号形状“W"越窄.4 结 论 建立了一个由2×2和3×3光纤耦合器构成的非平衡马赫2曾德尔干涉仪,用来作为准分布式光纤光栅传感系统的解调仪.分析了影响该解调仪稳定性的几个因素.采用光纤光栅对的补偿模块,较好地解决了干涉仪的漂移问题.报道了传感系统和解调仪在东海大桥应力传感中实际应用的初步结果.用光纤干涉仪作为光纤光栅传感器的解调方法,具有成本低廉、使用方便的优点,是光纤光栅传感技术推广应用的一个技术支持.本文工作表明,采用补偿方法解决解调仪稳定性后,就有可能将干涉仪推向实际应用.参考文献1 Turan Erdogan.Fiber grating spectra [J ].J.L i ght w aveTechnol.,1997,15(8):1277~12942 V.Bhatia ,A.M.Vengsarkar.Optical fiber long 2period gratingsensors [J ].Opt.L ett.,1996,21(9):692~6943 Huang Chong ,Cai Haiwen ,Geng Jianxin et al..Wavelengt hinterrogation based on a Mach 2Zehnder interferometer wit h a 3×3fiber coupler for fiber Bragg grating sensors [J ].Chinese J .L asers ,2005,32(10):1397~1400 黄 冲,蔡海文,耿健新等.基于3×3耦合器的马赫2曾德尔干涉仪的光纤光栅波长解调技术[J ].中国激光,2005,32(10):1397~14004 Huang Rui ,Cai Haiwen ,Qu Ronghui et al..Separatelymeasurement of strain and temperature using a single fiber Bragg grating [J ].Chinese J .L asers ,2005,32(2):232~235 黄 锐,蔡海文,瞿荣辉等.一种同时测量温度和应变的光纤光栅传感器[J ].中国激光,2005,32(2):232~2355 A. D.Kersey ,T. A.Berkoff.Dual wavelengt h fiberinterferometer wit h wavelengt h selection via fibre Bragg gratingelement s [J ].Elect ron.L ett.,1992,28(13):1215~12166 A. D.Kersey ,T. A.Berkoff ,W.W.Morie.MultiplexedBragg grating fiber 2laser strain 2sensor system wit h a fiber F 2Pwavelengt h filter [J ].Opt.L ett.,1993,18(16):1370~13727 M. D.Todd ,G. A.Johnson ,B.L.Alt house.A novel Bragggrating sensor interrogation system utilizing a scanning filter ,a Mach 2Zehnder interferometer and a 3×3coupler [J ].Meas.S ci.Technol.,2001,12(12):771~7771451 11期 阳 莎等:光纤光栅传感器干涉型解调仪的稳定性分析和改进。
精品文档供您编辑修改使用专业品质权威编制人:______________审核人:______________审批人:______________编制单位:____________编制时间:____________序言下载提示:该文档是本团队精心编制而成,希望大家下载或复制使用后,能够解决实际问题。
文档全文可编辑,以便您下载后可定制修改,请根据实际需要进行调整和使用,谢谢!同时,本团队为大家提供各种类型的经典资料,如办公资料、职场资料、生活资料、学习资料、课堂资料、阅读资料、知识资料、党建资料、教育资料、其他资料等等,想学习、参考、使用不同格式和写法的资料,敬请关注!Download tips: This document is carefully compiled by this editor. I hope that after you download it, it can help you solve practical problems. The document can be customized and modified after downloading, please adjust and use it according to actual needs, thank you!And, this store provides various types of classic materials for everyone, such as office materials, workplace materials, lifestylematerials, learning materials, classroom materials, reading materials, knowledge materials, party building materials, educational materials, other materials, etc. If you want to learn about different data formats and writing methods, please pay attention!微型光纤干涉仪与分布式光纤传感技术的探究微型光纤干涉仪是一种基于光纤干涉原理的仪器,具有高区分率、高灵敏度等特点,已经广泛应用于物理学、化学、生物医学等领域。
低相干干涉原理范文低相干干涉原理是一种用于光学干涉实验的技术,通过降低相干性可以获得更加清晰的干涉图样。
在传统的干涉实验中,需要保持高度相干的光源,例如激光光源或波长极接近的单色光源。
然而,在一些应用中,高相干的光源可能难以满足实验要求,因此需要采用低相干干涉原理。
低相干干涉原理通过在实验中引入两个具有较低相干性的光源,并对它们进行干涉,从而获得干涉图样。
这两个光源的相干长度应该比实验中所需的干涉条纹的尺寸要小,这样可以确保干涉效果的清晰度。
在这种情况下,两个光源的相干性会互相混合,产生一种全新的干涉效应。
低相干干涉的原理可以通过以下实例来说明:假设有两个相干性较低的光源A和B,它们的相干长度分别为L_a和L_b。
当这两个光源照射到一个干涉仪上时,它们在干涉仪的干涉区域内会产生干涉图样。
在干涉区域内,如果两个光源的光程差小于它们的相干长度,即ΔL<L_a和ΔL<L_b,则可以观察到干涉条纹。
这是因为光源A和B在干涉区域内所产生的干涉图样是来自于两个不同光源的干涉。
然而,当两个光源的相干长度L_a和L_b满足ΔL>L_a和ΔL>L_b时,干涉条纹会变得模糊不清,甚至无法观察到。
这是因为在这种情况下,光源A和B的干涉效应已经无法区分开来,无法产生明显的干涉条纹。
低相干干涉的原理可以通过干涉仪的性质来解释。
在干涉仪中,由于两束光的相干性差,干涉图样会呈现出模糊的边界和混杂的条纹,且整体的亮度会降低。
干涉仪的分辨率和清晰度取决于相干性的大小,因此采用低相干干涉可以提高干涉图样的清晰度和分辨率。
低相干干涉技术在许多应用中发挥了重要作用。
例如,在光学相干层析成像中,采用低相干干涉可以降低相干伪影,并提高图像的清晰度和对比度。
在光学传感器中,低相干干涉可以提高测量的精度和灵敏度。
此外,在光波导和光纤中,低相干干涉也可以用于信号的传输和处理。
总之,低相干干涉原理通过降低光源的相干性来获得清晰的干涉图样。
南京航空航天大学硕士学位论文基于低相干法的光纤应变测量技术及其应用研究姓名:陈盛票申请学位级别:硕士专业:测试计量技术及仪器指导教师:朱永凯2011-01南京航空航天大学硕士学位论文摘要目前,桥梁、大坝、天然气管道、风力发电场等大型设施安全问题不断出现,急需发展能有效地对这些设施的结构安全进行监测的技术,其中,设施应变的实时监测是结构健康监测的目标之一。
光学方法和光纤传感技术用于应变测量具有强抗干扰性、高测量精度、易于多路复用等诸多优点,通过对应变测量方法的分析,本文提出了基于光学低相干应变测量的方法。
对低相干法光纤应变测量技术进行了理论分析;设计构建了1550nm近红外波段放大自发辐射光源(Amplifier Spontaneous Emission,ASE)的全光纤光学低相干应变传感测量系统,分别对光路干涉模块、信号采集及处理模块、显示存储和控制模块进行了详细设计;软件部分,用LabVIEW 开发设计了具有良好人机交互性能的上位机软件平台;针对抑制色散、滤除信号干扰噪声等技术环节,研究了系统优化方法,提高了系统的测量精度及稳定性;提出了低相干应变测量用于拉伸和扭转的方法,可应用于结构件应变的监测。
系统性能验证结果表明系统的线性度达到±0.44%,重复性可达到0.4%,传感性能良好;应用实验表明,系统能灵敏地检测出结构件发生拉伸和扭转形变的趋势及形变量,具有很好的应用价值。
该研究为全光纤低相干应变测量技术的进一步应用奠定了基础。
关键词:光学低相干,应变测量,测控系统,LabVIEW,信号处理I基于低相干法的光纤应变测量技术及其应用研究IIABSTRACTAt present, the safety problems of bridges, dams, natural gas pipelines, wind farm and other largeinfrastructure are increasing quickly, there is a great demand for the technology in the safety monitoring of these facilities structure, while the real-time monitoring of facilities strain is one of its goals.Optical method and optical fiber sensing technology have many advantages such as strong anti-jamming, high measurement precision and easy to multiplexing when they were used in strain measurement, this paper puts forward low coherent strain measurement method through the analysis of strain measurement method, and low coherent method of optical fiber strain measurement technology was analyzed in theory as well. A strain measurement system of 1550nm Amplifier Spontaneous Emission (ASE) was designed based on the optical low-coherence interference theory, which carried on the detailed design on optical road, the signal interference module collection, processing module, display storage and control module, respectively. In software section, with the LabVIEW a good human-machine interaction properties of PC software platform was designed as well. In order to restrain dispersion and filter signal noise interference, the method of system optimization had been studied which was also enhanced the measurement's precision and stability. The method that low coherent strain measurement used in tensional deformation and torsion deformation can also be applied in the monitoring of structure strain.The system performance experiment showed that the linearity of the system was ±0.44% and the repeatability was 0.4%, and sensing capacity is good. While the experimental studies of this system demonstrated that the system can be sensible to detect the trend and deformation of structure's tensional deformation and torsion deformation, which has good application value. The research will lay the foundation for the further study of all-optical strain measurement technique.Key words: Optical Low-coherence, Strain Measurement, Monitoring and Control System, LabVIEW, Signal Processing南京航空航天大学硕士学位论文图清单图1.1杭州湾跨海大桥 (1)图1.2海上风力发电场 (1)图1.3明尼阿波利斯塌桥 (2)图1.4光纤应变测量方法总结 (4)图2.1不同相干信号随反射平面镜位移变化图 (7)图2.2光学低相干应变测量系统光路图 (11)图2.3低相干最小测量系统组成原理图 (12)图2.4带功能扩展的应变测量系统组成原理框图 (13)图2.5三点弯曲测量法原理图 (16)图2.6三点弯曲测量法受力模型图 (16)图2.7三点弯曲法的应力量与曲率半径R及曲率1/R的关系曲线图 (17)图2.8被测件受力弯曲几何受力模型图 (17)图3.1应变测量系统整体组成框图 (19)图3.2全光纤光路干涉模块的组成原理图 (20)图3.3光电探测电路组成原理图 (23)图3.4构建的光路干涉模块实物图 (24)图3.5干涉信号频谱分析图 (25)图3.6PLV单通道模拟量输入子VI信息 (26)图3.7包络检波分析功能软件界面图 (27)图3.8截取点数固定(100点),最值点数不同的包络曲线图 (28)图3.9截取点数与最值点数比例固定(4:1)的包络曲线图 (29)图3.10包络检波子程序算法实现流程图 (30)图3.11系统信号采集及处理模块软件设计流程图 (31)图3.12波形图表(W A VEFORM C HART)控件 (32)图3.13生产者/消费者设计模式(数据)的实现框图 (33)图3.14XY图(XY G RAPH)控件 (33)图3.15XY图追加显示功能的实现框图 (34)图3.16系统软件字符串显示控件 (34)图3.17用时间命名文件子VI的设计 (35)V基于低相干法的光纤应变测量技术及其应用研究图3.18测量结果导出程序框图 (35)图3.19电机通信子VI的设计 (37)图3.20电机控制平台的软件实现框图 (38)图3.21单点应变测量控制程序流程图 (39)图3.22系统软件中选项卡控件的使用界面图 (40)图3.23系统软件整体运行流程图 (40)图4.1传感检测样品的制作原理参数及实物图 (42)图4.2实验用环氧树脂胶及固化剂实物图 (43)图4.3构建的应力施加平台实物图 (43)图4.4系统重复性实验结果图 (44)图4.5对实验数据求平均后的结果图 (45)图4.6测量结果的直线拟合曲线图 (45)图4.7实测应变值和理论应变值间的对比曲线图 (47)图4.8等强度梁拉伸形变测量实验的光纤贴覆图 (50)图4.9拉伸形变测量坐标图 (51)图4.10扭转检测实验的光纤贴覆图 (52)图4.11扭转形变检测结果坐标图 (53)VI南京航空航天大学硕士学位论文表清单表1.1应变测量方法比较 (2)表3.1ASE宽带光源典型性能参数表 (21)表3.2C0617183光纤耦合器典型性能参数表 (21)表3.3EMP605光电二极管典型性能参数表 (23)表3.47STA04150A电动平移台典型性能参数表 (24)表3.57SC303三轴运动控制器控制指令表 (36)表4.1对测量数据进行的相关分析表 (48)表4.2拉伸形变测量数据分析表 (51)表4.3扭转形变检测数据分析表 (52)VII基于低相干法的光纤应变测量技术及其应用研究VIII 注释表 r E 参考光电场s E 传感光电场 ()l I 总光强*s E s E 的复共轭矢量 c 真空光速l 光程差 0λ 光源中心波长()t υ 参考镜移动速度 0E 初始场S 传感镜反射比 ()τΓ 光谱分布自相关函数()τγ 复相干度 ()arg 相位角函数0ω 宽带光源中心频率 ()νG 光源功率谱函数c l 宽带光源相干长度 νΔ 宽带光源半高全宽λΔ 宽带光源功率谱波长宽度 τ 时间延迟m 施力顶针应力量 n 支撑顶针间距离d 检测光纤中轴与中性层间距离 R 曲率半径ρ 曲率 θ 受力中性层所对圆心角θ′ 应变检测光纤所对圆心角 0L 应变检测光纤初始长度L Δ 应变检测光纤长度变化量 ε 应变s 峰值与信号采集起点间距离 v 扫描速度t 扫描时间 L 线性度ξ 线性误差 i S 重复性i W 极差 n d 极差系数k相关系数承诺书本人郑重声明:所呈交的学位论文,是本人在导师指导下,独立进行研究工作所取得的成果。
Research on Lower Coherence Interferometer andcorresponding optic fiber sensorCheng-yu Hong Jian-hua YinDepartment of Urban and Civil Engineering Department of Civil and Structural Engineering Shenzhen Graduate School, Harbin Institute of Technology Hong Kong Polytechnic UniversityShenzhen, P. R. China, 518055 Hong Kong. P. R. ChinaE-mail:joeyhcy@ E-mail:cejhyin@.hkYou-hua Fan Chao WangDepartment of Urban and Civil EngineeringShenzhen Graduate School, Harbin Institute of Technology Bookham companyShenzhen, P. R. China, 518055 Shenzhen, P. R. China, 518055E-mail:yhfan@ E-mail:wangchao_prc@AbstractApplying lower coherence interferometer executes scan of optic fiber sensor under different environmental state. Factors influence accuracy of results can be obtained through comparison between above tests, which are shown in details in this paper. Repeating test of optic fibers is completed as a part of calibration, an accuracy of 4um can be achieved as well. Data acquisition and data analysis are accomplished by the software of Labview. Installing reference point on signal arm to eliminate the deviation of initial scan time and reduce the error of lower coherence system.Keywords:optic fiber sensor,repeating test,Labview,reference point1. IntroductionLower coherence interferometer is widely used in civil engineering area[1], and its principal is similar to Mach–Zehnder interferometer [2], meanwhile, the strain sensing array has been produced [2]. New apparatus is produced according to Michelson interference principal as is shown in Figure 1. Wide spectrum light split into signal arm from laser source, generate signal R1 and R2 by the sensors with different reflectivity along signal arm, as is shown in Figure 1. An optical path difference b generated. Signal R1 and R2 reflected passes through the 2×2 coupler with power ratio 50: 50, divided into two branches, one is to the reference arm, and the other is to the mirror. R1 and R2 will be reflected both by reference arm and mirror on the electromotor, split into coupler again to achieve PIN[3].Interference willFigure 1: Working principal of optic fiber sensor based on Michelson white light interferometerbe generated as soon as light path differences satisfy equation 2-1:T c 0102n L n L L +−≤[4] (2-1)0n is the refractive index, c L is the lowest length of interference. Position of the highest peak, whichlocates in the center of the interference peak, corresponds to the exact optical path matching of these two arms. That is T 0102n L n L +=[5]. Light path difference between two arms will change along with scan continuing.Light power output satisfies the following equation:{}I R P +P (t)-(t)]ref dut ref dut φφ=[6](2-2)As is shown in equation 2-2, I is power of interference signal finally. R is responsibility of diode; P ref is power of reference light reflected, P dut is the power of the light reflected by mirror, (t)ref φ is phaseof reference light reflected, (t)dut φis phase of light reflected by mirror.Speed of electromotor is invariable; meanwhile interval of peaks generated can be recorded by computer, thus changing in displacement of the section can be detected through the product of interval and electromotor speed.2. Repeating TestScanning is carried out on fibers under different environmental conditions: first one is encapsulated in aluminum slot with epoxy[2] as is shown in figure 2, material for encapsulation is epoxy; the other one sticks to desk directly with adhesive tape, no force applied on both of these two conditions.Figure 2: Fiber encapsulating into aluminum slotBased on the working principal of lower coherence Michelson interferometer, calibration test is carried out in lab. Continue scanning on the same fiber under no force; and execute data acquisition by Labview software. Comparison work can be carried out in this way. Keep repeating scan for five times on a fiber with five sensors which have no encapsulation, therefore, three differences of distance between twoFiber encapsulated with epoxy in aluminum slotOptic Fiberadjacent sensors can be obtained, as is shown in figure 3 to 5 , fiber isn’t encapsulated in aluminum slot: According to three scan results in figure3-5, maximum value can be obtained separately from above results. They are 7.3709mm , 6.0436mm , and 8.7050mm , which tell the difference of adjacent section on fiber. Meanwhile minimum value can be obtained through figure1-3: 7.3600mm , 6.0277mm , and 8.6815mm . Therefore, differences can be reached through calculation.Figure 3: First section of scan result Figure 4: Second section of scan resultFigure 5: Third section of scan result Figure 6: First section of encapsulate fiberFigure 7: Second section of encapsulate fiber Figure 8: Third section of encapsulate fiberMaximum differences are 9.1um , 15.9um and 13.5um separately. Scan result should be stable as neither force nor displacement applied. Scan test is continuing as soon as fiber is encapsulated in aluminum slot, corresponding results are shown in figure 4-6. Scan test is carried out for eight times on the same fibersensor, maximum values of repeating tests are 17.0654mm, 9.4818mm, and 17.5488mm. The corresponding minimum values are 17.0610mm, 9.4769mm, and 17.5419mm. It is evidently that the differences reduced a lot as environmental influence reduced to minimum. Effect of epoxy increases accuracy to higher level. The maximum gap between maximum and minimum is 6.9um, the average of these data is right the average of maximum and minimum. Accuracy is less than 4um if average value is taken as the final result.It is apparently that environmental influence is the main reason that higher accuracy can’t be reached through scanning on fibers without encapsulation. Therefore, more attention should be paid on environmental influence when carrying out fiber scanning.3. Improvement on interferometer systemElectromotor as a part of lower coherence system is significant to the result accuracy, the initial time of electromotor may vary from time to time, and following scan results can be obtained if difference of initial time exists according to figure 9: the update way to improve accuracy is installing sensor “a” on signal arm as is shown in figure.1, following results can be obtained in figure 10, scan result should be shown in figure 10 theoretically if the reference point “a” installed on signal arm. After improvement, the result is irrelevant to the start time deviation, which could be as accurate as the value from peak-to-peak calculation.Fig.9 Start time variety of scan Fig.10 Final result after improving4. Discussion on electromotor of low coherence interferometerApplying electromotor in lower coherence interferometer system will be one of the error sources as speed of electromotor may not be as stable as we believe. Labview software is the data acquisition and analysis software. Corresponding relationship between length of stage T and sensor length b in figure 1 is adopted to investigate length difference of adjacent sensors [6]. The product of scan speed and interval that adjacent peaks appear is b in figure 1. Unstable speed of electromotor maybe caused by electromotor and changing in friction of scan stage, therefore it should be noticed that keeping the scan stage T clean in figure 1 and maintain good quality of electromotor is the crucial section to get high accuracy result.5. ConclusionsComparison between fibers with and without encapsulation shows following conclusions:1 Environmental factor is the main reason that higher accuracy result of scan can’t be reached from thetwice repeating scan tests. Error decreases from more than 10 micro strains without encapsulation to less than 4 micro strains with encapsulation with epoxy.2 Adoption of reference point can reduce the deviation in initial time of electromotor, which will decreasethe fluctuation of interferential peaks as is shown in figure 9 and figure 10.3 Speed of the electromotor is another factor that influences accuracy of scan result, which should be stableall the time, meanwhile maintains cleanness of scan stage is also important.References[1] D.Inaudi, A.Elamari, L.Pflug, N. Gisin, J. Breguet, S. Vrupillot. (1994) Low-coherence deformation sensors for themonitoring of civil-engineering structures, Sensors and Actuators A 44 pp. 125-130[2] Qingbin Li, Libo Yuan, Chongjie Liu, Yuxin Jie, Guangxin Li, (2007) Twin multiplexing strain sensing array basedon a low-coherence fiber optic Mach–Zehnder interferometer, Sensors and Actuators. A 135 pp. 152–155[3] Yang Zhao, Farhad Ansari. (2002) Embedded fiber optic sensor for characterization of interface strains in FRPcomposite, Sensors and Actuators A 100 pp. 247-251[4] Qingbin Li, Guang Li, Libo Yuan. (2004). Calibration of embedded fiber optic sensor in concrete under biaxialcompression. Measurement 35 pp. 303-310[5] Jun Yang, Libo Yuan. (2005) Configuration of fiber optic sensor network with an embedded-loop topology, ChineseJournal of Lasers, vol.32, No.10[6] Li Boyuan, Qingbin Li, Yijun Liang, Jun Yang, Zhihai Liu. (2001) Fiber optic 2-D sensor for measuring the straininside the concrete specimen. Sensors and Actuators A 94 pp. 25-31。