最新a类雅思小作文9分范文
- 格式:doc
- 大小:15.15 KB
- 文档页数:7
雅思写作真题9分范文Is learning a foreign language essential or awaste of time一、原题:Some people feel that learning a foreign language is an essential component of a child's education. Others feel that learning a foreign language is often a waste of time that can be better spent on learning about technology and other more vocational subjects.Discuss both views and give your own opinion.Give reasons for your answer and include any relevant examples from your knowledge or experience.You should write at least 250 words.二、范文:Throughout the history of education, learning a foreign language or languages has been a constant component. Of course, many people feel that this is really an unnecessary part of education for everyone, but this is not a point of view that I share.在整个教育史上,学习一门或多门外语一直是一个不变的组成部分。
当然,许多人认为这对每个人来说都是教育中不必要的部分,但我不同意这种观点。
每天学习一篇雅思写作9分范文(学生生活类)Some people say university students should payfortheir tuition fees. Some others say the governmentshould pay for the tuition fees. What is your opinion?范文示例In this time and age, higher education is advancingat an alarming rate.A sizable percentage of thepeople hold the opinion that the government shouldbe responsible for the full tuition of collegestudents.They claim that after graduation college students willmake much contribution to the society. Thisargument is true to some degree. However, I amconvinced that university students should supportthemselves for the full tuition,There are manyreasons sup-porting my view.今天,高等教育以惊人的速度在发展。
相当多的人认为,政府应当对大学生的全部学费负责。
他们认为,大学生毕业后将为社会做出很多贡献。
这个观点在某种程度上是对的。
然而,我认为大学生应当自已支付他们的高等教育费用。
有很多原因支持我的观点。
The main reason is that it can ensure the quality ofcollege education, College education needs manywell-paid professors and various advanced otherwords, it needs a great sum of money. If the college studentsdo not pay the tuition fee, it will lay a heavyburden on the government.lf the government is unable toinvest enough money on university education because ofthe limited budget, the quality of education cannot beensured.主要的原因是,这样能够确保教育的质量。
雅思a类小作文我要给小伙伴们讲讲我的学校生活,就像雅思A类小作文那样描述一下。
我每天早上背着小书包走进学校。
学校的大门可大啦,像一个巨人张着大嘴巴。
一进大门就能看到好多好多树,那些树就像一个个士兵站得笔直笔直的。
走进教室,教室里可热闹了。
同学们有的在读书,声音像小鸟在唱歌。
有的在聊天,叽叽喳喳的。
我的小桌子和小凳子就在窗户旁边,从窗户往外看,可以看到操场。
操场是绿色的,就像一大块绿色的毯子。
上课铃响了,老师走进来。
老师讲课可有趣了,她拿着粉笔在黑板上写着字,那些字就像一个个小精灵。
我们认真地听着,眼睛都盯着老师。
有时候老师会提问,大家都把手举得高高的,像一片小树林。
课间休息的时候,我们就像一群小猴子,跑到操场上去玩。
有的跳绳,跳绳在空中甩来甩去,发出呼呼的声音。
有的在踢毽子,毽子像一只彩色的小鸟在脚上飞来飞去。
到了中午,我们去食堂吃饭。
食堂里飘着香味,饭菜可好吃了。
有白白的米饭,像珍珠一样。
还有各种菜,比如红烧肉,那肉红红的,咬一口油滋滋的。
下午的课也很有趣。
美术课的时候,我们用彩笔画画,把白纸变得五颜六色的。
音乐课上,我们唱歌,歌声在教室里回荡。
放学了,我们排着队走出学校。
我回头看看学校,觉得在学校的一天可真开心呀。
小伙伴们,今天我要写一写我最爱的小动物,就像雅思A类小作文那样。
我最喜欢的小动物是小猫咪。
小猫咪的身体软软的,就像一团棉花。
它的毛可滑溜了,每次摸它的时候,感觉手就像在丝绸上滑过一样。
小猫咪的眼睛又大又圆,像两颗亮晶晶的宝石。
在晚上的时候,它的眼睛还会发光呢,就像小灯笼。
它的耳朵尖尖的,像两个小三角形。
只要有一点动静,它的耳朵就会动来动去,就像两个小雷达在探测。
小猫咪可调皮了。
有一次,我在写作业,它就跳到我的桌子上,把我的笔都弄掉了。
它还在我的本子上踩了几个小梅花印,可有趣了。
还有一次,它看到一个小毛球,就追着小毛球跑,跑来跑去,像一个小疯子。
小猫咪也很爱睡觉。
它常常找一个暖和的地方,然后把身体蜷成一团,闭上眼睛就呼呼大睡起来。
雅思九分作文范文题目:Some people prefer to live in a small town. Others prefer to live in a big city. Which place would you prefer to live in? Use specific reasons and details to support your answer.范文:Well, if you ask me whether I'd rather live in a small town or a big city, it's like choosing between a cozy little nook and a bustling beehive. And I've got to say, I'm more of a big city kind of person.First off, big cities are like a never ending carnival of opportunities. There are jobs galore! I mean, whether you want to be a high flying corporate hotshot, an avant garde artist, or a whiz kid techie, a big city has got your back. In a small town, your career options might be as limited as the flavors at the local ice cream parlor you know, just vanilla and chocolate, while in the city, it's like having a 31 flavor bonanza ofcareer choices.Then there's the food. Oh, man! Big cities are a foodie's paradise. You can have sushi for breakfast, tacos for lunch, and a plate of authentic Italian pasta for dinner, all within a few blocks. In a small town, you might be stuck with the same old diner grub day in and day out. It's like eating the same song on repeat, while in the city, it's a whole differenthit every meal.Entertainment is another huge plus in the big city. Concerts, theaters, art galleries you name it. There's always something going on. It's like living inside a perpetual movie premiere. In a small town, your idea of awild night out might be a game of bingo at the community hall. I don't know about you, but I'd rather be dancing at a trendy nightclub or catching a live band at a smoky underground bar.Sure, small towns have their charm. The peace and quiet, the friendly neighbors who know your name and your family history. It's like living in a big, warm hug. But for me, the energy, the variety, and the constant buzz of a big city are just too hard to resist. It's like the city is a big, shiny magnet, and I'm just a little piece of metal helplessly drawn to it. So, give me the skyscrapers, the traffic jams, and the anonymous crowds any day. Because in the city, I feel like I'm part of a huge, exciting story, and that's just the kind of life I'm after.。

雅思作文满分范文(5篇)(经典版)编制人:__________________审核人:__________________审批人:__________________编制单位:__________________编制时间:____年____月____日序言下载提示:该文档是本店铺精心编制而成的,希望大家下载后,能够帮助大家解决实际问题。
文档下载后可定制修改,请根据实际需要进行调整和使用,谢谢!并且,本店铺为大家提供各种类型的经典范文,如工作总结、工作计划、合同协议、条据文书、策划方案、句子大全、作文大全、诗词歌赋、教案资料、其他范文等等,想了解不同范文格式和写法,敬请关注!Download tips: This document is carefully compiled by this editor. I hope that after you download it, it can help you solve practical problems. The document can be customized and modified after downloading, please adjust and use it according to actual needs, thank you!Moreover, our store provides various types of classic sample essays for everyone, such as work summaries, work plans, contract agreements, doctrinal documents, planning plans, complete sentences, complete compositions, poems, songs, teaching materials, and other sample essays. If you want to learn about different sample formats and writing methods, please stay tuned!雅思作文满分范文(5篇)雅思作文满分范文第1篇下面给大家讲解一下小作文的心得和训练方法:小作文(A类)心得:为考的是A类,这里只说A类,留学生的话也建议考A类,平时写报告其实就是在练小作文,尤其是理工科。

雅思写作9分范文The following is a sample essay written by a student who achieved a band score of 9 on the IELTS Writing task.Topic: The role of advertisements in our modern society.In our modern society, advertisements play a significant role in shaping our choices and influencing our behavior. From billboards on busy streets to pop-up ads on websites, we are constantly bombarded with advertising messages. While some argue that advertisements have a negative impact on society, I believe that when used responsibly, they can be valuable sources of information and entertainment.Firstly, advertisements provide us with valuable information about products and services. In today's competitive market, companies are constantly striving to gain an edge over their competitors. Advertisements serve as a platform for these companies to communicate the features and benefits of their products to potential customers. For example, pharmaceutical companies use advertisements to educate the public about new medications and their potential side effects. Without such advertisements, people would be less informed about their healthcare options. Furthermore, advertisements can be a source of entertainment. Many advertisements these days are designed to be visually appealing and amusing, using creative storytelling techniques and humor to capture the attention of the audience. For instance, Super Bowl commercials have become as eagerly anticipated as the game itself, with companies spending millions of dollars to createentertaining and memorable ads. These ads not only entertain us but also provide a welcome break from the mundane television programming.Moreover, advertisements stimulate economic growth by creating demand and driving consumption. The power of advertisements to influence consumer behavior is well-documented. Advertisements create a desire for products, which in turn stimulates demand and drives consumption. This, in turn, stimulates economic growth by creating jobs, generating tax revenue, and improving the overall standard of living. For example, a successful advertising campaign can lead to increased sales for a company, enabling them to hire more employees and invest in new technologies.Of course, it is important to acknowledge the negative aspects of advertising as well. Advertisements often promote unrealistic beauty standards, leading to body image issues and low self-esteem, especially among young people. Moreover, advertisements can sometimes be misleading or manipulative, making exaggerated claims about the effectiveness or safety of a product. However, it is crucial to remember that these negative aspects are not inherent to advertisements themselves, but rather a result of unethical practices by certain advertisers. Therefore, it is essential to regulate the advertising industry and ensure that advertisements are truthful, fair, and do not exploit vulnerable populations.In conclusion, advertisements play an important role in our modern society. When used responsibly, they provide valuable information about products and services, entertain us, and stimulate economic growth. While it is important to address the negative aspects ofadvertising, it is also crucial to recognize the potential benefits they bring. By striking a balance between freedom of expression and consumer protection, we can harness the power of advertisements to drive positive change in our society.。
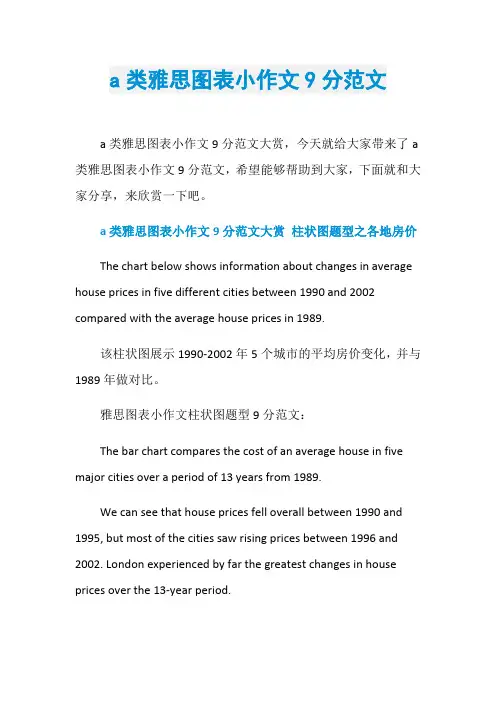
a类雅思图表小作文9分范文a类雅思图表小作文9分范文大赏,今天就给大家带来了a 类雅思图表小作文9分范文,希望能够帮助到大家,下面就和大家分享,来欣赏一下吧。
a类雅思图表小作文9分范文大赏柱状图题型之各地房价The chart below shows information about changes in average house prices in five different cities between 1990 and 2002 compared with the average house prices in 1989.该柱状图展示1990-2002年5个城市的平均房价变化,并与1989年做对比。
雅思图表小作文柱状图题型9分范文:The bar chart compares the cost of an average house in five major cities over a period of 13 years from 1989.We can see that house prices fell overall between 1990 and 1995, but most of the cities saw rising prices between 1996 and 2002. London experienced by far the greatest changes in house prices over the 13-year period.Over the 5 years after 1989, the cost of average homes in Tokyo and London dropped by around 7%, while New York house prices went down by 5%. By contrast, prices rose by approximately 2% in both Madrid and Frankfurt.Between 1996 and 2002, London house prices jumped to around 12% above the 1989 average. Homebuyers in New York also had to pay significantly more, with prices rising to 5% above the 1989 average, but homes in Tokyo remained cheaper than they were in 1989. The cost of an average home in Madrid rose by a further 2%, while prices in Frankfurt remained stable.(165 words)雅思小作文考官范文基本套路段一:话题重述段二:概括话题数据的主要特征或规律段三:详述特征规律一段四:详述特征规律二a类雅思小作文9分范文分享饼图题型之酒店服务问卷The charts below show the results of a questionnaire that asked visitors to the Parkway Hotel how they rated the hotelscustomer service. The same questionnaire was given to 100 guests in the years 2005 and 20XX.该饼图展示在2005年和20XX年Parkway 酒店针对客人对酒店服务质量的评价所做的调查问卷的2次结果。
2024雅思9分口语范文话题:Describe an interesting place you have visited(描述一个你去过的有趣的地方)Well, I gotta tell you about this amazing place I once visited Bangkok, the capital city of Thailand.You know, as soon as I landed there, it was like stepping into a whole new world. The first thing that hit me was the hustle and bustle. There were people everywhere, but not in a bad way. It was just so full of life.The streets were filled with these super colorful markets. I mean, they had everything from the most beautiful hand made handicrafts that looked like they were straight out of a fairytale, to the yummiest street foodthat smelled so good it could make your mouth water just walking past.And the temples! Oh my god. They were just spectacular. One temple I visited, I think it was Wat Arun, had these huge, pointy spires that were all covered in these little bits of shiny glass or porcelain. When the sun hit them, it was like the whole temple was on fire. It was that dazzling.Another really cool thing was the tuk tuks. They're like these three wheeled taxis that zip around the city like crazy. Riding in one was like being on a rollercoaster. You feel the wind in your hair, and the driver is usually blasting some really loud Thai pop music. It was a wild ride every time.I also met some really friendly locals. They always had a big smile on their face, and even though my Thai was basically non existent, we could still communicate with hand gestures and a few broken English words. They made me feel really welcome in their city.All in all, Bangkok is a place that has it all amazing sights, delicious food, exciting rides, and super friendly people. It's just a place that once you visit, you'll never forget.。
雅思(ielts)考试作文9分范文及点评雅思考试作文9分例文题目:Children who grow up in families which are short of money are better prepared to dealwith the problems of adult life than children who are brought up by wealthy parents. To what extent do you agree or disagree?范文:Some feel that the children of low income families are better equippedto deal with difficulties posed by the 'real world' when they grow up and they also believe the privileged children of wealthy families are less fit to deal with these difficulties . The implications and veracity of this argument seem self-evident, but in fact require closer examination.( 58words )点评:1+ 1 ' 模式,最后1 句为主题句。
此段的主题句稍微有点特殊,它的确否定了前面所提到的观点,从而表达出了自己的观点,此外还引出了下文。
特别是最后半句:but in fact require closer examination ,感觉是在抛砖引玉。
The popular wisdom is that children of poorer familieslearn early on the value of a buck, and are thus naturallybetter suited to stretching money when times get tough in adulthood. Inversely, the children of wealthy families, thoseborn with a silver spoon in their mouths, are believed to be completely ignorant of the value of money, having had everything provided for them in their youth and oftentimes erroneously expecting the same situation in adulthood. They are believed to be prone to overspending and financialirresponsibility. This belief, though logical, overlooks one key point which is , of course, education. (100words)点评:1 ' +3 模式,第1 句是主题句。

雅思口语9分范文话题:Describe an interesting place you have visited.Answer:Well, I've gotta tell you about this super cool place I visited last year it was a small town called Jiufen in Taiwan.As soon as I got there, I was just blown away by the whole atmosphere. It's like stepping into a time warp. The narrow, winding streets are lined with these old fashioned shops and cafes. There are these red lanterns everywhere, hanging from the rooftops and doorways, giving the place a really warm and inviting glow, like it's straight out of a movie set.The smell in the air was amazing too. You had all these different scents mixing together the smell of freshly made tea from the tea houses, the sweet aroma of traditional Taiwanese snacks like taro balls and pineapple cakes. It was like a foodie paradise. I remember I went into this one little tea house. The owner was this really friendly old lady. She showed me all these different kinds of tea leaves and told me the stories behind each one. It was like a mini tea education session.And the view from the town! Oh my god. You could see the ocean in the distance, with the waves crashing against the shore. It was a really peaceful sight. I sat on a bench overlooking the view for ages, just taking it all in. There were also a lot of artists in Jiufen. You could see them painting on the streets, creating these beautiful works of art inspired by the town itself.I think what made Jiufen so interesting was not just the physical beauty of the place, but also the sense of history and culture that youcould feel everywhere. It was like every corner had a story to tell, and I can't wait to go back there again someday.。
剑桥雅思写作9分范文全文共四篇示例,供读者参考第一篇示例:剑桥雅思写作9分范文是许多考生梦寐以求的目标,因为在雅思考试中,写作部分是考生们最容易失分的一个环节,而如果能够获得9分的成绩,不仅可以为自己的留学梦想加分,还可以为自己的英语水平证明注入信心。
下面我将为大家分享一篇剑桥雅思写作9分范文,供大家参考。
雅思写作的主题通常是关于社会、文化、环境等方面的话题,以此来考察考生们对于当今社会问题的理解和分析能力。
以下是一篇经典的剑桥雅思写作9分范文:题目:现代社会中越来越多的年轻人选择过简单的生活方式,他们放弃了追求财富和名利的念头,转而追求简单而真实的生活。
请你谈谈对这种趋势的看法。
范文:In today's society, more and more young people are choosing to live a simple life. They are abandoning the pursuit of wealth and fame, instead opting for a simple and authentic lifestyle. This trend has sparked a heated debate among people.On the one hand, those who support this trend argue that the pursuit of simplicity can bring a sense of peace and contentment to individuals. In a fast-paced and materialistic society, many young people feel overwhelmed by the pressureto succeed and constantly compare themselves to others. By choosing to live a simple life, they can focus on what truly matters to them, such as personal relationships, health, and personal growth. Moreover, living a simple life can also have positive effects on the environment, as it involves consuming less and reducing waste.以上就是一篇经典的剑桥雅思写作9分范文,希望对大家有所帮助。
【导语】为了⼤家能够更好地备考雅思考试,今天特意为⼤家整理了雅思考官级9分范⽂:我们应该只关⼼⾃⼰的国家吗,希望对⼤家有帮助! 范⽂: Some people believe that we should not help people in other countries aslong as there are problems in our own society. I disagree with this view becauseI believe that we should try to help as many people as possible. On the one hand, I accept that it is important to help our neighbours andfellow citizens. In most communities there are people who are impoverished ordisadvantaged in some way. It is possible to find homeless people, for example,in even the wealthiest of cities, and for those who are concerned about thisproblem, there are usually opportunities to volunteer time or give money tosupport these people. In the UK, people can help in a variety of ways, fromdonating clothing to serving free food in a soup kitchen. As the problems are onour doorstep, and there are obvious ways to help, I can understand why somepeople feel that we should prioritise local charity. At the same time, I believe that we have an obligation to help those wholive beyond our national borders. In some countries the problems that peopleface are much more serious than those in our own communities, and it is ofteneven easier to help. For example, when children are dying from curable diseasesin African countries, governments and individuals in richer countries can savelives simply by paying for vaccines that already exist. A small donation to aninternational charity might have a much greater impact than helping in our localarea. In conclusion, it is true that we cannot help everyone, but in my opinionnational boundaries should not stop us from helping those who are in need. (280 words, band 9)。
雅思写作9分(1)份雅思写作9分 1范文:It is true that foreign films are more popular in many countries than domestically produced films. There could be several reasons why this is the case, and I believe that governments should promote local film-making by subsidising the industry.There are various reasons why many people find foreign films more enjoyable than the films produced in their own countries. Firstly, the established film industries in certain countries have huge budgets for action, special effects and to shoot scenes in spectacular locations. Hollywood blockbusters like ‘Avatar’ or the James Bond films are examples of such productions and the global appeal that they have. Another reason why these big-budget films are so successful is that they often star the most famous actors and actresses, and they are made by the most plished producers and directors. The poor quality, low-budget filmmaking in many countries suffers in parison.In my view, governments should support local film industries financially. In every country, there may be talented __ film-makers who just need to be given the opportunity to prove themselves. To pete with big-budget productions from overseas, these people need money to pay for film crews, actors and a host of other costs related to producing high-quality films. If governments did help with these costs, they would see an increase in employment in the film industry, e from film sales, and perhaps even a rise in tourist numbers. New Zealand, for example, has seen an increase in tourism related to the 'Lord of the Rings' films, which were partly funded by government subsidies.In conclusion, I believe that increased financial support could help to raise the quality of locally made films and allow them to pete with the foreign productions that currently dominate the market.(295 words, band 9)。
a类雅思小作文9分范文分享a类雅思小作文9分范文之表格题之家庭贫困率,今天就给大家带来了a类雅思图表小作文9分范文,希望能够帮助到大家,下面就和大家分享,来欣赏一下吧。
a类雅思小作文9分范文表格题之家庭贫困率The table below shows the proportion of different categoriesof families living in poverty in Australia in 1999.该表格1999年澳大利亚不同类型的家庭的贫困率。
请作答。
雅思图表小作文表格题型9分范文:The table gives information about poverty rates among six types of household in Australia in the year 1999.It is noticeable that levels of poverty were higher for single people than for couples, and people with children were more likely to be poor than those without. Poverty rates were considerably lower among elderly people.Overall, 11% of Australians, or 1,837,000 people, were living in poverty in 1999. Aged people were the least likely to be poor, withpoverty levels of 6% and 4% for single aged people and aged couples respectively.Just over one fifth of single parents were living in poverty, whereas only 12% of parents living with a partner were classed as poor. The same pattern can be seen for people with no children: while 19% of single people in this group were living below the poverty line, the figure for couples was much lower, at only 7%.(150 words, band 9)附雅思小作文考官范文基本套路段一:话题重述段二:概括话题数据的主要特征或规律段三:详述特征规律一段四:详述特征规律二注意:simon考官主张雅思小作文无须总结!大家可留心这一点。
剑桥雅思写作9分范文如下:It is a contentious issue whether the minimum legal age for operating motor vehicles should be raised as a means of improving road safety. While some argue that this measure could lead to fewer accidents, others contend that it might not effectively address the root causes of traffic incidents. I largely side with the latter perspective, as I believe that maturity and responsible behavior are more crucial factors than age in ensuring safe driving practices.Firstly, it must be acknowledged that younger drivers are often involved in a higher proportion of accidents due to their relative inexperience and risk-taking tendencies. Raising the legal driving age could theoretically reduce the number of these high-risk drivers on the roads. However, simply increasing the age limit does not guarantee that older drivers will be inherently safer or more responsible. Maturity levels vary significantly among individuals, and some may still lack the judgment or restraint necessary for safe driving, regardless of their age.Moreover, focusing solely on age ignores other critical factors that contribute to traffic accidents. For instance, distracted driving, often linked to the use of mobile phones while behind the wheel, is a significant cause of collisions. This issue transcends age boundaries, and thus, implementing stricter laws against distractions and improving driver education could have a more substantial impact on road safety.Furthermore, it is essential to consider the potential consequences of raising the minimum legal driving age. It could limit opportunities for young people to gain valuable experience at an earlier age, which might result in them becoming safer, more skilled drivers in the long run. Additionally, it could impose challenges on those who rely on vehicles for work or access to essential services, particularly in areas with limited public transportation options.In conclusion, while increasing the minimum legal age for driving might lead to some improvements in road safety, it is not a panacea for the problem. A more comprehensive approach that emphasizes better driver education, stricter enforcement of existing traffic laws, and measures to promote responsible driving behaviors would likelyyield more effective results. Therefore, I maintain that focusing on enhancing the overall quality of driving culture and practices is a more sensible strategy for achieving greater road safety than merely adjusting the age requirements.。
雅思小作文九分模板英文回答:To start off, it is important to have a clear understanding of the question and to organize your thoughts accordingly. Brainstorming ideas and creating an outline can help structure your response effectively. When writing, use clear and concise language, avoiding colloquialisms or slang. Divide your content into logical paragraphs, with each paragraph focusing on a specific aspect of the topic. Additionally, it is essential to support your ideas with specific examples and evidence to enhance the credibility of your response.Moreover, pay attention to the grammatical accuracy of your sentences and use a variety of sentence structures to avoid monotony. Employing transitional words and phrases can help create a smooth flow throughout your writing. Finally, proofread your response thoroughly to identify any errors in grammar, spelling, or punctuation beforesubmitting it.中文回答:1. 清晰理解问题,条理清晰地组织思路。
最新a类雅思小作文9分范文
最新a类雅思小作文9分范文,表格题之年垃圾产量,今天就给大家带来了a类雅思图表小作文9分范文,希望能够帮助到大家,下面就和大家分享,来欣赏一下吧。
最新a类雅思小作文9分范文表格题之年垃圾产量
The table below shows the amount of waste production (in millions of tonnes) in six different countries over a twenty-year period.
该表格展示6国在二十年跨度里的年产生垃圾量。
请作答。
雅思图表小作文图表题型9分范文:
The chart compares the amounts of waste that were produced in six countries in the years 1980, 1990 and 2000.
In each of these years, the US produced more waste than Ireland, Japan, Korea, Poland and Portugal combined. It is also noticeable that Korea was the only country that managed to reduce its waste output by the year 2000.
Between 1980 and 2000, waste production in the US rose from 131 to 192 million tonnes, and rising trends were also seen in Japan,
Poland and Portugal. Japan’s waste output increased from 28 to 53 million tonnes, while Poland and Portugal saw waste totals increase from 4 to 6.6 and from 2 to 5 million tonnes respectively.
The trends for Ireland and Korea were noticeably different from those described above. In Ireland, waste production increased more than eightfold, from only 0.6 million tonnes in 1980 to 5 million tonnes in 2000. Korea, by contrast, cut its waste output by 12 million tonnes between 1990 and 2000.(165)
(154 words, band 9)
附雅思小作文考官范文基本套路
段一:话题重述
段二:概括话题数据的主要特征或规律
段三:详述特征规律一
段四:详述特征规律二
注意:simon考官主张雅思小作文无须总结!大家可留心这一点。
当然小作文是否需要写总结段,无定论。
最新a类雅思小作文9分范文表格题之骑行上班
The table below shows changes in the numbers of residents cycling to work in different areas of the UK between 2001 and
20XX.
该表格展示2001到20XX年英国不同地区居民骑车上班的人数。
请作答。
雅思图表小作文表格题9分范文:
The table compares the numbers of people who cycled to work in twelve areas of the UK in the years 2001 and 20XX.
Overall, the number of UK commuters who travelled to work by bicycle rose considerably over the 10-year period. Inner London had by far the highest number of cycling commuters in both years.
In 2001, well over 43 thousand residents of inner London commuted by bicycle, and this figure rose to more than 106 thousand in 20XX, an increase of 144%. By contrast, although outer London had the second highest number of cycling commuters in each year, the percentage change, at only 45%, was the lowest of the twelve areas shown in the table.
Brighton and Hove saw the second biggest increase (109%) in the number of residents cycling to work, but Bristol was the UK’s second city in terms of total numbers of cycling commuters, with
8,108 in 2001 and 15,768 in 20XX. Figures for the other eight areas were below the 10 thousand mark in both years.
(172 words, band 9)
附雅思小作文考官范文基本套路
段一:话题重述
段二:概括话题数据的主要特征或规律
段三:详述特征规律一
段四:详述特征规律二
注意:simon考官主张雅思小作文无须总结!大家可留心这一点。
当然小作文是否需要写总结段,无定论。
最新a类雅思小作文9分范文表格题之年垃圾产量
The table below gives information on consumer spending on different items in five different countries in 2002.
该表格展示5国在不同品类商品上的消费金额(饮食,服饰,休闲教育)。
请作答。
雅思图表小作文表格题型9分范文:
The table shows percentages of consumer expenditure for three categories of products and services in five countries in 2002.。