Final Promotional year calender 2008 Holiday Inn Pudong
- 格式:xls
- 大小:64.00 KB
- 文档页数:1
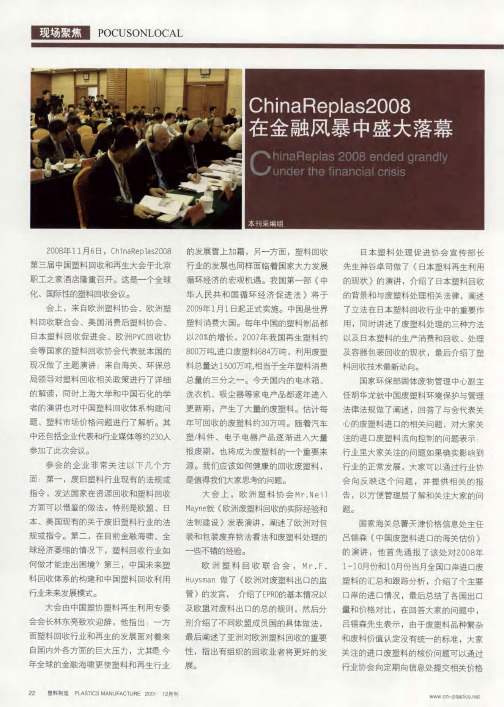

The Recession of 2008–2009In 2008 and 2009, the U.S. economy experienced a financial crisis and a severe downturn in economic activity. In many ways, it was the worst macroeconomic event in more than half a century.The story of this downturn begins a few years earlier with a substantial boomin the housing market. The boom was, in part, fueled by low interest rates. Inthe aftermath of the recession of 2001, the Federal Reserve lowered interest ratesto historically low levels. Low interest rates helped the economy recover, but by making it less expensive to get a mortgage and buy a home, they also contributedto a rise in housing prices.In addition to low interest rates, various developments in the mortgage market made it easier for subprime borrowers—those borrowers with a higher risk of default based on their income and credit history—to get loans to buy homes.One development was securitization, the process by which a financial institution (specifically, a mortgage originator) makes loans and then (with the helpof an investment bank) bundles them together into financial instruments called mortgage-backed securities. These mortgage-backed securities were then sold to other institutions (such as banks and insurance companies), which may not havefully appreciated the risks in these securities. Some economists blame inadequate regulation for these high-risk loans. Others blame misguided government policy: Some policies encouraged this high-risk lending to make the goal of homeownership more attainable for low-income families. Together, these many forces drove up housing demand and housing prices. From 1995 to 2006, average housing prices in the United States more than doubled.The high price of housing, however, proved unsustainable. From 2006 to 2009, housing prices nationwide fell about 30 percent. Such price fluctuations shouldnot necessarily be a problem in a market economy. After all, price movementsare how markets equilibrate supply and demand. In this case, however, the price decline had two related repercussions that caused a sizable fall in aggregate demand.The first repercussion was a substantial rise in mortgage defaults and home foreclosures. During the housing boom, many homeowners had bought theirhomes with mostly borrowed money and minimal down payments. When housing prices declined, these homeowners were underwater (they owed more on their mortgages than their homes were worth). Many of these homeowners stopped paying their loans. The banks servicing the mortgages responded to these defaultsby taking the houses away in foreclosure procedures and then selling them off.The banks’ goal was to recoup whatever they could from the bad loans. As you might have expected from your study of supply and demand, the increase in the number of homes for sale exacerbated the downward spiral of house prices. As house prices fell, spending on the construction of housing also collapsed.A second repercussion was that the various financial institutions that owned mortgage-backed securities suffered huge losses. In essence, by borrowing largesums to buy high-risk mortgages, these companies had bet that house priceswould keep rising; when this bet turned bad, they found themselves at or nearthe point of bankruptcy. Because of these large losses, many financial institutionsdid not have funds to loan out, and the ability of the financial system to channel resources to those who could best use them was impaired. Even creditworthy customers found themselves unable to borrow to finance investment spending.As a result of all these events, the economy experienced a large contractionary shift in aggregate demand. Real GDP and employment both fell sharply. RealGDP declined by almost 4 percent between the fourth quarter of 2007 and the second quarter of 2009. The rate of unemployment rose from 4.4 percent in May 2007 to 10.1 percent in October 2009.As the crisis unfolded, the U.S government responded in a variety of ways.Three policy actions—all aimed in part at returning aggregate demand to its previous level—are most noteworthy. First, the Fed cut its target for the federal funds rate from 5.25 percent in September 2007 to about zero in December 2008. The Federal Reserve also started buying mortgage-backed securities and other private loans in open-market operations. By purchasing these instruments fromthe banking system, the Fed provided banks with additional funds in the hopethat the banks would makes loans more readily available.Second, in an even more unusual move in October 2008, Congress appropriated $700 billion for the Treasury to use to rescue the financial system. The goalwas to stem the financial crisis on Wall Street and make loans easier to obtain. Much of these funds were used for equity injections into banks. That is, the Treasury put funds into the banking system, which the banks could use to make loans; in exchange for these funds, the U.S. government became a part owner of these banks, at least temporarily.Finally, when Barack Obama became president in January 2009, his first major initiative was a large increase in government spending. After a relatively brief congressional debate over the form of the legislation, the new president signed a $787 billion stimulus bill on February 17, 2009. This policy move is discussed more fully in the next chapter when we consider the impact of fiscal policy on aggregate demand.As this book was going to press, the economy was starting to recover fromthe economic downturn. Real GDP was growing again, and unemployment had fallen to 9.5 percent in June 2010. Which, if any, of these many policy moves were most important for promoting this economic recovery? That is surely a questionthat macroeconomic historians will debate in the years to come. ■。
2008 Annual Report McDonald’sCorporation6.9%$23.5Billion$5.8BillionJim Skinner,Chief Executive Officer (left)Ralph Alvarez,President and Chief Operating Officer (right)To Our Valued Shareholders:I’ve been thinking a lot lately about a quote from Thomas Alva Edison, one of America’s greatest inventors. “Opportunity is missed by most people,” he observed, “because it is dressed in overalls and looks like work.”I believe Mr. Edison was reminding us that lightning really doesn’t come in a bottle — and that overnight successes are very much the exception to the rule, not the norm.At McDonald’s, success has always involved anot-so-profound formula involving one-part inspiration and four-parts perspiration.Our founder, Ray Kroc, coined the phrase “grinding it out” to characterize the determination and attention to detail that is required to be successful in our industry. “Grinding it out” was his way of saying the restaurant business is, and always will be,a labor-intensive operation. It was hard work and determination that built McDonald’s — and today, those same qualities drive our success.As this Annual Report indicates, 2008 was a banner year for McDonald’s. Revenues increased to a record $23.5 billion … global comparable sales increased 6.9 percent and we marked our 68th consecutive monthly increase … operating income and earnings per share rose 17 and 15 percent, respectively (excluding the 2007 Latin America transaction) … and we returned $5.8 billion to shareholders through share repurchases and dividends paid.REVENUES060708$23.5$22.8$20.9In billions.68Consecutive months of positive global comparablesales through December 2008Customers served on average each day 58MillionThese financial results are among the best in our Company’s history. Significantly, in a year when nearly every investment suffered, when the Dow fell 34 percent and the S&P lost nearly 39 percentof its total shareholder value, your investment in McDonald’s increased by nearly 6 percent. In fact, McDonald’s was one of only two companies in the Dow Jones Industrial Average to post a gain.OUR HARD WORK PAID OFF IN 2008.We are confident we can sustain this success going forward because our entire McDonald’s System — comprised of the industry’s best franchisees, suppliers and employees — continues to focus on delivering long-term profitable growth.This process began nearly six years ago, when McDonald’s embraced a strategy focusedon restaurant operations and our cornerstonesof quality, service, cleanliness and value.“Better, not just bigger” became our mantra, and the customer-centric Plan to Win became our playbook. This same strategy continues today … in 32,000 McDonald’s restaurants around the world. Every decision we make, whether it affects thousandsof restaurants or just one, has customer relevance as its primary driver.Whether it involves adding more choices and variety … improving our operational excellence … making our restaurants more convenient and more inviting … or enhancing our value proposition across the menu, we take our cue from customers.THEY SPEAK. WE LISTEN.In 2003, McDonald’s served an average of 47 million customers a day. In 2008, our average increasedto 58 million customers a day — an increase of about 25 percent in just five years.Our 5,000 franchisees worldwide, who own and operate 80 percent of our restaurants, display outstanding leadership in their restaurants and2McDonald’s Corporation Annual Report 2008communities. Our managers and crew are serving customers better than ever, as measured through our Customer Satisfaction Opportunity scores.Our unparalleled global supply chain enables us to obtain the quality and quantity of ingredients we need at competitive and predictable prices. The collaborative relationship we have with our suppliers is a true competitive advantage, especially in today’s environment, and a key reason why we continue to achieve industry-leading restaurant-level profitability.CASH GENERATED BY OPERATIONS060708$5.9$4.9$4.3In billions.And our talented, experienced employees, led by President and Chief Operating Officer Ralph Alvarez and his global management team, have keptMcDonald’s strategically focused on the Plan to Win.In addition, strong financial management contributes to our profitability and returns. Whether it involves controlling our costs or investing to grow ourbusiness, McDonald’s disciplined approach provides flexibility and strength in these unprecedented financial markets. This is reflected in our healthy balance sheet and the highest credit rating in the restaurant industry, which allows us to have ready access to capital when we need it. Our financial strength is also a positive for our owner/operators and suppliers, who continue to have access to the credit needed to reinvest in their businesses.CASH RETURNED TO SHAREHOLDERS060708$5.8$5.7$4.9Through dividends and share repurchases. In billions.We believe the strategies we have in place continue to be exactly right for our business … and, in the future, will enable us to seize opportunities when others can’t.I am immensely proud to be a part of this McDonald’s team. Six years ago, to recall Mr. Edison, we did not let opportunity pass us by. We rolled up our sleeves and worked together to restore pride and prosperity to the McDonald’s brand. Looking ahead to 2009 and beyond, I am confident we will maintain our momentum by continuing to focus on our customers, our restaurants and our strategy of being “better, not just bigger.”As always, thank you for your investment in McDonald’s. We appreciate the trust you have in our Company, and we are working hard to keep it.Sincerely,Jim SkinnerVice Chairman and CEOMcDonald’s Corporation Annual Report 20083SENIOR CORPORATE & BUSINESS UNIT OFFICERSRalph Alvarez* President, Chief Operating Officer Jose Armario* Group President — Canada & Latin America Peter Bensen* Chief Financial OfficerPeter Bush President — APMEA Pacific & South Africa Division Mary Dillon* Global Chief Marketing OfficerSteven Easterbrook President — Europe Northern Division Timothy Fenton* President — Asia/Pacific, Middle East & Africa Janice Fields U.S. Chief Operations Officer Richard Floersch* Chief Human Resources Officer Denis Hennequin* President — EuropeJames Johannesen President — U.S. Central Division Khamzat Khasbulatov President — Europe Eastern Division Karen King President — U.S. East DivisionBane Knezevic President — Europe Western Division Kevin Ozan* Corporate ControllerJean-Pierre Petit President — Europe Southern Division Steven Plotkin President — U.S. West DivisionPeter Rodwell President — APMEA Greater Asia & Middle East Division Gloria Santona* General Counsel, Corporate Secretary James Skinner* Vice Chairman, Chief Executive Officer Jeffrey Stratton* Chief Restaurant Officer Donald Thompson* President — U.S .A.*Executive OfficerOur people are the spirit of McDonald’s; theytransform our Plan to Win into reality with their commitment, dedication and vision.MANAGEMENT TEAM(From left to right)Jose Armario Janice Fields James Skinner Ralph AlvarezDonald Thompson Jeffrey Stratton Richard Floersch Mary Dillon Timothy Fenton Peter Bensen Gloria Santona Denis Hennequin4McDonald’s Corporation Annual Report 2008From young adults to moms, from breakfast to late night, from Beijing to Brussels to Boston, McDonald’s is firing on all cylinders.On the MenuOn the MoveOn the MarkOn the MapOn the MoneyY our Board of Directors believes that the Company’s winning performance is a direct reflection of the strength of McDonald’s global management team, led by Jim Skinner, Vice Chairman and CEO. Under Jim’s leadership, the Company continues to focus on decisions that enhance long-term profitable growth, talent management and leadership development, and ongoing commitment to supporting balanced, active lifestyles. These are among the factors that contribute to McDonald’s reputation as an admired and respected global company. And again this year, a variety of financial media recognized Jim’s leadership, a tribute not only to Jim, but acknowledgment of the good work of the entire organization.Looking forward, we believe that the Company has a clear strategic vision for our business. While economic conditions throughout the world remain uncertain, the true test of any company is how it performs in tough times. At McDonald’s, this is demonstrated by the Company’s ongoing levels of excellence in operations and leadership marketing, essential qualities regard-less of the economic climate.In addition to overseeing McDonald’s plans and performance, your Board of Directors is dedicated to maintaining strong corporate governance principles and management oversight. Our diverse team ofdirectors brings independent and experienced voices to our deliberations. Together, we are committed to ensuring that McDonald’s Corporation continues to deliver shareholder value.We are proud to serve you and are confident that McDonald’s management has the dedication and enthusiasm to continue the Company’s profitable growth in the future.Very truly yours,Andy McKenna ChairmanDear Fellow Shareholders:2008 was another strong year for McDonald’s Corporation. We continue to maintain a single-minded focus on satisfying customers within the context of our proven Plan to Win.1. Audit Committee2. Compensation Committee3. C orporate Responsibility Committee4. Executive Committee5. Finance Committee6. Governance CommitteeBOARD OF DIRECTORSRalph Alvarez Susan Arnold 2, 3Robert Eckert 2, 4, 6Enrique Hernandez, Jr.1, 4, 6Jeanne Jackson 5, 6Richard Lenny 2, 5Walter Massey 1, 3Andrew McKenna, Chairman 4, 5, 6Cary McMillan 1, 5Sheila Penrose 1, 3John Rogers, Jr. 2, 3James Skinner 4Roger Stone 1, 5, 6Andy McKenna, Chairman16McDonald’s Corporation Annual Report 20082008 Financial Report2008Financial Report196-year Summary20Stock Performance Graph21Management’s Discussion and Analysis of FinancialCondition and Results of Operations40Consolidated Statement of Income41Consolidated Balance Sheet42Consolidated Statement of Cash Flows43Consolidated Statement of Shareholders’Equity44Notes to Consolidated Financial Statements55Quarterly Results(Unaudited)56Management’s Assessment of Internal Control overFinancial Reporting57Report of Independent Registered Public Accounting Firm58Report of Independent Registered Public Accounting Firmon Internal Control over Financial Reporting18McDonald’s Corporation Annual Report20086-YEAR SUMMARYDollars in millions,except per share data200820072006200520042003 Company-operated sales$16,56116,61115,40214,01813,05511,810 Franchised revenues$6,9616,1765,4935,0994,8344,344 Total revenues$23,52222,78720,89519,11717,88916,154 Operating income$6,4433,879(2)4,433(5)3,9843,554(8)2,835(9) Income from continuing operations$4,313(1)2,335(2,3)2,866(5)2,578(7)2,287(8)1,510(9) Net income$4,313(1)2,395(2,3,4)3,544(5,6)2,602(7)2,279(8)1,471(9,10) Cash provided by operations$5,9174,8764,3414,3373,9043,269 Cash used for investing activities$1,6251,1501,2741,8181,3831,370 Capital expenditures$2,1361,9471,7421,6071,4191,307 Cash used for(provided by)financing activities$4,1153,9965,460(442)1,6341,737 Treasury stock repurchased$3,9813,9493,7191,228605439 Common stock cash dividends$1,8231,7661,217842695504 Financial position at year end:Total assets$28,46229,39228,97429,98927,83825,838 Total debt$10,2189,3018,40810,1379,2209,731 Total shareholders’equity$13,38315,28015,45815,14614,20111,982 Shares outstanding in millions1,1151,1651,2041,2631,2701,262 Per common share:Income from continuing operations–diluted$ 3.76(1) 1.93(2,3) 2.29(5) 2.02(7) 1.80(8) 1.18(9) Net income–diluted$ 3.76(1) 1.98(2,3,4) 2.83(5,6) 2.04(7) 1.79(8) 1.15(9,10) Dividends declared$ 1.63 1.50 1.00.67.55.40 Market price at year end$62.1958.9144.3333.7232.0624.83 Company-operated restaurants6,5026,9068,1668,1738,1798,030 Franchised restaurants25,46524,47122,88022,59322,31722,157 Total Systemwide restaurants31,96731,37731,04630,76630,49630,187 Franchised sales(11)$54,13246,94341,38038,91337,05233,129(1)Includes income of$109.0million($0.09per share)from the sale of the Company’s minority ownership interest in U.K.-based Pret A Manger.(2)Includes pretax operating charges of$1.7billion($1.32per share)related to impairment and other charges primarily as a result of the Company’s sale of its businesses in18LatinAmerican and Caribbean markets to a developmental licensee(see Latam transaction note to the consolidated financial statements for further details).(3)Includes a tax benefit of$316.4million($0.26per share)resulting from the completion of an Internal Revenue Service(IRS)examination of the Company’s2003-2004U.S.federal taxreturns.(4)Includes income of$60.1million($0.05per share)related to discontinued operations primarily from the sale of our investment in Boston Market.(5)Includes pretax operating charges of$134million($98million after tax or$0.08per share)related to impairment and other charges(see Impairment and other charges,net note to theconsolidated financial statements for further details).(6)Includes income of$678million($0.54per share)related to discontinued operations primarily resulting from the disposal of our investment in Chipotle.(7)Includes a net tax benefit of$73million($0.05per share)comprised of$179million($0.14per share)of income tax benefit resulting from the completion of an IRS examination of theCompany’s2000-2002U.S.tax returns,partly offset by$106million($0.09per share)of incremental tax expense resulting from the decision to repatriate certain foreign earnings under the Homeland Investment Act(HIA).(8)Includes pretax operating charges of$130million related to impairment and$121million($12million related to2004and$109million related to prior years)for a correction in theCompany’s lease accounting practices and policies,as well as a nonoperating gain of$49million related to the sale of the Company’s interest in a U.S.real estate partnership,for a total pretax expense of$202million($148million after tax or$0.12per share).(9)Includes pretax operating charges of$408million($323million after tax or$0.26per share)primarily related to the disposition of certain non-McDonald’s brands and impairment.(10)Includes a$37million after tax charge($0.03per share)to reflect the cumulative effect of the adoption of Statement of Financial Accounting Standards(SFAS)No.143,“Accountingfor Asset Retirement Obligations,”which requires legal obligations associated with the retirement of long-lived assets to be recognized at their fair value at the time the obligations are incurred.(11)While franchised sales are not recorded as revenues by the Company,management believes they are important in understanding the Company’s financial performance because thesesales are the basis on which the Company calculates and records franchised revenues and are indicative of the financial health of the franchisee base.McDonald’s Corporation Annual Report200819Stock performance graphAt least annually,we consider which companies comprise a readily identifiable investment peer group.McDonald’s is included in pub-lished restaurant indices;however,unlike most other companies included in these indices,which have no or limited internationaloperations,McDonald’s does business in more than 100countries and a substantial portion of our revenues and income is generated outside the U.S.In addition,because of our size,McDonald’s inclusion in those indices tends to skew the results.Therefore,we believe that such a comparison is not meaningful.Our market capitalization,trading volume and importance in an industry that is vital to the U.S.economy have resulted in McDonald’s inclusion in the Dow Jones Industrial Average (DJIA)since 1985.Like McDonald’s,many DJIA companies generate meaningful rev-enues and income outside the U.S.and some manage global brands.Thus,we believe that the use of the DJIA companies as the group for comparison purposes is appropriate.The following performance graph shows McDonald’s cumulative total shareholder returns (i.e.,price appreciation and reinvestment of dividends)relative to the Standard &Poor’s 500Stock Index (S&P 500Index)and to the DJIA companies for the five-year period ended December 31,2008.The graph assumes that the value of an investment in McDonald’s common stock,the S&P 500Index and the DJIA companies (including McDonald’s)was $100at December 31,2003.For the DJIA companies,returns are weighted for market capital-ization as of the beginning of each period indicated.These returns may vary from those of the Dow Jones Industrial Average Index,which is not weighted by market capitalization,and may be composed of different companies during the period under consideration.50100150200250$300‘07‘08‘06‘05‘04Dec ‘03DJIA companiesS&P 500 Index McDonald’s Source: Standard & Poor’s CompustatComparison of cumulative five-year total return281259190141131100901421351161111009513912810710610020McDonald’s Corporation Annual Report 2008MANAGEMENT’S DISCUSSION AND ANALYSIS OF FINANCIAL CONDITION AND RESULTS OF OPERATIONSOVERVIEWDescription of the businessThe Company franchises and operates McDonald’s restaurants.Of the31,967restaurants in118countries at year-end2008,25,465 were operated by franchisees(including18,402operated by conventional franchisees,2,926operated by developmental licensees and4,137operated by foreign affiliated markets (affiliates)—primarily in Japan)and6,502were operated by the Company.Under our conventional franchise arrangement,franchi-sees provide a portion of the capital required by initially investing in the equipment,signs,seating and décor of their restaurant busi-nesses,and by reinvesting in the business over time.The Company owns the land and building or secures long-term leases for both Company-operated and conventional franchised restaurant sites. This maintains long-term occupancy rights,helps control related costs and assists in alignment with franchisees.Under our devel-opmental license arrangement,licensees provide capital for the entire business,including the real estate interest,while the Com-pany has no capital invested.In addition,the Company has an equity investment in a limited number of affiliates that invest in real estate and operate or franchise restaurants within a market.We view ourselves primarily as a franchisor and continually review our mix of Company-operated and franchised(conventional franchised,developmental licensed and affiliated)restaurants to deliver a great customer experience and drive profitability.In most cases,franchising is the best way to achieve both goals.Although direct restaurant operation is more capital-intensive relative to franchising and results in lower restaurant margins as a percent of revenues,Company-operated restaurants are important to our success in both mature and developing markets.In our Company-operated restaurants,and in collaboration with our franchisees,we further develop and refine operating standards,marketing con-cepts and product and pricing strategies,so that only those that we believe are most beneficial are introduced Systemwide.In addi-tion,we firmly believe that owning restaurants is paramount to being a credible franchisor and essential to providing Company personnel with restaurant operations experience.Our Company-operated business also helps to facilitate strategic changes in restaurant ownership.The Company’s revenues consist of sales by Company-operated restaurants and fees from restaurants operated by franchisees.Revenues from conventional franchised restaurants include rent and royalties based on a percent of sales along with minimum rent payments,and initial fees.Revenues from restau-rants licensed to affiliates and developmental licensees include a royalty based on a percent of sales,and may include initial fees. Fees vary by type of site,amount of Company investment,if any, and local business conditions.These fees,along with occupancy and operating rights,are stipulated in franchise/license agree-ments that generally have20-year terms.The business is managed as distinct geographic segments. Significant reportable segments include the United States(U.S.), Europe,and Asia/Pacific,Middle East and Africa(APMEA).In addition,throughout this report we present“Other Countries& Corporate”that includes operations in Canada and Latin America, as well as Corporate activities.The U.S.,Europe and APMEA segments account for34%,42%and18%of total revenues,respectively.France,Germany and the United Kingdom(U.K.),col-lectively,account for approximately55%of Europe’s revenues;and Australia,China and Japan(a50%-owned affiliate accounted for under the equity method),collectively,account for over50%of APMEA’s revenues.These six markets along with the U.S.and Canada are referred to as“major markets”throughout this report and comprise over70%of total revenues.The Company continues to focus its management and financial resources on the McDonald’s restaurant business as we believe the opportunities for long-term growth remain significant.Accord-ingly,in second quarter2008,the Company sold its minority ownership interest in U.K.-based Pret A Manger for$229million.In connection with the sale,the Company recognized a non-operating gain.During the third quarter2007,the Company soldits investment in Boston Market.In2006,the Company disposedof its investment in Chipotle Mexican Grill(Chipotle)via public stock offerings and a tax-free exchange for McDonald’s common stock.As a result of the disposals during2007and2006,both Boston Market’s and Chipotle’s results of operations and trans-action gains have been reflected as discontinued operations for all periods presented.In analyzing business trends,management considers a variety of performance and financial measures,including comparable sales and comparable guest count growth,Systemwide sales growth,restaurant margins and returns.•Constant currency results exclude the effects of foreign cur-rency translation and are calculated by translating current year results at prior year average exchange rates.Management reviews and analyzes business results in constant currencies and bases certain incentive compensation plans on these results because they believe this better represents the Company’s underlying business trends.•Comparable sales and comparable guest counts are key perform-ance indicators used within the retail industry and are indicative of acceptance of the Company’s initiatives as well as local eco-nomic and consumer trends.Increases or decreases in comparable sales and comparable guest counts represent the percent change in sales and transactions,respectively,from the same period in the prior year for all restaurants in operation at least thirteen months,including those temporarily -parable sales exclude the impact of currency translation.Someof the reasons restaurants may be temporarily closed include reimaging or remodeling,rebuilding,road construction and natu-ral disasters.McDonald’s reports on a calendar basis and therefore the comparability of the same month,quarter and year with the corresponding period of the prior year will be impacted by the mix of days.The number of weekdays,weekend days and timing of holidays in a given timeframe can have a positive or negative impact on comparable sales and guest counts.The Company refers to these impacts as calendar shift/trading day adjustments.These impacts vary geographically due to consumer spending patterns and have the greatest effect on monthly comparable sales and guest counts while the annual impacts are typically minimal.In2008,there was an incremental full day of sales and guest counts due to the leap year.•Systemwide sales include sales at all restaurants,whether oper-ated by the Company or by franchisees.While sales by franchisees are not recorded as revenues by the Company, management believes the information is important in under-standing the Company’s financial performance because these sales are the basis on which the Company calculates andMcDonald’s Corporation Annual Report200821records franchised revenues and are indicative of the financial health of our franchisee base.•Return on incremental invested capital(ROIIC)is a measure reviewed by management over one-year and three-year time periods to evaluate the overall profitability of the business units, the effectiveness of capital deployed and the future allocation of capital.The return is calculated by dividing the change in operat-ing income plus depreciation and amortization(numerator)by the adjusted cash used for investing activities(denominator), primarily capital expenditures.The calculation assumes a con-stant average foreign exchange rate over the periods included in the calculation.Strategic direction and financial performanceThe strength of the alignment between the Company,its franchi-sees and suppliers(collectively referred to as the System)has been key to McDonald’s success over the years.This business model enables McDonald’s to consistently deliver locally-relevant restaurant experiences to customers and be an integral part of the communities we serve.In addition,it facilitates our ability to identi-fy,implement and scale innovative ideas that meet our customers’changing needs and preferences.McDonald’s customer-centered Plan to Win—which is focused on being better,not just bigger—provides a common framework for our restaurants yet allows for local adaptation.The Plan facilitates the execution of multiple initiatives surrounding the five factors of exceptional customer experiences—people,prod-ucts,place,price and promotion.Through the execution of these initiatives,we have enhanced the McDonald’s experience for cus-tomers worldwide,growing sales and guest counts in each of the last five years.This Plan,coupled with financial discipline,has delivered strong results for shareholders.We have exceeded our long-term,constant currency financial targets of average annual Systemwide sales and revenue growth of3%to5%;average annual operating income growth of6%to 7%;and annual returns on incremental invested capital in the high teens every year since the Plan’s implementation in2003,after adjusting2007for the Latin America developmental license transaction.Given the size and scope of our global business,we believe these financial targets are realistic and sustainable, enabling us to focus on those opportunities that best optimize long-term shareholder value.In2008,we continued to focus on our key global success factors of branded affordability,menu variety and beverage choice, convenience and daypart expansion,ongoing restaurant reinvest-ment and operations excellence.Locally-relevant initiatives around each of these success factors resonated with consumers’increas-ingly busy lifestyles and their growing demand for menu variety, value and simple,enjoyable eating-out experiences.As a result, every area of the world contributed to2008global comparable sales and guest counts increasing6.9%and3.1%,respectively, despite a challenging economic environment in many countries.In the U.S.,we continued to drive sales higher and increase our share of the informal eating-out market in2008due to our ongoing focus on breakfast,chicken,beverages,convenience and branded affordability.We extended our leadership in the breakfast and chicken categories with the launch of the Southern Style Chicken Biscuit for breakfast and Southern Style Chicken Sand-wich for the remainder of the day.We profitably built greater visit frequency by leveraging our convenient locations,extended hours, drive-thru service and value-oriented local beverage promotions that often featured our popular Iced Coffee and Sweet Tea.As part of our multi-year strategy to take advantage of the significant and growing beverage category,we began rolling-out espresso-based hot and cold specialty coffees.At year-end2008,over7,000res-taurants were offering the new specialty coffees,and we expect to complete the roll-out in mid-2009.To accommodate the related new equipment as well as enable potential future offerings such as smoothies,frappes and bottled beverages,construction is required in many restaurants.In most cases this construction also involves expanding and optimizing the efficiency of our drive-thru booth, which enables us to better serve even more customers,faster.The Company is investing capital to fund a portion of this construction-related reinvestment for franchised restaurants.In Europe,we posted record-high comparable sales growth in 2008.Every country contributed to this performance,which was led by France,the U.K.,Russia and Germany.This success was driven in part by greater local customer relevance created by our tiered menu approach,featuring an effective combination of pre-mium selections,classic menu favorites,everyday value and popular limited-time food promotions.We also connected with customers throughout the day with new sandwiches such as the Bacon Roll for breakfast in the U.K.and premium M burger in France,Germany and the U.K.We continued upgrading the McDonald’s experience by reimaging more than650locations, primarily in the U.K.and Germany.In addition,we continued the roll-out of a new kitchen operating system—currently in about 5,000of our European restaurants—to enhance operational effi-ciency and support greater menu variety.Open communication and transparency is especially important to European consumers.To build brand trust,we actively communicated the facts about McDonald’s as an employer and highlighted the quality and nutrition of our food with the early launch of the Company’s new global packaging design.In APMEA,our momentum continued with nearly every country delivering positive comparable sales,driven by Australia,Japan and China.In addition,aggressive restaurant development in China—where we opened our1,000th restaurant—contributed to rev-enue growth.Our performance was driven by strategic initiatives surrounding convenience,breakfast,core menu extensions and value.We further enhanced McDonald’s convenience with drive-thru and delivery service,as well as expansion of extended hours to60%(or about5,000)of our restaurants in APMEA.We built on the momentum of our breakfast business,currently in70%of our restaurants in APMEA,by raising customer awareness,trial and visit frequency with relevant marketing and new menu offerings like the egg,tomato and pepper McPuff in China.We also con-tinued to appeal to customers with branded affordability platforms and locally-relevant new product launches such as the premium chicken line in Australia and New Zealand.Our customer-centered strategies to drive global momentum also consider price and product mix as a means to enhance restaurant profitability.This approach is complemented by a focus on optimizing restaurant operations and effectively managing food and paper costs by leveraging our scale,supply chain infra-structure and risk management strategies.As a result,amid a volatile commodity environment,McDonald’s delivered con-solidated Company-operated restaurant margins of17.6%–its highest in nine years.Strong sales and margin performance positively impacted growth in cash from operations,which rose$1billion to$5.9billion in2008.Our substantial cash flow,strong credit rating and continued access to credit provides us significant flexibility to22McDonald’s Corporation Annual Report2008。
澳 門 保 險 業 務 活 動二零零八年(臨時數字)ACTIVIDADE SEGURADORA DE MACAU2008(Valores provisórios)(澳門幣千元) (MOP'000)人 壽Vida 2,547,738非人壽Não-vida 898,890總 額Total3,446,628* 臨時數字./- Valores provisórios.保 費總體業務2008*PRÉMIOS BRUTOSCONJUNTO DA ACTIVIDADE人 壽 Vida非人壽 Não-vida(澳門幣千元) (MOP'000)20072008*人 壽Vida 2,253,9752,547,738非人壽Não-vida 971,653898,890總 額Total3,225,6283,446,628Valores provisórios.2007 / 2008** 臨時數字./-保 費總體業務CONJUNTO DA ACTIVIDADEPRÉMIOS BRUTOS500,0001,000,0001,500,0002,000,0002,500,0003,000,0003,500,0004,000,00020072008*(MOP'000)人 壽Vida 非人壽Não-vida 總 額Total(澳門幣千元) (MOP'000)本地保險公司Seguradoras locais1,355,125外地保險公司Seguradoras do exterior 2,091,503總 額Total3,446,628Valores provisórios.* 臨時數字./-2008*保 費總體業務PRÉMIOS BRUTOSCONJUNTO DA ACTIVIDADE39.3%本地保險公司 Seguradoras locais外地保險公司 Seguradoras do exterior(澳門幣千元) (MOP'000)人壽保險Vida2,547,738勞工保險Acidentes de trabalho 188,203火 險Incêndio 235,502汽車保險Automóvel126,197海運保險Marítimo carga 13,901雜項保險Diversos 335,087總 額Total3,446,628* 臨時數字./- Valores provisórios.2008*保 費PRÉMIOS BRUTOS總體業務CONJUNTO DA ACTIVIDADE5.5%9.7%人壽保險 Vida勞工保險 Acidentes de trabalho火 險 Incêndio汽車保險 Automóvel海運保險 Marítimo carga雜項保險 Diversos- 5 -整體業務CONJUNTO DA ACTIVIDADE保費收入結構ESTRUTURA DA CARTEIRA澳門幣千元(MOP'000)2007%2008*%2007/06 (%)2008*/07 (%)人 壽 Vida2,253,97569.9%2,547,73873.9%28.6%13.0% 非人壽 Não-vida971,65330.1%898,89026.1%34.0%(7.5%)勞工保險 Acidentes de trabalho 193,393 6.0%188,203 5.5%46.9%(2.7%) 火 險 Incêndio 201,033 6.2%235,502 6.8%40.5%17.1% 汽車保險 Automóvel 117,136 3.6%126,197 3.7%28.5%7.7% 海運保險 Marítimo carga 12,5850.4%13,9010.4%10.2%10.5% 雜項保險 Diversos 447,50613.9%335,0879.7%28.6%(25.1%) 總額 Total geral 3,225,628100.0%3,446,628100.0%30.2%6.9%Valores provisórios.保 費 Prémios brutos * 臨時數字./-變化率 Variação entre整體業務CONJUNTO DA ACTIVIDADE市場比率QUOTA DE MERCADO2008*(澳門幣千元)(%)(MOP'000)1 - 美國友邦保險 AIA (B)918,22426.6%2 - 澳門人壽 CSM (Vida)474,19613.8%3 - 國衞保險 AXA359,18910.4%4 - 美國萬通保險 MassMutual255,5107.4%5 - 中國保險 China Insurance255,0087.4%6 - 聯豐亨保險 Luen Fung Hang188,093 5.5%7 - 澳門保險 CSM186,660 5.4%8 - 安泰保險 ING167,038 4.8%9 - 中國人壽保險 China Life148,580 4.3%10 - 亞洲保險 Asia111,079 3.2%11 - 匯豐人壽 HSBC (Vida)92,701 2.7%12 - 宏利保險 Manulife74,537 2.2%13 - 聯豐亨人壽 Luen Fung Hang (Vida)54,486 1.6%14 - 美安保險 American Home36,034 1.1%15 - 英傑華保險 MSIG32,2740.9%16 - 昆士蘭保險 QBE26,3560.8%17 - 匯業保險 Delta Asia15,3260.4%18 - 安達保險 ACE14,3180.4%19 - 忠誠保險 Fidelidade12,9020.4%20 - 閩信保險 Min Xin10,6850.3%21 - 匯豐保險 HSBC10,1550.3%22 - 皇冠保險 Crown Life2,5540.1%23 - 忠誠人壽 Fidelidade Vida7230.0%24 - 永安保險 Wing On00.0% * 臨時數字./-保 費 變 化 情 況澳門幣千元 (MOP'000)市場比率Quota de mercado 20072008*Δ %20072008*A. 人壽保險RAMO VIDA- 澳門人壽 CSM (Vida)500,452474,196(5.2%)15.5%13.8% - 安泰保險 ING127,073167,03831.5% 3.9% 4.8% - 聯豐亨人壽 Luen Fung Hang (Vida)40,95154,48633.1% 1.3% 1.6% - 美國友邦保險 AIA (B)788,874918,22416.4%24.5%26.6% - 皇冠保險 Crown Life 2,5172,554 1.5%0.1%0.1% - 中國人壽保險 China Life 93,690148,58058.6% 2.9% 4.3% - 國衞保險 AXA 320,742359,18912.0%9.9%10.4% - 宏利保險 Manulife63,35574,53717.6% 2.0% 2.2% - 忠誠人壽 Fidelidade Vida 1,536723(52.9%)0.0%0.0% - 美國萬通保險 MassMutual 244,688255,510 4.4%7.6%7.4% - 匯豐人壽 HSBC (Vida)70,09792,70132.2% 2.2% 2.7%(1)2,253,9752,547,73813.0%69.9%73.9%B. 非人壽保險RAMOS GERAIS- 聯豐亨保險 Luen Fung Hang 149,127188,09326.1% 4.6% 5.5% - 澳門保險 CSM347,464186,660(46.3%)10.8% 5.4% - 匯業保險 Delta Asia 16,83815,326(9.0%)0.5%0.4% - 安達保險 ACE8,64314,31865.7%0.3%0.4% - 中國保險 China Insurance 238,450255,008 6.9%7.4%7.4% - 美安保險 American Home 35,87936,0340.4% 1.1% 1.1% - 亞洲保險 Asia 96,279111,07915.4% 3.0% 3.2% - 英傑華保險 MSIG 26,87032,27420.1%0.8%0.9% - 永安保險 Wing On 00---0.0%0.0% - 閩信保險 Min Xin 7,81910,68536.7%0.2%0.3% - 匯豐保險 HSBC 8,74910,15516.1%0.3%0.3% - 昆士蘭保險 QBE 24,99926,356 5.4%0.8%0.8% - 忠誠保險 Fidelidade10,53612,90222.5%0.3%0.4% (2)971,653898,890(7.5%)30.1%26.1%(1)+(2)=(3)3,225,6283,446,628 6.9%100.0%100.0%保 費EVOLUÇÃO E QUOTA DE MERCADO DAS SEGURADORASEM RELAÇÃO AO CONJUNTO DA ACTIVIDADEPrémios brutos保 費 成 份COMPOSIÇÃO DOS PRÉMIOS BRUTOS人 壽VIDA澳門幣千元(MOP'000)市場比率Quota de mercado20072008*Δ %20072008*1 - 美國友邦保險 AIA (B)788,874918,22416.4%35.0%36.1%2 - 澳門人壽 CSM (Vida)500,452474,196(5.2%)22.2%18.6%3 - 國衞保險 AXA320,742359,18912.0%14.2%14.1%4 - 美國萬通保險 MassMutual 244,688255,510 4.4%10.9%10.0%5 - 安泰保險 ING127,073167,03831.5% 5.6% 6.6%6 - 中國人壽保險 China Life 93,690148,58058.6% 4.2% 5.8%7 - 匯豐人壽 HSBC (Vida)70,09792,70132.2% 3.1% 3.6%8 - 宏利保險 Manulife63,35574,53717.6% 2.8% 2.9%9 - 聯豐亨人壽 Luen Fung Hang (Vida)40,95154,48633.1% 1.8% 2.2%10 - 皇冠保險 Crown Life 2,5172,5541.5%0.1%0.1%11- 忠誠人壽 Fidelidade Vida1,536723(52.9%)0.1%0.0% - 合計2,253,9752,547,73813.0%100.0%100.0%Valores provisórios.保 費* 臨時數字./- Prémios brutos保 費 成 份COMPOSIÇÃO DOS PRÉMIOS BRUTOS非人壽澳門幣千元(MOP'000)市場比率Quota de mercado20072008*Δ %20072008*1- 中國保險 China Insurance 238,450255,008 6.9%24.5%28.4%2 - 聯豐亨保險 Luen Fung Hang 149,127188,09326.1%15.3%20.9%3 - 澳門保險 CSM 347,464186,660(46.3%)35.8%20.8%4 - 亞洲保險 Asia96,279111,07915.4%9.9%12.4%5 - 美安保險 American Home 35,87936,0340.4% 3.7% 4.0%6 - 英傑華保險 MSIG 26,87032,27420.1% 2.8% 3.6%7 - 昆士蘭保險 QBE 24,99926,356 5.4% 2.6% 2.9%8 - 匯業保險 Delta Asia 16,83815,326(9.0%) 1.7% 1.7%9 - 安達保險 ACE8,64314,31865.7%0.9% 1.6%10 - 忠誠保險 Fidelidade 10,53612,90222.5% 1.1% 1.4%11 - 閩信保險 Min Xin 7,81910,68536.7%0.8% 1.2%12 - 匯豐保險 HSBC 8,74910,15516.1%0.9% 1.1%13- 永安保險 Wing On00---0.0%0.0% - 合計971,653898,890(7.5%)100.0%100.0%Valores provisórios.* 臨時數字./-NÃO - VIDA保 費Prémios brutos保 費 成 份COMPOSIÇÃO DOS PRÉMIOS BRUTOS勞工保險澳門幣千元(MOP'000)市場比率Quota de mercado 20072008*Δ %20072008*1- 中國保險 China Insurance 69,33965,495(5.5%)35.9%34.8%2 - 亞洲保險 Asia 24,07636,73452.6%12.5%19.5%3 - 澳門保險 CSM58,62235,131(40.1%)30.3%18.6%4 - 聯豐亨保險 Luen Fung Hang 20,37024,72721.4%10.5%13.1%5 - 匯業保險 Delta Asia 5,9557,90632.8% 3.1% 4.2%6 - 英傑華保險 MSIG 6,3147,12212.8% 3.3% 3.8%7 - 昆士蘭保險 QBE5,4285,561 2.5% 2.8% 3.0%8 - 美安保險 American Home 1,5872,81977.6%0.8% 1.5%9 - 安達保險 ACE 127636,258.3%0.0%0.4%10 - 閩信保險 Min Xin 780704(9.7%)0.4%0.4%11 - 匯豐保險 HSBC 62775019.6%0.3%0.4%12 - 忠誠保險 Fidelidade 28349173.5%0.1%0.3%13- 永安保險 Wing On00---0.0%0.0% - 合計193,393188,203(2.7%)100.0%100.0%Valores provisórios.* 臨時數字./-ACIDENTES DE TRABALHO保 費Prémios brutos保 費 成 份COMPOSIÇÃO DOS PRÉMIOS BRUTOS火 險澳門幣千元(MOP'000)市場比率Quota de mercado20072008*Δ %20072008*1- 中國保險 China Insurance 41,21754,43032.1%20.5%23.1%2 - 聯豐亨保險 Luen Fung Hang 38,26447,14023.2%19.0%20.0%3 - 澳門保險 CSM 40,66846,24213.7%20.2%19.6%4 - 亞洲保險 Asia34,07133,797(0.8%)17.0%14.4%5 - 美安保險 American Home 13,56111,559(14.8%) 6.8% 4.9%6 - 安達保險 ACE 5,4299,04366.6% 2.7% 3.8%7 - 英傑華保險 MSIG 7,2348,47717.2% 3.6% 3.6%8 - 忠誠保險 Fidelidade 6,2758,15329.9% 3.1% 3.5%9 - 閩信保險 Min Xin 4,2975,99139.4% 2.1% 2.6%10 - 昆士蘭保險 QBE 4,7995,2299.0% 2.4% 2.2%11 - 匯豐保險 HSBC 2,5152,82912.5% 1.3% 1.2%12 - 匯業保險 Delta Asia 2,7032,612(3.4%)1.3% 1.1%13- 永安保險 Wing On00---0.0%0.0% - 合計201,033235,50217.1%100.0%100.0%Valores provisórios.* 臨時數字./-INCÊNDIO保 費Prémios brutos保 費 成 份COMPOSIÇÃO DOS PRÉMIOS BRUTOS汽車保險澳門幣千元(MOP'000)市場比率Quota de mercado20072008*Δ %20072008*1- 中國保險 China Insurance 39,68143,4849.6%33.9%34.5%2 - 聯豐亨保險 Luen Fung Hang 26,20030,93018.1%22.4%24.5%3 - 澳門保險 CSM 28,23827,941(1.1%)24.1%22.1%4 - 亞洲保險 Asia 13,56813,763 1.4%11.6%10.9%5 - 英傑華保險 MSIG 6,6117,1448.1% 5.6% 5.7%6 - 匯業保險 Delta Asia 1,0501,047(0.3%)0.9%0.8%7 - 昆士蘭保險 QBE746711(4.7%)0.6%0.6%8 - 美安保險 American Home 46162836.2%0.4%0.5%9 - 匯豐保險 HSBC 427379(11.2%)0.4%0.3%10 - 閩信保險 Min Xin 1481629.5%0.1%0.1%11 - 安達保險 ACE 6833.3%0.0%0.0%12 - 永安保險 Wing On 00---0.0%0.0%13- 忠誠保險 Fidelidade00---0.0%0.0% - 合計117,136126,1977.7%100.0%100.0%Valores provisórios.保 費* 臨時數字./-AUTOMÓVELPrémios brutos-- 13 -保 費 成 份COMPOSIÇÃO DOS PRÉMIOS BRUTOS海運保險澳門幣千元(MOP'000)市場比率Quota de mercado20072008*Δ %20072008*1- 中國保險 China Insurance 3,9644,36510.1%31.5%31.4%2 - 澳門保險 CSM2,8533,27614.8%22.7%23.6%3 - 聯豐亨保險 Luen Fung Hang 1,3681,53412.1%10.9%11.0%4 - 亞洲保險 Asia 1,2461,3447.9%9.9%9.7%5 - 匯豐保險 HSBC 5441,090100.4% 4.3%7.8%6 - 英傑華保險 MSIG 1,2271,004(18.2%)9.7%7.2%7 - 昆士蘭保險 QBE505492(2.6%) 4.0% 3.5%8 - 美安保險 American Home 464424(8.6%) 3.7% 3.1%9 - 閩信保險 Min Xin 23627315.7% 1.9% 2.0%10 - 匯業保險 Delta Asia 17899(44.4%) 1.4%0.7%11 - 安達保險 ACE 00---0.0%0.0%12 - 永安保險 Wing On 00---0.0%0.0%13- 忠誠保險 Fidelidade00---0.0%0.0% - 合計12,58513,90110.5%100.0%100.0%Valores provisórios.保 費* 臨時數字./-MARÍTIMO CARGAPrémios brutos- 14 -保 費 成 份COMPOSIÇÃO DOS PRÉMIOS BRUTOS雜項保險澳門幣千元 (MOP'000)市場比率Quota de mercado 20072008*Δ %20072008*1 - 中國保險 China Insurance 84,24987,234 3.5%18.8%26.0%2 - 聯豐亨保險 Luen Fung Hang 62,92583,76233.1%14.1%25.0%3 - 澳門保險 CSM 217,08374,070(65.9%)48.5%22.1%4 - 亞洲保險 Asia23,31825,4419.1% 5.2%7.6%5 - 美安保險 American Home 19,80620,604 4.0% 4.4% 6.2%6 - 昆士蘭保險 QBE 13,52114,363 6.2% 3.0% 4.3%7 - 英傑華保險 MSIG 5,4848,52755.5% 1.2% 2.5%8 - 匯豐保險 HSBC 4,6365,10710.2% 1.1% 1.5%9 - 安達保險 ACE 3,1964,50440.9%0.7% 1.3%10 - 忠誠保險 Fidelidade 3,9784,2587.0%0.9% 1.3%11 - 匯業保險 Delta Asia 6,9523,662(47.3%)1.6% 1.1%12 - 閩信保險 Min Xin 2,3583,55550.8%0.5%1.1%13- 永安保險 Wing On00---0.0%0.0%- 合計447,506335,087(25.1%)100.0%100.0%Valores provisórios.保 費DIVERSOS* 臨時數字./- Prémios brutos澳門幣千元 (MOP'000)非 人 壽 Ramos gerais保險公司Seguradoras人壽Vida勞工保險Acidentes de trabalho火險Incêndio 汽車保險Automóvel 海運保險Marítimo carga 雜項保險Diversos合計Total整體保費總金額Total dos prémios brutos dosector seguradorA. 人壽保險 RAMO VIDA . 本地保險公司 Seguradoras locais - 澳門人壽 CSM (Vida)474,196474,196 - 安泰保險 ING167,038167,038 - 聯豐亨人壽 Luen Fung Hang (Vida)54,48654,486(1)695,720695,720. 外地保險公司Seguradoras do exterior - 美國友邦保險 AIA (B)918,224918,224 - 皇冠保險 Crown Life 2,5542,554 - 中國人壽保險 China Life 148,580148,580 - 國衞保險 AXA 359,189359,189 - 宏利保險 Manulife74,53774,537 - 忠誠人壽 Fidelidade Vida 723723 - 美國萬通保險 MassMutual 255,510255,510 - 匯豐人壽 HSBC (Vida)92,70192,701(2)1,852,0181,852,018(1)+(2)=(3)2,547,7382,547,738B. 非人壽保險RAMOS GERAIS . 本地保險公司 Seguradoras locais- 聯豐亨保險 Luen Fung Hang 24,72747,14030,9301,53483,762188,093188,093 - 澳門保險 CSM35,13146,24227,9413,27674,070186,660186,660 - 匯業保險 Delta Asia 7,9062,6121,047993,66215,32615,326 - 安達保險 ACE7639,043804,50414,31814,318 - 中國保險 China Insurance65,49554,43043,4844,36587,234255,008255,008(4)134,022159,467103,4109,274253,232659,405659,405. 外地保險公司Seguradoras do exterior - 美安保險 American Home 2,81911,55962842420,60436,03436,034 - 亞洲保險 Asia 36,73433,79713,7631,34425,441111,079111,079 - 英傑華保險 MSIG 7,1228,4777,1441,0048,52732,27432,274- 永安保險 Wing On 0000000 - 閩信保險 Min Xin 7045,9911622733,55510,68510,685 - 匯豐保險 HSBC 7502,8293791,0905,10710,15510,155 - 昆士蘭保險 QBE 5,5615,22971149214,36326,35626,356 - 忠誠保險 Fidelidade4918,153004,25812,90212,902(5)54,18176,03522,7874,62781,855239,485239,485(4)+(5)=(6)188,203235,502126,19713,901335,087898,890898,890(3)+(6)=(7)2,547,738188,203235,502126,19713,901335,087898,8903,446,628* 臨時數字./- Valores provisórios.PRÉMIOS BRUTOS DO SECTOR SEGURADOR DO EXERCÍCIO2008*整體保費成份表市場比率QUOTA DE MERCADO DO EXERCÍCIO2008*非 人 壽 Ramos gerais保險公司Seguradoras 人壽Vida勞工保險Acidentesde trabalho火險Incêndio汽車保險Automóvel海運保險Marítimo carga雜項保險Diversos合計Total以總體業務作比較Em relação ao conjunto daactividadeA. 人壽保險RAMO VIDA. 本地保險公司Seguradoras locais- 澳門人壽 CSM (Vida)18.6%13.8% - 安泰保險 ING 6.6% 4.8% - 聯豐亨人壽 Luen Fung Hang (Vida) 2.2% 1.6%(1)27.4%20.2% . 外地保險公司Seguradoras do exterior- 美國友邦保險 AIA (B)36.1%26.6% - 皇冠保險 Crown Life0.1%0.1% - 中國人壽保險 China Life 5.8% 4.3% - 國衞保險 AXA14.1%10.4% - 宏利保險 Manulife 2.9% 2.2% - 忠誠人壽 Fidelidade Vida0.0%0.0% - 美國萬通保險 MassMutual10.0%7.4% - 匯豐人壽 HSBC (Vida) 3.6% 2.7%(2)72.6%53.7%(1)+(2)=(3)100.0%73.9%B. 非人壽保險RAMOS GERAIS. 本地保險公司Seguradoras locais- 聯豐亨保險 Luen Fung Hang13.1%20.0%24.5%11.0%25.0%20.9% 5.5% - 澳門保險 CSM18.6%19.6%22.1%23.6%22.1%20.8% 5.4% - 匯業保險 Delta Asia 4.2% 1.1%0.8%0.7% 1.1% 1.7%0.4% - 安達保險 ACE0.4% 3.8%0.0%0.0% 1.3% 1.6%0.4% - 中國保險 China Insurance34.8%23.1%34.5%31.4%26.0%28.4%7.4%(4)71.1%67.6%81.9%66.7%75.5%73.4%19.1% . 外地保險公司Seguradoras do exterior- 美安保險 American Home 1.5% 4.9%0.5% 3.1% 6.2% 4.0% 1.1% - 亞洲保險 Asia19.5%14.4%10.9%9.7%7.6%12.4% 3.2% - 英傑華保險 MSIG 3.8% 3.6% 5.7%7.2% 2.5% 3.6%0.9% - 永安保險 Wing On0.0%0.0%0.0%0.0%0.0%0.0%0.0% - 閩信保險 Min Xin0.4% 2.6%0.1% 2.0% 1.1% 1.2%0.3% - 匯豐保險 HSBC0.4% 1.2%0.3%7.8% 1.5% 1.1%0.3% - 昆士蘭保險 QBE 3.0% 2.2%0.6% 3.5% 4.3% 2.9%0.8% - 忠誠保險 Fidelidade0.3% 3.5%0.0%0.0% 1.3% 1.4%0.4%(5)28.9%32.4%18.1%33.3%24.5%26.6%7.0%(4)+(5)=(6)100.0%100.0%100.0%100.0%100.0%100.0%26.1%(3)+(6)=(7)100.0%100.0%100.0%100.0%100.0%100.0%100.0%100.0%* 臨時數字./-Valores provisórios.保費結構ESTRUTURA DA CARTEIRA DO EXERCÍCIO2008*非 人 壽 Ramos gerais保險公司Seguradoras 人壽Vida勞工保險Acidentesde trabalho火險Incêndio汽車保險Automóvel海運保險Marítimo carga雜項保險Diversos合計Total73.9% 5.5% 6.8% 3.7%0.4%9.7%100.0%A. 人壽保險RAMO VIDA. 本地保險公司Seguradoras locais- 澳門人壽 CSM (Vida)100.0%- 安泰保險 ING100.0%- 聯豐亨人壽 Luen Fung Hang (Vida)100.0%. 外地保險公司Seguradoras do exterior- 美國友邦保險 AIA (B)100.0%- 皇冠保險 Crown Life100.0%- 中國人壽保險 China Life100.0%- 國衞保險 AXA100.0%- 宏利保險 Manulife100.0%- 忠誠人壽 Fidelidade Vida100.0%- 美國萬通保險 MassMutual100.0%- 匯豐人壽 HSBC (Vida)100.0%B. 非人壽保險RAMOS GERAIS. 本地保險公司Seguradoras locais- 聯豐亨保險 Luen Fung Hang13.2%25.1%16.4%0.8%44.5%100.0% - 澳門保險 CSM18.8%24.8%15.0% 1.7%39.7%100.0% - 匯業保險 Delta Asia51.6%17.0% 6.8%0.7%23.9%100.0% - 安達保險 ACE 5.3%63.2%0.0%0.0%31.5%100.0% - 中國保險 China Insurance25.7%21.3%17.1% 1.7%34.2%100.0%. 外地保險公司Seguradoras do exterior- 美安保險 American Home7.8%32.1% 1.7% 1.2%57.2%100.0% - 亞洲保險 Asia33.1%30.4%12.4% 1.2%22.9%100.0% - 英傑華保險 MSIG22.1%26.3%22.1% 3.1%26.4%100.0% - 永安保險 Wing On------------------- 閩信保險 Min Xin 6.6%56.1% 1.5% 2.5%33.3%100.0% - 匯豐保險 HSBC7.4%27.9% 3.7%10.7%50.3%100.0% - 昆士蘭保險 QBE21.1%19.8% 2.7% 1.9%54.5%100.0% - 忠誠保險 Fidelidade 3.8%63.2%0.0%0.0%33.0%100.0%* 臨時數字./-Valores provisórios.(澳門幣千元) (MOP'000)人 壽Vida 1,158,067非人壽Não-vida 385,897總 額Total1,543,964* 臨時數字./- Valores provisórios.賠償支出總體業務2008*INDEMNIZAÇÕES BRUTASCONJUNTO DA ACTIVIDADE人 壽 Vida非人壽 Não-vida(澳門幣千元) (MOP'000)20072008*人 壽Vida 740,0311,158,067非人壽Não-vida 360,609385,897總 額Total1,100,6401,543,964* 臨時數字./- Valores provisórios.賠償支出總體業務CONJUNTO DA ACTIVIDADEINDEMNIZAÇÕES BRUTAS2007/ 2008*200,000400,000600,000800,0001,000,0001,200,0001,400,0001,600,0001,800,00020072008*(MOP'000)人 壽 Vida非人壽 Não-vida總 額 Total(澳門幣千元)(MOP'000)本地保險公司Seguradoras locais773,702外地保險公司Seguradoras do exterior 770,262總 額Total1,543,964* 臨時數字./- Valores provisórios.賠償支出總體業務2008*CONJUNTO DA ACTIVIDADEINDEMNIZAÇÕES BRUTAS本地保險公司 Seguradoras locais外地保險公司 Seguradoras do exterior(澳門幣千元)(MOP'000)人壽保險Vida1,158,067 勞工保險Acidentes de trabalho 127,456 火 險Incêndio 37,945 汽車保險Automóvel 95,031 海運保險Marítimo carga 1,174 雜項保險Diversos 124,291 總 額Total1,543,964* 臨時數字./- Valores provisórios.賠償支出總體業務2008*CONJUNTO DA ACTIVIDADEINDEMNIZAÇÕES BRUTAS75.0%人壽保險 Vida勞工保險 Acidentes de trabalho火 險 Incêndio 汽車保險 Automóvel海運保險 Marítimo carga雜項保險 Diversos賠償支出結構ESTRUTURA DAS INDEMNIZAÇÕES BRUTAS總體業務CONJUNTO DA ACTIVIDADE澳門幣千元 (MOP'000)賠 償 Indemnizações brutas變化率 Variação entre20062007%2008*%2007/06 (%)2008*/07 (%)人壽 Vida568,489740,03167.2%1,158,06775.0%30.2%56.5%非人壽 Não-vida207,009360,60932.8%385,89725.0%74.2%7.0%勞工保險 Acidentes de trabalho64,99696,2268.7%127,4568.3%48.0%32.5%火險 Incêndio10,83840,528 3.7%37,945 2.4%273.9%(6.4%)汽車保險 Automóvel68,69086,4857.9%95,031 6.2%25.9%9.9%海運保險 Marítimo carga1,7436500.1%1,1740.1%(62.7%)80.6%雜項保險 Diversos60,742136,72012.4%124,2918.0%125.1%(9.1%)總額 Total geral775,4981,100,640100.0%1,543,964100.0%41.9%40.3%* 臨時數字./-Valores provisórios.賠償支出INDEMNIZAÇÕES BRUTAS總體業務CONJUNTO DA ACTIVIDADE2008*(澳門幣千元)(%)(MOP'000)1 - 美國友邦保險 AIA (B)488,28331.7%2 - 澳門人壽 CSM (Vida)406,57026.4%3 - 國衞保險 AXA123,5868.0%4 - 澳門保險 CSM120,8687.8%5 - 中國保險 China Insurance111,4887.2%6 - 聯豐亨保險 Luen Fung Hang79,834 5.2%7 - 安泰保險 ING40,220 2.6%8 - 美國萬通保險 MassMutual39,429 2.6%9 - 中國人壽保險 China Life36,060 2.3%10 - 亞洲保險 Asia35,095 2.3%11 - 宏利保險 Manulife11,5690.8%12 - 英傑華保險 MSIG8,2250.5%13 - 昆士蘭保險 QBE6,8560.4%14 - 美安保險 American Home6,5790.4%15 - 安達保險 ACE5,7190.4%16 - 匯豐人壽 HSBC (Vida)5,1170.3%17 - 聯豐亨人壽 Luen Fung Hang (Vida)4,7850.3%18 - 匯業保險 Delta Asia4,2180.3%19 - 匯豐保險 HSBC3,3090.2%20 - 皇冠保險 Crown Life2,2990.1%21 - 閩信保險 Min Xin1,9720.1%22 - 忠誠保險 Fidelidade1,7800.1%23 - 忠誠人壽 Fidelidade Vida1490.0%24 - 永安保險 Wing On(46)0.0%- 24 -EVOLUÇÃO E QUOTA-PARTE DAS SEGURADORAS EM RELAÇÃO ÀS INDEMNIZAÇÕESBRUTAS DO SECTOR SEGURADOR澳門幣千元 (MOP'000)市場比率Quota de mercado 20072008*Δ %20072008*RAMO VIDA- 澳門人壽 CSM (Vida)124,348406,570227.0%11.3%26.4% - 安泰保險 ING23,19540,22073.4% 2.1% 2.6% - 聯豐亨人壽 Luen Fung Hang (Vida)4,8024,785(0.4%)0.4%0.3% - 美國友邦保險 AIA (B)386,120488,28326.5%35.1%31.7% - 皇冠保險 Crown Life 1,8202,29926.3%0.2%0.1% - 中國人壽保險 China Life 30,29036,06019.0% 2.8% 2.3% - 國衞保險 AXA 107,693123,58614.8%9.8%8.0% - 宏利保險 Manulife9,89011,56917.0%0.9%0.8% - 忠誠人壽 Fidelidade Vida 993149(85.0%)0.1%0.0% - 美國萬通保險 MassMutual 47,87139,429(17.6%) 4.3% 2.6% - 匯豐人壽 HSBC (Vida)3,0095,11770.1%0.3%0.3% (1)740,0311,158,06756.5%67.3%75.1%B. 非人壽保險RAMOS GERAIS- 聯豐亨保險 Luen Fung Hang 51,32579,83455.5% 4.7% 5.2% - 澳門保險 CSM118,008120,868 2.4%10.7%7.8% - 匯業保險 Delta Asia 2,8644,21847.3%0.3%0.3% - 安達保險 ACE5165,7191,008.3%0.0%0.4% - 中國保險 China Insurance 130,373111,488(14.5%)11.8%7.2% - 美安保險 American Home 9,1646,579(28.2%)0.8%0.4% - 亞洲保險 Asia 33,54635,095 4.6% 3.0% 2.3% - 英傑華保險 MSIG 8,3428,225(1.4%)0.8%0.5% - 永安保險 Wing On (5) (46) 820.0%0.0%0.0% - 閩信保險 Min Xin 91,97221,811.1%0.0%0.1% - 匯豐保險 HSBC 1,1473,309188.5%0.1%0.2% - 昆士蘭保險 QBE 5,2846,85629.8%0.5%0.4% - 忠誠保險 Fidelidade361,7804,844.4%0.0%0.1% (2)360,609385,8977.0%32.7%24.9%(1)+(2)=(3)1,100,6401,543,96440.3%100.0%100.0%* 臨時數字./- Valores provisórios.賠 償Indemnizações brutas賠償支出及所佔份額以總體業務作比較賠償支出COMPOSIÇÃO DAS INDEMNIZAÇÕES BRUTAS人壽VIDA澳門幣千元 (MOP'000)市場比率Quota de mercado 20072008*Δ %20072008*1- 美國友邦保險 AIA (B)386,120488,28326.5%52.2%42.2%2 - 澳門人壽 CSM (Vida)124,348406,570227.0%16.8%35.1%3 - 國衞保險 AXA 107,693123,58614.8%14.6%10.7%4 - 安泰保險 ING23,19540,22073.4% 3.1% 3.5%5 - 美國萬通保險 MassMutual 47,87139,429(17.6%) 6.5% 3.4%6 - 中國人壽保險 China Life 30,29036,06019.0% 4.1% 3.1%7 - 宏利保險 Manulife9,89011,56917.0% 1.3% 1.0%8 - 聯豐亨人壽 Luen Fung Hang (Vida)4,8024,785(0.4%)0.7%0.4%9 - 匯豐人壽 HSBC (Vida)3,0095,11770.1%0.4%0.4%10 - 皇冠保險 Crown Life 1,8202,29926.3%0.2%0.2%11- 忠誠人壽 Fidelidade Vida993149(85.0%)0.1%0.0% - 合計740,0311,158,06756.5%100.0%100.0%* 臨時數字./- Valores provisórios.賠 償Indemnizações brutas賠償支出COMPOSIÇÃO DAS INDEMNIZAÇÕES BRUTAS非人壽澳門幣千元(MOP'000)市場比率Quota de mercado20072008*Δ %20072008*1- 澳門保險 CSM118,008120,868 2.4%32.7%31.3%2 - 中國保險 China Insurance 130,373111,488(14.5%)36.2%28.9%3 - 聯豐亨保險 Luen Fung Hang 51,32579,83455.5%14.2%20.7%4 - 亞洲保險 Asia 33,54635,095 4.6%9.3%9.1%5 - 英傑華保險 MSIG 8,3428,225(1.4%) 2.3% 2.1%6 - 昆士蘭保險 QBE5,2846,85629.8% 1.5% 1.8%7 - 美安保險 American Home 9,1646,579(28.2%) 2.5% 1.7%8 - 安達保險 ACE5165,7191,008.3%0.2% 1.5%9 - 匯業保險 Delta Asia 2,8644,21847.3%0.8% 1.1%10 - 匯豐保險 HSBC 1,1473,309188.5%0.3%0.8%11 - 閩信保險 Min Xin 91,97221,811.1%0.0%0.5%12 - 忠誠保險 Fidelidade 361,7804,844.4%0.0%0.5%13- 永安保險 Wing On(5)(46)820.0%0.0%0.0% - 合計360,609385,8977.0%100.0%100.0%* 臨時數字./- Valores provisórios.NÃO - VIDA賠 償Indemnizações brutas賠償支出COMPOSIÇÃO DAS INDEMNIZAÇÕES BRUTAS勞工保險澳門幣千元(MOP'000)市場比率Quota de mercado20072008*Δ %20072008*1- 澳門保險 CSM23,59747,315100.5%24.5%37.1%2 - 中國保險 China Insurance 41,45341,265(0.5%)43.1%32.4%3 - 聯豐亨保險 Luen Fung Hang 7,84718,142131.2%8.2%14.2%4 - 亞洲保險 Asia15,23715,758 3.4%15.8%12.4%5 - 匯業保險 Delta Asia 1,3972,838103.1% 1.5% 2.2%6 - 英傑華保險 MSIG4,5122,280(49.5%) 4.7% 1.8%7 - 美安保險 American Home 393909131.3%0.4%0.7%8 - 昆士蘭保險 QBE 1,326672(49.3%) 1.4%0.5%9 - 閩信保險 Min Xin 2379243.5%0.0%0.1%10 - 永安保險 Wing On 074---0.0%0.1%11 - 安達保險 ACE50239(92.2%)0.5%0.0%12 - 忠誠保險 Fidelidade 7(2)(128.6%)0.0%0.0%13- 匯豐保險 HSBC(68)(1,913)2,713.2%(0.1%)(1.5%) - 合計96,226127,45632.5%100.0%100.0%* 臨時數字./- Valores provisórios.賠 償ACIDENTES DE TRABALHOIndemnizações brutas賠償支出COMPOSIÇÃO DAS INDEMNIZAÇÕES BRUTAS火險澳門幣千元(MOP'000)市場比率Quota de mercado20072008*Δ %20072008*1- 中國保險 China Insurance 2,10928,6181,256.9% 5.2%75.4%2 - 亞洲保險 Asia1,3666,883403.9% 3.4%18.1%3 - 美安保險 American Home 7,4032,459(66.8%)18.2% 6.5%4 - 安達保險 ACE 11,802180,100.0%0.0% 4.8%5 - 英傑華保險 MSIG 5181,773242.3% 1.3% 4.7%6 - 忠誠保險 Fidelidade71,68623,985.7%0.0% 4.5%7 - 聯豐亨保險 Luen Fung Hang 4441,227176.4% 1.1% 3.2%8 - 昆士蘭保險 QBE 6811,03552.0% 1.7% 2.7%9 - 閩信保險 Min Xin (16)796(5,075.0%)0.0% 2.1%10 - 匯豐保險 HSBC (38)469(1,334.2%)(0.1%) 1.2%11 - 匯業保險 Delta Asia 53727,340.0%0.0% 1.0%12 - 永安保險 Wing On 00---0.0%0.0%13- 澳門保險 CSM28,048(9,175)(132.7%)69.2%(24.2%) - 合計40,52837,945(6.4%)100.0%100.0%* 臨時數字./- Valores provisórios.賠 償INCÊNDIOIndemnizações brutas賠償支出COMPOSIÇÃO DAS INDEMNIZAÇÕES BRUTAS汽車保險澳門幣千元(MOP'000)市場比率Quota de mercado 20072008*Δ %20072008*1- 中國保險 China Insurance 29,09235,18220.9%33.6%37.0%2 - 澳門保險 CSM21,34328,40333.1%24.7%29.9%3 - 聯豐亨保險 Luen Fung Hang 20,21318,998(6.0%)23.4%20.0%4 - 亞洲保險 Asia 11,7117,776(33.6%)13.5%8.2%5 - 英傑華保險 MSIG 2,8173,50224.3% 3.3% 3.7%6 - 匯業保險 Delta Asia 1,397801(42.7%) 1.6%0.8%7 - 昆士蘭保險 QBE22531238.7%0.3%0.3%8 - 美安保險 American Home 114104(8.8%)0.1%0.1%9 - 閩信保險 Min Xin (146)50(134.2%)(0.2%)0.1%10 - 安達保險 ACE021---0.0%0.0%11 - 忠誠保險 Fidelidade 00---0.0%0.0%12 - 永安保險 Wing On (5)(36)620.0%0.0%0.0%13- 匯豐保險 HSBC(276)(82)(70.3%)(0.3%)(0.1%) - 合計86,48595,0319.9%100.0%100.0%* 臨時數字./- Valores provisórios.賠 償AUTOMÓVELIndemnizações brutas賠償支出COMPOSIÇÃO DAS INDEMNIZAÇÕES BRUTAS海運保險澳門幣千元(MOP'000)市場比率Quota de mercado 20072008*Δ %20072008*1- 匯豐保險 HSBC (36)508(1,511.1%)(5.5%)43.3%2 - 澳門保險 CSM789249(68.4%)121.4%21.2%3 - 中國保險 China Insurance 21171714.3% 3.2%14.6%4 - 聯豐亨保險 Luen Fung Hang 10913624.8%16.8%11.6%5 - 美安保險 American Home 29109275.9% 4.5%9.3%6 - 昆士蘭保險 QBE 2311,450.0%0.3% 2.6%7 - 匯業保險 Delta Asia 2612(53.8%) 4.0% 1.0%8 - 閩信保險 Min Xin (72)6(108.3%)(11.1%)0.5%9 - 安達保險 ACE 00---0.0%0.0%10 - 永安保險 Wing On 00---0.0%0.0%11 - 忠誠保險 Fidelidade 00---0.0%0.0%12 - 英傑華保險 MSIG (220)(16)(92.7%)(33.9%)(1.4%)13- 亞洲保險 Asia2(32)(1,700.0%)0.3%(2.7%) - 合計6501,17480.6%100.0%100.0%* 臨時數字./- Valores provisórios.賠 償MARÍTIMO CARGAIndemnizações brutas賠償支出COMPOSIÇÃO DAS INDEMNIZAÇÕES BRUTAS雜項保險澳門幣千元(MOP'000)市場比率Quota de mercado20072008*Δ %20072008*1- 澳門保險 CSM44,23154,07622.3%32.4%43.4%2 - 聯豐亨保險 Luen Fung Hang 22,71241,33182.0%16.6%33.3%3 - 中國保險 China Insurance 57,6986,252(89.2%)42.2% 5.0%4 - 昆士蘭保險 QBE 3,0504,80657.6% 2.2% 3.9%5 - 亞洲保險 Asia 5,2304,710(9.9%) 3.8% 3.8%6 - 匯豐保險 HSBC 1,5654,327176.5% 1.2% 3.5%7 - 安達保險 ACE133,85729,569.2%0.0% 3.1%8 - 美安保險 American Home 1,2252,998144.7%0.9% 2.4%9 - 閩信保險 Min Xin 2201,041373.2%0.2%0.8%10 - 英傑華保險 MSIG 715686(4.1%)0.5%0.6%11 - 匯業保險 Delta Asia 39195400.0%0.0%0.2%12 - 忠誠保險 Fidelidade 2296336.4%0.0%0.1%13- 永安保險 Wing On0(84)---0.0%(0.1%) - 合計136,720124,291(9.1%)100.0%100.0%* 臨時數字./- Valores provisórios.賠 償DIVERSOSIndemnizações brutas整體賠償成份表 *INDEMNIZAÇÕES BRUTAS DO SECTOR SEGURADOR DO EXERCÍCIO2008*澳門幣千元 (MOP'000)非 人 壽 Ramos gerais保險公司Seguradoras 人壽Vida勞工保險Acidentesde trabalho火險Incêndio汽車保險Automóvel海運保險Marítimo carga雜項保險Diversos合計Total整體賠償總金額Total das indemnizações brutas dosector seguradorA. 人壽保險RAMO VIDA. 本地保險公司Seguradoras locais- 澳門人壽 CSM (Vida)406,570406,570 - 安泰保險 ING40,22040,220 - 聯豐亨人壽 Luen Fung Hang (Vida)4,7854,785(1)451,575451,575 . 外地保險公司Seguradoras do exterior- 美國友邦保險 AIA (B)488,283488,283 - 皇冠保險 Crown Life2,2992,299 - 中國人壽保險 China Life36,06036,060 - 國衞保險 AXA123,586123,586 - 宏利保險 Manulife11,56911,569 - 忠誠人壽 Fidelidade Vida149149 - 美國萬通保險 MassMutual39,42939,429 - 匯豐人壽 HSBC (Vida)5,1175,117(2)706,492706,492(1)+(2)=(3)1,158,0671,158,067B. 非人壽保險RAMOS GERAIS. 本地保險公司Seguradoras locais- 聯豐亨保險 Luen Fung Hang18,1421,22718,99813641,33179,83479,834 - 澳門保險 CSM47,315(9,175)28,40324954,076120,868120,868 - 匯業保險 Delta Asia2,838372801121954,2184,218 - 安達保險 ACE391,8022103,8575,7195,719 - 中國保險 China Insurance41,26528,61835,1821716,252111,488111,488(4)109,59922,84483,405568105,711322,127322,127 . 外地保險公司Seguradoras do exterior- 美安保險 American Home9092,4591041092,9986,5796,579 - 亞洲保險 Asia15,7586,8837,776(32)4,71035,09535,095 - 英傑華保險 MSIG2,2801,7733,502(16)6868,2258,225 - 永安保險 Wing On740(36)0(84)(46)(46) - 閩信保險 Min Xin797965061,0411,9721,972 - 匯豐保險 HSBC(1,913)469(82)5084,3273,3093,309 - 昆士蘭保險 QBE6721,035312314,8066,8566,856 - 忠誠保險 Fidelidade(2)1,68600961,7801,780(5)17,85715,10111,62660618,58063,77063,770(4)+(5)=(6)127,45637,94595,0311,174124,291385,897385,897(3)+(6)=(7)1,158,067127,45637,94595,0311,174124,291385,8971,543,964* 臨時數字./-Valores provisórios.。
InnovateC:I H6A:H^c W^aa^dch d[ YdaaVgh*&#)-(#**+#,+-#',+#*%)%*%+%-%,DE:G6I>C< 86H= ;ADL^c W^aa^dch d[ YdaaVgh.#)&*#--#,&&#)&(#)%)%*%+%-%,9>AJI:9 C:I :6GC>C<HeZg Xdbbdc h]VgZ'#'%(#+)'#*('#+)(#%)%)%*%+%-%,ContentsLetter to Shareholders 2Defining Innovation 10Investing in Innovation 14Managing Innovation 18Delivering Innovation 22Leading Innovation 26Financial Contents 35Corporate Officers 77Board of Directors 78Shareholder Information 7911-Year Financial Summary 80P&G at a Glance 82Financial HighlightsFInAnCIAl SummARy (unAuDIteD)Amounts in millions, except per share amounts 2008 2007 2006 2005 2004 Net Sales $83,503 $76,476 $68,222 $56,741 $51,407 Operating Income 17,083 15,450 13,249 10,469 9,382 Net Earnings 12,075 10,340 8,684 6,923 6,156 Net Earnings Margin 14.5% 13.5% 12.7% 12.2% 12.0% Basic Net Earnings Per Common Share $ 3.86 $ 3.22 $ 2.79 $ 2.70 $ 2.34 Diluted Net Earnings Per Common Share 3.64 3.04 2.64 2.53 2.20 Dividends Per Common Share 1.45 1.28 1.15 1.03 0.93P&G is designed to innovate consistently and successfullyin every part of our business.We define innovation broadly, in terms of what it is, where it comes from, and who’s responsible for it.We invest in innovation at industry-leading levels with ongoing productivity savings.We manage innovation with discipline.We deliver innovation that builds consumer trust and loyalty over time.We lead innovation on leading global brands and with an outstanding team of innovation leaders.P&G is Designed to Innovate… and to grow.On June 4, 2008, we announced our agreement to merge P&G’s coffee business with The J.M. Smucker Company. The agreement maximizes the after-tax value of the coffee business for P&G shareholders and minimizes earnings-per-share dilution versus other alternatives. We expect to complete the transaction during the second quarter of fiscal 2009.sustAInInG GRowth thRouGh InnovAtIonThis is strong performance, but the challenge of sustaining growth is greater today than at any time in the past 50 years. Commodity and energy costs continue to rise for companies. Consumers are facing higher food and gas prices, declining home values, and rising levels of unemployment. The question shareholders and prospective investors are asking is: ”How willP&G sustain growth in today’s challenging and uncertain economic environment?”the answer is clear to all of us at P&G: we will continue to innovate in every part of our business. Innovation is at the heart of P&G’s business model. It is the primary way we delight consumers, create value with retail partners, and create new business models to deliver consistent, sustainable growth at or ahead of the Company’s goals.A lot of companies talk about innovation, but P&G has demonstrated the capability — over decades — to innovate consistently, reliably and successfully. We have a long list of innovation firsts in our industry:Tide was the first heavy-duty laundry detergent•Crest, the first fluoride toothpaste clinically proven to prevent •tooth decayDowny, the first ultra-concentrated rinse-add fabric softener •Pert Plus, the first 2-in-1 shampoo and conditioner•Head• & Shoulders, the first pleasant-to-use shampoo effective against dandruffPampers, the first affordable, mass-marketed disposable diaper •Bounty, the first three-dimensional paper towel•Always, the first feminine protection pad with an innovative, •dry-weave topsheet.Febreze, the first fabric and air care products that actually •remove odors from fabrics and the airCrest White Strips, the first patented in-home teeth whitening •technology P&G continues to be one of the few companies in our industry that creates new categories and brands, new performance standards, and new definitions of consumer value. Swiffer and Febreze created entirely new product categories. Crest Pro-Health, Olay Regenerist and Definity, Pampers Baby Stages of Development, and Tide with Bleach redefined high performance in their categories. Olay innovation has created new consumer experiences that are as good as — or better than — several-hundred-dollar department and specialty store brands.We innovate so consistently across our diverse portfolio of businesses, and so consistently over time, because we’ve created a unique design for innovation at P&G.1. We define innovation broadly.2. We invest in innovation at industry-leading levels.3. We manage innovation with discipline.4. We deliver innovation that builds consumer trustand loyalty over time.5. We lead innovation with global brands and an outstanding team of innovation leaders.This integrated, end-to-end approach is complemented byP&G’s global scale and scope, which is unrivaled in our industry. The result is an innovation design that enables P&G to win with consumers and retail customers and to generate sustainable long-term growth and shareholder value.DeFInInG InnovAtIon BRoADLyWe define innovation broadly. We innovate in every area where our brands touch consumers’ lives: the package and product, the shopping experience, the in-home product usage experience, and every aspect of communication. We also create innovative new business models and organizational structures. By innovating so broadly, we get to see more innovation opportunities and to leverage more innovation resources than more narrowly focused competitors.Our Family Care business is a good example. Twenty years ago, we created a proprietary paper-making process that enables us to produce the strongest, softest, most absorbent paper towels and tissues on the market. But our approach to innovation in Tissues and Towels is driven by consumers, not by the technology.4 The Procter & Gamble CompanyBy defining innovation so broadly — what it is, where it comes from, who’s responsible for it — we continually expand and unleash P&G’s innovation potential. The best proof of our innovation capability is the number of top-selling new products that come from P&G. The IRI Pacesetters study tracks and ranks the most successful new consumer products introduced in the U.S. For the past 13 years, one-third of the most successful Pacesetter products, on average, have come from P&G and Gillette — more than our top six competitors combined. In 2008, 5 of the 10 best-selling new products came from P&G, including Tide Simple Pleasures detergent, Febreze Noticeables air fresh-ener, the new Herbal Essences line of products, Crest Pro-Health toothpaste, and Olay Definity skin care products.InvestInG In InnovAtIonAnother point of difference is P&G’s ability to invest in innovation at industry-leading levels. We invest more than $2 billion a year in R&D, nearly twice the level of our closest competitor, Unilever, and roughly equal to the combined total of our other major competitors — Avon, Clorox, Colgate, Energizer, Henkel, Kimberly Clark, L’Oreal, and Reckitt Benckiser. We also maintain a high level of marketing investment in our brands. P&G’s advertising investment has averaged about 10% of sales over the past 15 years.We maintain this strong level of innovation and marketing investment, while continuing to grow margins, by continually increasing P&G’s productivity. The more productive we become, the more we can redeploy people and dollars to innovation.P&G has a strong track record of reliable productivity growth. Sales per employee have grown more than threefold and net earnings per employee are up eightfold since 1980. Over the past 10 years, P&G’s productivity on a sales-per-employee basis has grown at an average rate of 6% a year. This performance is more than twice the U.S. average of roughly 2.5% productivity growth per year.P&G grows productivity so reliably because we take a very systemic approach. A good example of this is Global Business Services — P&G’s shared services business model. Early this decade, we significantly reduced the cost of business services by centralizing and standardizing P&G systems, infrastructure and services. We then focused on improved service levels and greater value creation, ultimately creating a global business services organization that has been recognized externally as the best shared-services organization in the world, and which has delivered nearly $600 million of cumulative cost savings to date — a substantial portion of which we’ve reinvested in innovation.In addition, GBS — in collaboration with our R&D and Engineering functions — is making P&G a more productive and effective innovator by accelerating the use of virtualization, computer modeling and simulation. Virtualization is enabling P&G brands to co-design products with consumers. The same technologies allow us to show retailers virtual in-store displays for half the cost and less than half the time required for physical shelf designs. Computer modeling and simulation saved P&G about 17 years of design time in the last year alone.We’re convinced we can become even more productive, increasing productivity 7–8% a year. We’re making our brand portfolio more productive by focusing even more on our largest leading brands — the 44 brands with sales of $500 million or more that represent 85% of sales and more than 90% of profits. We’re getting more disciplined about how to manage the remaining brands in P&G’s portfolio, investing in small brands that have potential to become billion-dollar brands of the future, supporting brands that may not have global potential but are local jewels in some markets, and consolidating or divesting underperforming brands. And, we’re seizing even more opportunities to leverage P&G scale by eliminating duplicative activities, centralizing more functional support, and consolidating some small countries into regional hubs.We’re also going after cost savings throughout the Company. We have clearly defined goals for controlling overhead spending. Businesses projected to grow significantly faster than the balance of the portfolio have an overhead target equal to or less than half their projected sales growth; slower-growing businesses and all corporate functions are committed to zero overhead growth; businesses growing below company goals and/or with significant cost-structure issues must reduce overhead spending every year. This discipline reflects our commitment to flat or declining headcount for the foreseeable future.These and other efforts throughout the Company are critical. Productivity fuels innovation. Innovation drives growth. MAnAGInG InnovAtIon wIth DIscIPLIneThe next factor that sets P&G apart as an innovator is discipline. We don’t rely on “Eureka!” moments; we take a systematic approach to innovation.For example, we’re highly systematic about how we organize for innovation. We don’t take a “one-size-fits-all” approach but we’re deliberate about creating the right structure for different kinds of innovation work. Our Corporate Innovation Fund, for example, specializes in high-risk, high-reward ideas; it’s essentially an in-house venture capital firm that does initial concept, design, engineering, and qualification work and then6 The Procter & Gamble Companyhands over successful ideas to the appropriate business units. The FutureWorks team focuses exclusively on innovations that can create entirely new businesses. There are new-business development teams in every global business unit focusing on opportunities to create adjacent categories. Innovation centers help us solve tough innovation challenges by providing simulated in-home and in-store environments where P&G teams can isolate themselves and interact with consumers and shoppers for days or even weeks at a time.Once an idea is qualified and begins moving through our product launch system, the innovation team continues to face go / no-go gates at every critical milestone. At each gate, we make decisions about which initiatives are ready to progress, which need further work, and which should be stopped. Every decision is grounded in maximizing the productivity of innovation investments and generating shareholder value.This disciplined approach is essential to innovation success.It builds accountability into both the creative and executional aspects of innovation. P&G’s Family Care business is a good example here, as well. Family Care is one of P&G’s strongest value-creating businesses. They’ve innovated broadly across brand platforms — Bounty, Charmin and Puffs — while delivering industry-leading, double-digit total shareholder return for the past one-, three- and five-year periods in a highly capital-intensive category. They’ve increased gross margins 7% and have delivered free cash flow well above the Company’s 90% cash productivity target for the past five years, despite invest-ments in innovation and in new manufacturing capacity to support growth.There are similar stories in Fabric Care, Feminine Care, Baby Care, Beauty Care, and Health Care. These are the results of disciplined innovation.DeLIveRInG A steADy stReAM oF InnovAtIon What I’ve explained so far — the way we think about innovation, our ability to invest in it, and the discipline with which we manage it — are the elements of P&G’s innovation design that are difficult to see from the outside. Each of these factors helps to set P&G apart as an innovator. What counts most, however, is the innovation that consumers experience day after day, year after year.We earn consumer trust and loyalty over time by delivering an unending stream of innovation that consumers learn to expect from P&G brands. We plan three-to-five years out and fill our pipeline with three distinct kinds of innovation.Disruptive innovation• creates new categories, new segments, or entirely new sources of consumer consumption. These are innovations that address consumer needs no other brand or product has met. Virtually all of P&G’s billion-dollar brands were created with disruptive innovations.Sustaining innovation• is what we focus on most. These are extensions or improvements of existing products: big initiatives that meet consumer needs by filling gaps, eliminating consumer trade-offs, or providing new benefits. Examples include Pampers Caterpillar-Flex, which improved the fit and comfort of baby diapers, and Crest Pro-Health Rinse, the Crest brand’s entry into the mouth-rinse category adjacent to toothpastes. Commercial innovation• generates trial on existing products without a product or package change. Examples include the Gillette Champions and Pampers Unicef programs, marketing efforts that give consumers new reasons to be interested in and loyal to a P&G brand.Always is a great example of how this multidimensional innovation strategy builds loyalty and category leadership. We introduced Always in 1984 as the first feminine protection pad with an innovative, dry-weave topsheet. In 1986, the brand set yet another performance standard with its proprietary “wings” product, followed by Ultra Thin products in 1991. These three disruptive innovations brought years of competitive advantage. In addition to these disruptive innovations, we have maintained a steady pace of product upgrades with sustaining innovations like Always Fresh, Always Clean and Always Overnight. This year, Always is leading innovation again, with a disruptive initiative called Always Infinity that uses a unique pad design and new, state-of-the-art technology to bring a new level of superior protection and absorbency to consumers. Always has also delivered a steady stream of meaningful commercial innovation. The brand’s school education programs teach girls about puberty, and introduce them to the category and our brands. Another commercial innovation, from both Always and Tampax, is , a unique website that enables teens to get information in a safe, discreet environment and to interact with peers facing similar life-stage issues.This combination of disruptive, sustaining and commercial innovation keeps a brand like Always growing year after year. Always has grown in 21 of the 24 years since launch and has increased its U.S. market share from 14% to 48%, and today has a global share of 31%. There are examples like Always throughout P&G’s brand portfolio.The Procter & Gamble Company 7LeADInG InnovAtIonMaking P&G’s design for innovation work is the job of leadership.Innovation is a human activity and leaders must unleash the creativity, initiative, leadership, and productivity of the innovators in their businesses. This requires a blend of intelligence and empathy. Empathy is incredibly important in a diverse, people-intensive business like ours. Most of our creativity and innovation happens in teams, and often the teammates are working in different parts of the world.To lead in this kind of environment, we need a balance of intellectual skills and empathic skills. We have to develop the intuition to understand and appreciate people’s intentions, feelings and motivations — all of which have been shaped by experiences that may be sharply different from those we’ve grown up with ourselves.At the same time, innovation leaders must be decision-makers. They must exercise the judgment and the courage to take innovation risks and to understand the role fast failure plays in the innovation process, while also being willing to stop projects and reallocate resources to bigger innovation opportunities when necessary.I’m a big believer that innovation leaders are made, not born. They learn to get comfortable with uncertainty. They learn to become more open-minded, to co-create with consumers, and to be receptive to ideas from different disciplines and industries. They learn to become both strategists and operational managers, to be agile and disciplined. As they learn and gain experience, they become more effective at leveraging P&G’s design for innovation to deliver consistent, sustainable growth.The ability to lead effective innovation programs is required at P&G, particularly at the general manager and president levels. Good innovation leaders need to be cultivated and promoted — and I hold myself accountable for helping to select and develop the innovation leaders who run P&G businesses around the world. Ensuring P&G has the leaders and the pipeline to innovate for the next ten years is one of my most fundamental responsibilities as chief executive.LeveRAGInG GLoBAL scALe AnD scoPeThe most differentiating aspect of P&G’s approach to innovation is the scale and scope of our business and brand portfolio, science and technology platforms, and geographic reach.The diversity of our business portfolio creates highly valuable scale benefits. Our Health & Beauty businesses take advantage of purchasing pools created by Household businesses such as laundry, diapers and paper products. This enables them to purchase packing materials and basic commodities at lower prices than their direct competitors. Similarly, Household Care enjoys economies of scale created by the large advertising budgets supporting our Health & Beauty Care businesses.We use these scale advantages to invest in innovation.The diversity of P&G’s brand portfolio gives us the opportunity to innovate in more aspects of consumers’ lives than nearly any other company. P&G brands are in every room of the house, at virtually every hour of the day. As a result, we get to see more of consumers’ needs than other companies. This helps us spot more problems P&G innovation can help solve and more aspirations P&G brands can help achieve.Our science and technology portfolio is another huge scale advantage. Bleach technology from Laundry has been used in Health & Beauty Care products such as Crest White Strips and Nice ‘n Easy Perfect 10 Hair Colorant. Non-woven top sheet technology started in Diapers, traveled to Feminine Care then moved to Swiffer and Olay Daily Facials. Proprietary perfume technology has been used to enhance the performance of Bounce, Febreze, Fine Fragrances, Camay and most recently Secret and Gillette Clinical Strength deodorant. We’re now combining Gillette’s expertise in mechanical engineering with our expertise in chemical engineering.Companies that compete primarily in Beauty can’t benefit from such technology transfer because they don’t have a Laundry business. Home Care competitors can’t move a substrate technology from diapers or feminine hygiene if they’re not in those businesses. There is no other company in our industry whose portfolio of businesses and brands, sciences and technologies is as broad, as deep or as diverse as P&G’s. This is a very significant source of competitive advantage. We use our diverse mix of sciences and technologies to make innovation connections that other companies cannot make on their own. Another area in which we can leverage P&G scale is our geographic reach. In developed markets like the U.S., where P&G brands can be found in virtually every household, we leverage household penetration as a scale advantage. In developing markets, we’re using our portfolio of leading brands to attract and build a network of best-in-class, often exclusive distributors in countries such as China, India and Russia. Today our distributor network in China reaches about 800 million people. In India, our distributor network covers 4.5 million stores, an increase of two million stores in just five years. In Russia, we now have access to 80% of the population.8 The Procter & Gamble CompanyWhat innovation is at P&G:Where innovationcomes from at P&G:Who’s responsible for innovation at P&G:N NGI N N O V A T I O NHead & Shoulders is now the best-selling shampoo in the world. By innovating broadly, Head & Shoulders doubled its global sales in just five years.Consumer InsightsGreat innovation begins with a deep understanding of current and potential consumers. Most consumers felt Head & Shoulders delivered good dandruff control, but many assumed they had to trade off beauty benefits. This research clearly defined the brand team’s challenge in developing new product, package and marketing innovations.Product InnovationThe challenge: keep improving antidandruff performance while innovating to satisfy consumers’ beauty desires. A new focus on scalp health as the first step toward beautiful hair has appealed to a broad range of consumers beyond those concerned with dandruff. In addition, line extensions, such as “Sensitives,” have appealed to consumers with sensitive scalps, and on-package endorsements from dermatological associations have helped drive trial.The Procter & Gamble Company 12 Package and Graphics InnovationThe simple, elegant curve of the new Head & Shouldersbottle design conveys the softer, more cosmetic sideof the brand, while the bottle’s straight side reflectsthe strength and efficacy that consumers expect fromHead & Shoulders. The dramatic, intuitive graphic hasstrengthened brand equity and made it much easierfor consumers to find the product that’s right for them.Marketing InnovationThe package curve has become a consistent designfeature in all global consumer communications,including TV, print, Internet and outdoor advertising.This consistent graphic look has helped build equityin the Head & Shoulders brand at every consumertouch-point.Go-to-Market InnovationThe business team developed a tool to evaluate scalphealth and recommend the right Head & Shouldersproduct. Millions of scalp evaluations have been donein and near retail stores around the world, helpingconsumers take the first step toward healthy,beautiful hair.Supply Chain InnovationP&G’s hair care R&D and supply chain experts developedcreative solutions to produce the challenging newpackage along with selective product formulationimprovements in record time. The new, equity-enhancingpackage was launched in more than 140 countries injust nine months, yielding amazing speed-to-market todelight Head & Shoulders consumers around the world.Head & Shoulders now generates about$2 billion in annual sales for P&G. With strongmomentum and a robust innovation pipeline,Head & Shoulders should remain one ofP&G’s fastest-growing billion-dollar brands.Productivity and cost savings discipline Steady investment in innovation and brand buildingI N I N N O V A T I O NST NG-%%-.%%%(#*MH6A:H E:G :BEADN::* 8dbedjcY 6kZgV\Z <gdli] GViZ-%%-.%%%-#)MC:I :6GC>C<H E:G :BEADN::- 8dbedjcY 6kZgV\Z <gdli] GViZMaintaining consistent investment in innovation and marketing requires a relentless focus on productivity improvements and cost savings.Innovation, Productivity & GrowthInnovation, productivity andgrowth is a virtuous cycle at P &G. In our industry, innovation and productivity are the key drivers of profitable organic sales growth. Innovation creates superiorconsumer value, differentiates brands, and prevents thecommoditization of categories. Productivity fuels investment in innovation and brand-building, acting as an engine of both top- and bottom-line growth.Historical Productivity ImprovementP &G’s organizational productivity has increased both significantly and consistently over the years. Since 1980, it has jumped more than threefold, growing at acompound average rate of nearly 5% a year — more than twice the broad-based U.S. productivity rate. Net earnings per employee are up more than eight-fold, growing at an average of nearly 8% per year.Productivity & Savings ProjectsWe are constantly improving productivity in all areas of the business and all elements of cost.Net Sales- Cost of Products SoldRaw & Packaging Materials Manufacturing Expenses Finished Product Logistics- S elling, General & Administrative CostsMarketing Sales ResearchAdministrationOperating Profit- Interest Expense- Other Income ExpensePretax Profit- TaxesNet EarningsP &G researchers are continually searching for new formulations and designs that lower cost, improve performance and increase value for consumers. For instance, new formulations of laundry detergents significantly reduced our use of packaging material, leading to cost savings, more consumer convenience and less waste for the environment.MATErIAlS PrOduCTIvITyWe are building more local, multi-category manufacturing plants closer to the consumer, enabling local materialssourcing, lower distribution costs, and lower import duties. This also helps P &G build strong international relationships and deepens our understanding of local consumer needs.MANufACTurING PrOduCTIvITyWe are generating cost savings in shipping and warehousing while improving service levels to customers by optimizing the Company’s finished-product supply chain, including cutting the number of distribution centers in half.dISTrIbuTION PrOduCTIvITyAll of P &G’s major global brands have changed their mix of marketing tools to reach target consumers more costeffectively. In Feminine Care, for instance, Always and Tampax have reduced TV advertising budgets in favor of higher-return magazine ads and our “” website.MArkETING PrOduCTIvITyP &G is reducing go-to-market costs with streamlined organization designs in developing markets, smaller local organizations, and faster decision-making. We areimplementing these designs in the Latin America, Central and Eastern Europe and ASEAN markets.GO-TO-MArkET PrOduCTIvITyP &G has reduced R &D costs as a percentage of sales, increased the value of the innovation pipeline and led the industry in innovation delivered to market by leveraging a global network of external innovation partners.r &dPrOduCTIvITyP &G is driving down overhead costs as a percentage of sales by reducing senior management positions, cutting the number of managers on international assignments, moving toward a corporate shared services structure, and reducing staffing duplication among global, regional and local organizations.OrGANIzATIONAl PrOduCTIvITyThe Procter & Gamble Company 16。
美国感恩节促销本文为美国感恩节促销资讯,感恩节促销,看看美国商家都使出了哪些新奇招数?让我们通过以下的文章来了解。
美国感恩节促销资讯在本(XX)年11月8日(下週二)美国总统大选过后,为节日购物者的狂欢过节气氛做准备,因为消费者会利用促销和交易活动去购买过节礼品,同时也犒赏自己。
由Prosper Insights & Analytics所进行一项美国全国零售联盟(National Retail Federation,NRF)的年度消费者支出调查的最新数据显示,消费者计划在节日购物季之平均支出为美元。
今年的总计划支出仅次于去(XX)年总支出美元。
NRF总裁兼执行长MatthewShay解释:「无论你从报纸上或从电视上看到的,政治广告都佔满了零售商通常用于在取得全国消费者心目中假日购物的广告空间。
一旦选举过了,我们预期消费者自己将从选举低潮中走出和进入到过节的气氛里」。
消费者计划将自己置于他们购物清单的最优先,10月底一项由NRF单独进行得短暂民调,显示有58%的消费者计划为自己採购东西,平均花费为美元,比去(XX)年的美元成长了4%,显示着在13年的歷届调查中个人消费处在第二高。
Shay补充道:「零售商应该在总统选举后的几个星期为这股消费者採购潮做好准备,因为他们获得了更多在经济和政治上的确定性,并希望利用这股促销和交易活动,传递给他们的亲朋好友甚至自己不能错过这个好康的採购季,许多购物者在这个节日里採取了”一个给你,两个给我“的方式」。
零售商正在准备提供各式各样的商品和促销活动–零售商想要提供如此优惠价格的礼物,让消费者们好好犒赏自己一番。
尽管有超过四分之一的消费者表示,这次选举将影响他们假日的支出计画,43%的人补充表示,由于选举季节的不确定性,他们对支出更加谨慎,有87%的消费者在良好销售或促销活动、犒赏自己的完美礼物或其他因素或免费送货优惠的引诱之下,可能会在这节日季增加25美元的额外花费。
IntroductionAs we approach the end of the calendar year, it is imperative for our company to conduct a comprehensive annual financial closing report. This report aims to summarize the financial performance of the company forthe year, analyze the key financial indicators, and provide insightsinto the company's future prospects. The report covers the period from January 1, 2022, to December 31, 2022.Revenue and SalesDuring the year 2022, our company achieved remarkable growth in revenue and sales. Total revenue reached $100 million, a 20% increase comparedto the previous year. This growth can be attributed to several factors, including the successful launch of new products, expansion into new markets, and an increase in market share.The sales performance can be further broken down into the following segments:1. Product A: Revenue from Product A increased by 25% year-on-year, driven by strong demand and effective marketing strategies.2. Product B: Revenue from Product B grew by 15% year-on-year, due to successful promotional campaigns and the expansion of distribution channels.3. Product C: Revenue from Product C saw a decrease of 5% year-on-year, primarily due to the decline in demand in certain regions.Cost of Goods Sold (COGS)The cost of goods sold (COGS) for the year 2022 was $70 million, representing a 10% increase compared to the previous year. The increasein COGS can be attributed to the following factors:1.原材料价格上涨:由于原材料价格上涨,导致生产成本上升,从而推高了COGS。