ANSYS云图显示的最大应力与列表显示的不一样
- 格式:doc
- 大小:26.50 KB
- 文档页数:7
Ansys后处理-如何看应力点击数:3091 更新时间:2012-4-20 16:29:47SX:X-Component ofstress;SY:Y-Component of stress;SZ:Z-Component ofstress--X,Y,Z轴方向应力。
SXY:XY Shear stress;SYZ:YZ Shearstress;SXZ:XZ Shear stress--X,Y,Z三个方向的剪应力。
S1:1stPrincipal stress;S2:2st Principal stress;,S3:3st Principalstress--第一、二、三主应力。
区分:首先把一个微元看成是一个正方体,那么假设三个主应力分别是F1F2F3,那么如果三个力中哪个力最大,就是F1,也是最大主应力,也叫第一主应力,第二大的叫第二主应力,最小的叫第三主应力,因此,是根据大小来定的。
SINT:stress intensity--应力强度,是由第三强度理论得到的当量应力,其值为第一主应力减去第三主应力。
SEVQ:Von Mises是一种屈服准则,屈服准则的值我们通常叫等效应力。
Ansys 后处理中'VonMises Stress'我们习惯称Mises等效应力,它遵循材料力学第四强度理论(形状改变比能理论)。
我们分析后查看应力,目的就是在于确定该结构的承载能力是否足够。
那么承载能力是如何定义的呢?比如混凝土、钢材,应该就是用万能压力机进行的单轴破坏试验吧。
也就是说,我们在ANSYS计算中得到的应力,总是要和单轴破坏试验得到的结果进行比对的。
所以,当有限元模型本身是一维或二维结构时,通过查看某一个方向,如plnsol,s,x等,是有意义的。
但三维实体结构中,应力分布要复杂得多,不能仅用单一方向上的应力来代表结构此处的确切应力值——于是就出现了强度理论学说。
材料力学中的四种强度理论1.第一强度理论:最大拉应力强度理论该理论认为,材料破坏的主要因素是最大拉应力,无论何种状态,只要最大拉应力达到材料的单向拉伸断裂时的最大拉应力,则材料断裂。
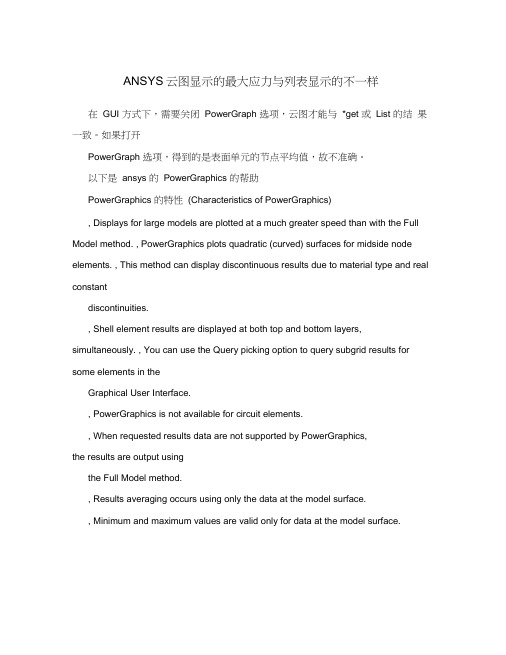
ANSYS云图显示的最大应力与列表显示的不一样在GUI 方式下,需要关闭PowerGraph 选项,云图才能与*get 或List 的结果一致。
如果打开PowerGraph 选项,得到的是表面单元的节点平均值,故不准确。
以下是ansys 的PowerGraphics 的帮助PowerGraphics 的特性(Characteristics of PowerGraphics), Displays for large models are plotted at a much greater speed than with the Full Model method. , PowerGraphics plots quadratic (curved) surfaces for midside node elements. , This method can display discontinuous results due to material type and real constantdiscontinuities., Shell element results are displayed at both top and bottom layers, simultaneously. , You can use the Query picking option to query subgrid results for some elements in theGraphical User Interface., PowerGraphics is not available for circuit elements., When requested results data are not supported by PowerGraphics,the results are output usingthe Full Model method., Results averaging occurs using only the data at the model surface., Minimum and maximum values are valid only for data at the model surface., PowerGraphics supports only the results coordinate system for plotting results data. (Theelements-based coordinate system is not supported.)何时使用PowerGraph,(When to Use PowerGraphics)Using the PowerGraphics display method has distinct advantages, since graphics displays are plotted ata much faster rate of speed than with the Full Model method. In addition, PowerGraphics produces morerealistic results at material type and real constant discontinuities in the model.1 和full model 相比,显示速度快;2在模型的材料类型和实常数不连续时,得到更加真实的结果。

ANSYS 后处理中Nodal solu ,Element solu,Element table 应力结果的区别simwefanhj参考文献:李辉煌,《ANSYS 工程分析基础与观念》,高立图书有限公司感谢Dr.Q Z Jin 指导从计算模型中取出4个shell63单元的结果进行说明 (1)节点解Nodal solu 和单元解Element solu 的区别。
19535 195731955419574195551953698049803 9802MNMXtank_container_modify323313623140131440324793251832557335963363534SEQV (AVG)DMX =.00403SMN =32331SMX =6743419535 19573195549804195361957498029803 19555MNMXtank_container_modify3623140131440324793251832557335963363534NODAL SOLUTION SEQV (AVG)(a ) (b )图1 节点解云图19535 19573195541953698041957419555 98039802MNMXtank_container_modify323313648840646448044896253120572776143565593ELEMENT SOLUTION SEQV (NOAVG)DMX =.00403SMN =32331SMX =697511953619535 19573195741955419555 980398049802MNMXtank_container_modify3648840646448044896253120572776143565593ELEMENT SOLUTION SEQV (NOAVG)(a ) (b )图2 单元解云图有限元分析的DOF 的数值解(亦即displacement fields )在空间上虽然是连续的,但是并不一定是平滑的;事实上是:在单元的内部,这些displacement fields 是连续且平滑的(因为是由形状函数所描述),但是跨过单元的边界时,则通常是连续但不平滑的(形状函数并不跨越单元边界);所以整体空间而言,displacement fields 是连续但不平滑的,在数学上我们称之为「片段平滑」函数(piece-wise smooth functions )。
1.ANSYS中的等效应力是什么物理含义?1)ANSYS中等效应力最大应力s1有什么区别,平常讨论应力分布,应该用等效应力还是最大应力s1呢?2)计算等效应力时是否需要输入等效泊松比呢?3)在实际的应用中,例如在讨论平板上的圆孔应力集中的应力分布问题时,应该用等效应力来描述应力集中的现象,还是采用主应力s1来反应集中的程度呢?还是采用一个单方向的sx来说明问题呢?答:1)这个等效应力应该就是弹塑性力学里的VonMises应力,他主要考察的是材料在各个方向上的应力差值,因为在实验室里获得材料强度都是单向载荷作用下的强度(当然现在也有三轴应力实验仪),所以有时候材料所受的单向载荷可能很大,但并没有造成破坏,这是就是看他的等效应力,具体计算公式是:σ等效=sqrt{0.5[(σ1-σ2)^2+(σ2-σ3)^2+(σ3-σ1)^2]}2)等效应力是三项主应力的组合如s,int即为max(si-sj),si,sj为三项主向应力。
i,j=1,2,3 i≠j即tresca型 s,eqv为sqrt(0.5*∑(si-sj)**2),i,j=1,2,3 i≠j即mises型3)个人认为应该采用等小应力来描述应力集中的现象,因为在实际中很难找到真正的单轴拉压的情况,一般结构的受力都没有这么简单,所以在分析的时候需要用等效应力来将各主应力进行转化,因此应该用等效应力来描述应力集中的现象。
4)等效泊松比就是泊松比,等效应力计算时不会用到泊松比,不过在计算mises等效应变时会用到。
对于泊松比的取值原则应遵循以下两条:a:对于elastic & thermal strains 泊松比取为材料的泊松比;b:对于plastic creep hyperelastic strains 泊松比取为0.5。
2.ANSYS后处理中负值的应力是压应力还是拉应力?答:在力学范畴内对描述应力的准则是拉为正,压为负。
外载荷(压力/拉力),压为正,拉为负。

ANSYS基础教程——应力分析关键字:ANSYS应力分析ANSYS教程信息化调查找茬投稿收藏评论好文推荐打印社区分享应力分析是用来描述包括应力和应变在内的结果量分析的通用术语,也就是结构分析,应力分析包括如下几个类型:静态分析瞬态动力分析、模态分析谱分析、谐响应分析显示动力学,本文主要是以线性静态分析为例来描述分析,主要内容有:分析步骤、几何建模、网格划分。
应力分析概述·应力分析是用来描述包括应力和应变在内的结果量分析的通用术语,也就是结构分析。
ANSYS 的应力分析包括如下几个类型:●静态分析●瞬态动力分析●模态分析●谱分析●谐响应分析●显示动力学本文以一个线性静态分析为例来描述分析步骤,只要掌握了这个分析步骤,很快就会作其他分析。
A. 分析步骤每个分析包含三个主要步骤:·前处理–创建或输入几何模型–对几何模型划分网格·求解–施加载荷–求解·后处理–结果评价–检查结果的正确性·注意!ANSYS 的主菜单也是按照前处理、求解、后处理来组织的;·前处理器(在ANSYS中称为PREP7)提供了对程序的主要输入;·前处理的主要功能是生成有限元模型,主要包括节点、单元和材料属性等的定义。
也可以使用前处理器PREP7 施加载荷。
·通常先定义分析对象的几何模型。
·典型方法是用实体模型模拟几何模型。
–以CAD-类型的数学描述定义结构的几何模型。
–可能是实体或表面,这取决于分析对象的模型。
B. 几何模型·典型的实体模型是由体、面、线和关键点组成的。
–体由面围成,用来描述实体物体。
–面由线围成,用来描述物体的表面或者块、壳等。
–线由关键点组成,用来描述物体的边。
–关键点是三维空间的位置,用来描述物体的顶点。
·在实体模型间有一个内在层次关系,关键点是实体的基础,线由点生成,面由线生成,体由面生成。
·这个层次的顺序与模型怎样建立无关。

ANSYS 后处理中壳单元Nodal solu ,Element solu ,Element table 应力结果辨析以及某些结构显示壳厚度后结果有所不同的原因小范(fanhjhj@ )常看到论坛上有人问“ANSYS 各种结果(Nodal solu ,Element solu ,Element table )有何区别?显示壳厚度后结果大有不同,是什么原因?”等问题,网友的回答又大都不完善。
通过参考台湾成功大学李辉煌老师所著的《ANSYS 工程分析基础与观念》一书,并与Dr.Q Z Jin 讨论,现将这个问题总结一下。
从某一计算模型中取出4个shell63单元的结果进行说明 19535 195731955419536980419574195559803 9802MNMXtank_container_modify323313623140131440324793251832557335963363534SEQV (AVG)DMX =.00403SMN =32331SMX =6743419535 19573195549804195361957498029803 19555MNMXtank_container_modify3623140131440324793251832557335963363534NODAL SOLUTION SEQV (AVG)(a ) (b )图1 节点解(表面)云图19535 19573195541953698041957419555 98039802MNMXtank_container_modify323313648840646448044896253120572776143565593ELEMENT SOLUTION SEQV (NOAVG)DMX =.00403SMN =32331SMX =6975119535 1957319554980419536195749802980319555 MNMXtank_container_modify323313648840646448044896253120572776143565593ELEMENT SOLUTION SEQV (NOAVG)(a ) (b )图2 单元解(表面)云图有限元分析的DOF 的数值解(亦即displacement fields )在空间上虽然是连续的,但是并不一定是平滑的(有尖点);事实上是:在单元的内部,这些displacement fields 是连续且平滑的(因为是由形函数所描述),但是跨过单元的边界时,则通常是连续但不平滑的(形函数并不跨越单元边界);所以整体空间而言,displacement fields 是连续但不平滑的,在数学上我们称之为“片段平滑”函数(piece-wise smooth functions )。
ANSYS后处理中应力查看总结-------------------------------------------------------------------------------------------------------SX:X-Component of stress;SY:Y-Component of stress;SZ:Z-Component of stress,X,Y,Z轴方向应力SXY:XY Shear stress;SYZ:YZ Shear stress;,SXZ:XZ Shear stress,X,Y,Z三个方向的剪应力。
S1:1st Principal stress;S2:2st Principal stress;,S3:3st Principal stress 第一、二、三主应力。
区分:首先把一个微元看成是一个正方体,那么假设三个主应力分别是F1 F2 F3,那么如果三个力中哪个力最大,就是F1,也是最大主应力,也叫第一主应力,第二大的叫第二主应力,最小的叫第三主应力,因此,是根据大小来定的。
SINT:stress intensity(应力强度),是由第三强度理论得到的当量应力,其值为第一主应力减去第三主应力。
SEVQ:Von Mises是一种屈服准则,屈服准则的值我们通常叫等效应力。
Ansys后处理中'Von Mises Stress'我们习惯称Mises等效应力,它遵循材料力学第四强度理论(形状改变比能理论)。
我们分析后查看应力,目的就是在于确定该结构的承载能力是否足够。
那么承载能力是如何定义的呢?比如混凝土、钢材,应该就是用万能压力机进行的单轴破坏试验吧。
也就是说,我们在ANSYS计算中得到的应力,总是要和单轴破坏试验得到的结果进行比对的。
所以,当有限元模型本身是一维或二维结构时,通过查看某一个方向,如plnsol,s,x等,是有意义的。
但三维实体结构中,应力分布要复杂得多,不能仅用单一方向上的应力来代表结构此处的确切应力值——于是就出现了强度理论学说。
ANSYS 后处理中壳单元Nodal solu ,Element solu ,Element table 应力结果辨析以及某些结构显示壳厚度后结果有所不同的原因小范(fanhjhj@ )常看到论坛上有人问“ANSYS 各种结果(Nodal solu ,Element solu ,Element table )有何区别?显示壳厚度后结果大有不同,是什么原因?”等问题,网友的回答又大都不完善。
通过参考台湾成功大学李辉煌老师所著的《ANSYS 工程分析基础与观念》一书,并与Dr.Q Z Jin 讨论,现将这个问题总结一下。
从某一计算模型中取出4个shell63单元的结果进行说明 19535 195731955419536980419574195559803 9802MNMXtank_container_modify323313623140131440324793251832557335963363534SEQV (AVG)DMX =.00403SMN =32331SMX =6743419535 19573195549804195361957498029803 19555MNMXtank_container_modify3623140131440324793251832557335963363534NODAL SOLUTION SEQV (AVG)(a ) (b )图1 节点解(表面)云图19535 19573195541953698041957419555 98039802MNMXtank_container_modify323313648840646448044896253120572776143565593ELEMENT SOLUTION SEQV (NOAVG)DMX =.00403SMN =32331SMX =6975119535 1957319554980419536195749802980319555 MNMXtank_container_modify323313648840646448044896253120572776143565593ELEMENT SOLUTION SEQV (NOAVG)(a ) (b )图2 单元解(表面)云图有限元分析的DOF 的数值解(亦即displacement fields )在空间上虽然是连续的,但是并不一定是平滑的(有尖点);事实上是:在单元的内部,这些displacement fields 是连续且平滑的(因为是由形函数所描述),但是跨过单元的边界时,则通常是连续但不平滑的(形函数并不跨越单元边界);所以整体空间而言,displacement fields 是连续但不平滑的,在数学上我们称之为“片段平滑”函数(piece-wise smooth functions )。
ansys读取某点应力和应力集中系数的问题2009-10-13 10:20提问者:我浩然哦|浏览次数:3086次热应力计算结束后后处理我想查看模型某点的热应力,该怎么操作?还有应力集中部位有多个但我想查看其中某个位置的应力集中系数可以查看吗?怎么操作?我来帮他解答精彩回答2009-10-13 22:33GUI操作:在General Postproc——Query Results——Subgrid Solu,选择你想显示的节点。
命令流:1. 最简单的办法是使用NSORT,打印出结果,可以通过控制使其输出到文件2. 使用apdl能复杂一点,下面是以前经常用的一段命令流,参考着修改一下吧*CREATE,GET_node_inf,mac,*GET,Nnod,NODE,0,COUNT !获取所选择的节点总数*DIM,S_Xyz,ARRAY,NNOD,5 !定义1个数组存放数据*GET,Nd,NODE,0,NUM,MIN !获取最小的节点编号*DO,I,1,Nnod,1S_Xyz(I,1)=Nd !将节点列表放数组第1列S_Xyz(I,2)=NX(Nd) !节点的X坐标放数组第2列S_Xyz(I,3)=NY(Nd) !节点的Y坐标放数组第3列S_Xyz(I,4)=NZ(Nd) !节点的Z坐标放数组第4列!*GET,S_Xyz(I,5),NODE,ND,S,EQV !节点的von mises值放数组第5列*GET,S_Xyz(I,5),NODE,ND,U,SUM !节点的总变形值值放数组第5列Nd=NDNEXT(Nd) !读出下一个节点编号*ENDDO*END*CREATE,OUT_node_inf,mac,*CFOPEN,node_info,txt,,*VWRITE,S_Xyz(1,1),S_Xyz(1,2),S_Xyz(1,3),S_Xyz(1,4),S_Xyz(1,5)(F10.0,3F15.4,E15.5)*CFCLOS*ENDGET_node_infOUT_node_inf/delete,GET_node_inf,mac/delete,OUT_node_inf,mac另附1.先对节点的值进行SORT,在提取最大的值即可。
ANSYS云图显示的最大应力与列表显示的不一样在 GUI 方式下,需要关闭 PowerGraph 选项,云图才能与 *get 或 List的结果一致。
如果打开PowerGraph 选项,得到的是表面单元的节点平均值,故不准确。
以下是ansys的PowerGraphics的帮助PowerGraphics的特性(Characteristics of PowerGraphics), Displays for large models are plotted at a much greater speed than with the Full Model method. , PowerGraphics plots quadratic (curved) surfaces for midside node elements. , This method can display discontinuous results due to material type and real constant discontinuities., Shell element results are displayed at both top and bottom layers, simultaneously. , You can use the Query picking option to query subgrid results for some elements in theGraphical User Interface., PowerGraphics is not available for circuit elements., When requested results data are not supported by PowerGraphics,the results are output usingthe Full Model method., Results averaging occurs using only the data at the model surface., Minimum and maximum values are valid only for data at the model surface., PowerGraphics supports only the results coordinate system for plotting results data. (Theelements-based coordinate system is not supported.)何时使用PowerGraph,(When to Use PowerGraphics)Using the PowerGraphics display method has distinct advantages, since graphics displays are plotted ata much faster rate of speed than with the Full Model method. In addition, PowerGraphics produces morerealistic results at material type and real constant discontinuities in the model.1和full model相比,显示速度快;2在模型的材料类型和实常数不连续时,得到更加真实的结果。
从PowerGraphics Plot中能得到什么结果,(What to Expect from a PowerGraphics Plot)Since PowerGraphics plots or listings are given for the exterior surface of the model, you can expect tosee differences in these results, compared to those given when using the Full Model method. Theaveraging calculations for PowerGraphics include results for only the model surface. The averagingcalculations, plots, and listings for the Full Model method include results for the entire model (interior andseriously, carefully setWeaving, preparing, serving, after implementation, efforts to improve conference quality and ensure itseffectiveness. Further improvement program the Chief reception, publicity, reception work as show, foreign exchange and to rally support for Windows guests a warm welcome, and establish a good image. 3,furtherexterior surfaces). Therefore, the PowerGraphics and Full Model methods display results values differently for nodal results (but notfor element results).PowerGraphics makes the EPLOT, APLOT, VPLOT, LPLOT, PLDISP, PLNSOL, and PRNSOLcommands behave differently than with the Full Model method. For details, see these commands' descriptions in the Commands Reference.10.5.1. Viewing Your Element ModelThe subgrid approach used by PowerGraphics allows you to control the amount of displayed element curvature. You can plot varying degrees of curvature in your model by specifying the number of facets to be usedfor element display. Facets are piecewise linear approximations of the actual curve represented by the element face or edge. You specify the number of facets per element edge using one of the following: Command(s): /EFACETMain Menu> General Postproc> Options for OutpGUI: Utility Menu> List> Results> OptionsUtility Menu> PlotCtrls> Style> Size and ShapeThe more facets you specify, the smoother the representation of the element surface for PowerGraphics plots.The subgrid approach affects both the display of geometric curvature and the display and printout of results quantities (displacements, stresses, etc.). However, when you use PowerGraphics in POST1 for derived quantities on solid elements, the maximum value on the plot and the maximum value in the printout may not agree. PowerGraphics displays do not average at geometric discontinuities. The printouts in PowerGraphics will, however, provide averaging information at geometric discontinuities if the models do not contain shell elements. Carefully inspect the data you obtain at geometricdiscontinuities.10.5.2. Printing and Plotting Node and Element ResultsYou can list displacements, stresses, and strains at all node locations (both corner and midside nodes), using the PRNSOL command (Utility Menu> List> Results> Nodal Solution). For shell elements, you can list results and plot them at the top/bottom and middle layer locations. Likewise, these nodal valuescan be contoured for display purposes using the PLNSOL command (Utility Menu> Plot> Results>Contour Plot> Nodal Solution). The number of facets per element edge that you specify determines contour resolutions.Note that results values for shell elements are displayed simultaneously for the top and bottom layers.When viewing nodal results using PowerGraphics (PRNSOL, PLNSOL, or the GUI Query function), youcan average results in various ways. To choose how results are averaged, use the AVRES command(Main Menu> General Postproc> Options for Outp or Utility Menu>List> Results> Options).(AVRES has no effect on the Degree of Freedom solution values (UX, UY, TEMP, etc.). You can average results at all boundaries (default), or at all boundaries except where real constant and/or material discontinuities exist. Results are not averaged at geometric discontinuities.Noteseriously, carefully setWeaving, preparing, serving, after implementation, efforts to improve conference quality and ensure its effectiveness. Further improvement program the Chief reception, publicity, reception work as show, foreign exchange and to rally support for Windows guests a warm welcome, and establish a good image. 3,furtherIn Full Graphics mode, it is possible to deselect an individual node, select all elements (including the element that contains that node), and then perform postprocessing calculations on those elements and have that unselected node not be considered in those calculations. However, if PowerGraphics is activepostprocessing always displays based on selected elements.The minimum and maximum results values reported for your PowerGraphics plot will be based on the surface data. For stresses and strains, these values will usually be acceptable. Some thermal results, however, will have internal minimum or maximum values, and erroneous values will be reported. You may need to switch to full model graphics.Plotting and printing of element results are similar to that for the Full Model graphics method; you use the PLESOL or PRESOL command, or one of the following GUI paths:PLESOL, Command(s): PRESOLMain Menu> General Postproc> Plot Results> Contour Plot> ElementSoluUtility Menu> Plot> Results> Contour Plot> Elem Solution GUI: Main Menu> General Postproc> List Results> Element SolutionUtility Menu> List> Results> Element SolutionThe program unaverages nodal results and sorts them by element number. Averaging results does not affect element results plots. Results are for all nodal locations on the model surface. If you issued the/EFACET,1 command, the results for the midside nodes are not listed.PowerGraphics does not support safety factor calculations.CautionIn unusual cases, your model may contain element types having different results data sets. If so, be sure to unselect those element types which do not have the data set you are reviewing. This prevents zero values from being averaged with valid results. For example, if yourmodel contains FLUID30 (Acoustic Fluid) and SOLID45 (Structural Solid) elements, unselect all SOLID45 elements before viewing a pressure gradient.seriously, carefully setWeaving, preparing, serving, after implementation, efforts to improve conference quality and ensure its effectiveness. Further improvement program the Chief reception, publicity, reception work as show, foreign exchange and to rally support for Windows guests a warm welcome, and establish a good image. 3,further。