联信永益:2010年第一季度报告全文 2010-04-28
- 格式:pdf
- 大小:140.43 KB
- 文档页数:9

国家邮政局关于2010年一季度邮政行业经济运行情况的通报正文:---------------------------------------------------------------------------------------------------------------------------------------------------- 国家邮政局关于2010年一季度邮政行业经济运行情况的通报(2010年)今年一季度,邮政行业在去年初步化解国际金融危机影响的基础上,继续按照“保增长、扩需求、调结构、重服务”的总体思路,全行业平稳较快的发展形势进一步巩固。
其中,快递恢复性增长势头明显,量收同比增幅均超过20%。
一、行业运行基本情况(一)行业总体恢复平稳较快发展一季度,全行业业务收入累计完成271.6亿元(不包括邮政储蓄银行直接营业收入),同比增长4.6%;业务总量累计完成439.6亿元,同比增长20.1%。
其中,规模以上快递企业累计完成业务收入124亿元,同比增长23.7%。
2009年、2010年一季度邮政行业整体情况比较指标名称单位2009年一季度2010年一季度累计完成同比增长累计完成同比增长邮政行业业务收入亿元259.66.9%271.64.6%其中:快递业务收入亿元100.23.4%124.023.7%邮政行业业务总量亿元366.210.8%439.620.1%(二)普遍服务业务发展情况函件业务量累计完成17.4亿件,同比下降4.8%。
包裹业务量累计完成1617万件,同比下降6.6%。
订销报纸和汇兑分别完成41.8亿份和6177万笔,同比增长6.2%和1.7%。
订销杂志累计完成2.5亿份,同比下降0.1%。
(三)快递业务恢复快速发展态势一季度,快递业务整体呈现快速增长态势。
规模以上快递企业累计完成快递业务量4.7亿件,同比增长24.3 %;实现快递业务收入124亿元,同比增长23.7%。

SHENZHEN SEG CO., LTD.The First Quarterly Report 2010 (Full Text)§1. Important Notes1.1 The Board of Directors and Supervisory Committee of Shenzhen SEG Co., Ltd. (hereinafter referred to as the Company) and its directors, supervisors and senior executives confirm hereby that there are no any fictitious statements, misleading statements, or important omissions carried in this report, and shall take all the responsibilities, individual and/or joint, for the reality, accuracy and completeness of the whole contents.1.2 The First Quarterly Financial Report of 2010 has not been audited by CPAs.1.3 Zhang Weimin, Principal of the Company, Li Lifu, Person in Charge of Accounting Affairs and Ying Huadong, Person in Charge of Accounting Organ (Accounting Supervisor) hereby confirm that the Financial Report of the First Quarterly Report is true and complete.§2. Company Profile2.1 Main accounting data and financial indexes:Unit: RMBAt the end of reportperiod At the period-end oflast yearChanges ofincrease/decrease (%)Total assets (RMB) 1,381,542,466.011,359,490,387.43 1.62% Owners’ equity attributable toshareholders of listed company (RMB)1,044,336,545.891,015,659,488.47 2.82% Share capital (Share) 784,799,010.00784,799,010.00 0.00% Net asset per share attributable toshareholders of listed company(RMB/Share)1.331 1.2942.86%In the report period The same period of lastyearChanges ofincrease/decrease (%)Total operating income (RMB) 91,307,818.0567,892,989.04 34.49% Net profit attributable to shareholders oflisted company (RMB)15,759,677.99-88,214,473.65 -117.87% Net cash flow arising from operatingactivities (RMB)17,840,734.0613,913,598.52 28.23% Net cash flow arising from operatingactivities per share (RMB/Share)0.02270.0177 28.25% Basic earnings per share (RMB/Share) 0.0201-0.1124 -117.87% Diluted earnings per share (RMB/Share) 0.0201-0.1124 -117.87% Weighted average return on equity (%) 1.53%-6.79% 8.32% Weighted average return on equity afterdeducting non-recurring gains and losses(%)1.53%-7.08% 8.61%Items of non-recurring gains and lossesAmount from year-beginning to the end of report periodOther non-operating income and expenditure except for the aforementioned items 97,850.12 Influenced amount of income tax -21,527.03Influenced amount of minority shareholders’ equity -31,864.37Total 44,458.72 Explanations of items of significant non-recurring gains and losses1. Other non-operating income and expenditure except for the aforementioned items:mainly the damages for breach of contract received by the Company;2. Influenced amount of income tax: the influenced amount of deductible income tax increased due to the profit increase because of the aforementioned item;;3. Influenced amount of minority shareholders’ equity: this item increased due to the increase of the aforementioned No.1 item of controlling subsidiary of the Company.2.2 Total number of shareholders at the end of the report period and shares held by the top ten shareholders without restricted conditionsUnit: Share Total number of shareholdersat the end of report period59,152Particulars about the shares held by the top ten tradable shareholders without restricted conditionsFull name of shareholder Amount of tradable shares withoutrestricted conditions held at the endof report periodType of sharesSHENZHEN SEG GROUP CO., LTD. 237,359,666 RMB ordinary shares GUANGZHOU FODAK ENTERPRISEGROUP CO., LTD.18,880,334 RMB ordinary shares Yang Zhihui 12,582,734 RMB ordinary shares Taifook Securities CompanyLimited-Account Client5,758,103 Domestically listed foreign shares Gong Qianhua 5,560,967 Domestically listed foreign shares Zeng Ying 4,280,048 Domestically listed foreign shares Zhu Wei 4,066,739 RMB ordinary shares Tang Lizhu 3,796,200 RMB ordinary shares SHANGHAI QILE ECONOMIC ANDTRADE CO., LTD.2,754,330 RMB ordinary shares Cao Xianhua 2,702,000RMB ordinary shares§3. Significant Events3.1 Particulars about material changes in items of main accounting statement and financial index, and explanations of reasons√Applicable □InapplicableI. Balance sheet itemItem Mar. 31, 2010 Dec. 31, 2009 Balance Proportion ofchanges % Inventory 1,919,437.27 5,886,392.39 -3,966,955.12 -67.39% Construction in progress 9,776,526.68 26,192,075.55 -16,415,548.87 -62.67% Staff salaries payable 1,172,559.95 4,261,476.99 -3,088,917.04 -72.48% 1. Inventory: decreased by RMB 3.97 million with a fall of 67.39% over the end of last year, which was mainly because the inventories of the Company decreased in the report period.2. Construction in progress: decreased by RMB 16.42 million with a fall of 62.67% over the end of last year. Its reason was that the construction in progress of the subsidiary Changsha SEG Development Co., Ltd. (hereinafter referred to as Changsha SEG) was completed and thentransferred into fixed assets in the report period.3. Staff salaries payable: decreased by RMB 3.09 million with a fall of 72.48% over the end of last year. Its reason was that the Company paid the staff for salaries in the report period.II. Income statement itemItem Amount in thisperiodAmount in thesame period oflast yearBalanceProportion ofchanges %Operating income 91,307,818.0567,892,989.0423,414,829.01 34.49% Operating cost 56,496,489.2231,746,485.6924,750,003.53 77.96% Operating tax and extras 3,724,614.303,012,887.52711,726.78 23.62% Sales expense 1,370,260.25906,378.64463,881.61 51.18% Losses from devaluation ofassets--1,500,000.001,500,000.00 -100.00% Investment gains -3,029,152.47-115,823,698.14112,794,545.67 -97.38% Operating profit 23,529,850.53-85,166,016.78108,695,867.31 -127.63% Non-operating income 139,079.301,620,912.10-1,481,832.80 -91.42% Non-operating expenditure 41,229.18100,985.93-59,756.75 -59.17% Total profits 23,627,700.65-83,646,090.61107,273,791.26 -128.25% Income tax expense 5,951,587.042,313,487.223,638,099.82 157.26% Net profit 17,676,113.61-85,959,577.83103,635,691.44 -120.56% Net profit attributable toowners of parent company15,759,677.99-88,214,473.65103,974,151.64 -117.87% Basic earnings per share 0.0201-0.11240.1325 -117.87% Diluted earnings per share 0.0201-0.11240.1325 -117.87% Other consolidated income 12,964,835.24-574,782.6813,539,617.92 -2355.61% Total consolidated income 30,640,948.85-86,534,360.52117,175,309.37 -135.41% Total consolidated incomeattributable to owners ofparent company28,677,057.42-88,896,727.63117,573,785.05 -132.26% 1. Operating income: increased by RMB 23.41 million with an increase of 34.49% over the same period of last year. The main reasons were i. In the report period, Changsha SEG and Changsha Hotel of Shenzhen Mellow Orange Business Hotel Management Co., Ltd. (hereinafter referred to as Mellow Orange Hotel) started operation which increased the operating income of the Company; ii. Income from Buy-it Store increased compared with the same period of last year.2. Operating cost: increased by RMB 24.75 million with an increase of 77.96% over the same period of last year. The main reason was the increase of operating income caused the increase of operating cost accordingly.3. Operating tax and extras: increased by RMB 710,000 with an increase of 23.62% over the same period of last year. The main reason was the increase of operating income caused the increase ofoperating tax and extras accordingly.4. Sales expense: increased by RMB 460,000 with an increase of 51.18% over the same period of last year. The main reason was the increase of operating income caused the increase of sales expense accordingly.5. Losses from devaluation of assets: no losses from devaluation of assets occurred in the report period, whereas that was RMB -1.5 million in the same period of last year. The main reasons was part of account receivable which had been withdrawn losses of bad debts in the same period of last year was taken back through lawsuit.6. Investment gains: increased by RMB 112.79 million over the same period of last year. The main reason was the losses of Shenzhen SEG Samsung Co., Ltd. (hereinafter referred to as SEG Samsung) in which the Company holds 22.45% of its equity decreased in the report period over the same period of last year.7. Operating profit: increased largely over the same period of last year. The main reasons were the losses of SEG Samsung in which the Company holds 22.45% of its equity decreased in the report period over the same period of last year causing a large decrease in investment losses.8. Non-operating income: decreased by RMB 1.48 million with a decrease of 91.42% over the same period of last year. The main reasons were the Company switched back the account payable which it did not need to pay in the same period of last year, but no such switch-back occurred in the report period.9. Total profits: increased largely over the same period of last year. The main reason was the same as that of Item 7.10. Income tax expense: increased by RMB 3.64 million with an increase of 157.26% over the same period of last year. The main reason was the profit payable of this report year went up and income tax rate of this report year in Shenzhen also grew.11. Net profit: increased largely over the same period of last year. The main reason was the same as that of Item 7.12. Net profit attributable to owners of parent company: increased largely over the same period of last year. The main reason was the same as that of Item 7.13. Basic earnings per share: increased largely over the same period of last year. The main reasons were the same with Item 7.14. Diluted earnings per share: increased largely over the same period of last year. The main reason was the same as that of Item 7.15. Other consolidated income: increased by RMB 13.54 million largely over the same period of last year. The main reason was in the report period, SEG Samsung in which the Company holds 22.45% of its equity received the financial support funds amounting to RMB 56 million from its shareholder Samsung Corning Investment Co., Ltd., thus RMB 12.57 million was added into other consolidated income of the Company.16. Total consolidated income: increased largely over the same period of last year. The main reasons were the same as that of Items 7 and 15.17. Total consolidated income attributable to owners of parent company: increased largely over the same period of last year. The main reason was the same as that of Items 7 and 15.III. Cash flow statement itemItem Amount in thisperiodAmount in thesame period oflast yearBalanceProportion ofchanges %Other cash receivedrelating to operating activities64,583,939.9735,621,486.0928,962,453.88 81.31% Cash paid to/for staff andworkers11,883,672.359,605,770.002,277,902.35 23.71%Other cash paid relating to53,590,151.5031,135,749.7322,454,401.77 72.12% operating activitiesCash received from0.002,198,720.24-2,198,720.24 -100.00% recovering investmentNet cash received from15,444.00141,500.00-126,056.00 -89.09% disposal of fixed, intangible andother long-term assetsNet cash received from disposal0.0034,229,363.41-34,229,363.41 -100.00% of subsidiaries and other unitsCash paid for purchasing fixed,4,591,584.05701,547.003,890,037.05 554.49% intangible and other long-termassetsCash paid for investment 0.0053,030,000.00-53,030,000.00 -100.00% 1. Other cash received relating to operating activities: increased by RMB 28.96 million with an increase of 81.31% over the same period of last year. The main reasons were i. items of newly-opened Changsha SEG and Mellow Orange Hotel in the report period and newly-increased Buy-it Store in last May increased; ii. The general cashing business was developed in the electronic market, so the goods payment received on behalf of merchants increased.2. Cash paid to/for staff and workers: increased by RMB 2.28 million with an increase of 23.71% over the same period of last year. The main reasons were in the report period, Changsha SEG and Mellow Orange Hotel started operations, and the staff in Buy-it Store added increasing the salaries payable to the staff of the three companies.3. Other cash paid relating to operating activities: increased by RMB 22.45 million with an increase of 72.12% over the same period of last year. The main reasons were i. items of Changsha SEG and Mellow Orange Hotel newly-opened in the report period and Buy-it Store newly-increased last year increased; ii. The general cashing business was developed in the electronic market, the goods payment returning to merchants increased.4. Cash received from recovering investment: decreased by RMB 2.2million over the same period of last year. The main reason was in the same period of last year, the Company reduced the shares of Shenzhen Zero-Seven Co., Ltd. held by the Company amounting to 530,000, but no such sales occurred in the report period.5. Net cash received from disposal of fixed, intangible and other long-term assets: decreased by RMB 130,000 with a decrease of 89.09% over the same period of last year. The main reasons was the amount of fixed assets disposal in the same period of last year was bigger.6. Net cash received from disposal of subsidiaries and other units: decreased by RMB 34.23 million over the same period of last year. The main reasons was in the same period of last year, the Company received the equity account on selling former subsidiaries Shenzhen SEG Communications Co., Ltd, but no such sales of subsidiary occurred in the report period.7. Cash paid for purchasing fixed, intangible and other long-term assets: increased by RMB 3.89 million with an increase of 554.49% over the same period of last year. The main reasons were: the newly-opened Changsha SEG and Mellow Orange Hotel purchased fixed assets in the report period, thus the item increased.8. Cash paid for investment: decreased by RMB 55.03 million over the same period of last year. The main reason was in the same period of last year, the Company purchased 46 percent of the equity of Changsha SEG, but no such expenditure of equity acquisition occurred in the report period.3.2 Analysis and explanation of significant events and their influence and solutions□Applicable √Inapplicable3.3 Implementations of commitments by the Company, shareholders and actual controller√Applicable □InapplicableItem of CommitmentsPromiseeContent of commitmentsImplementationCommitments on Share Merger ReformInapplicable ----Commitments on share restricted tradeInapplicable ----Commitments made in Acquisition Report or Reports on Change in EquityInapplicable ----Commitments made in MaterialAssets ReorganizationInapplicable----Commitments made in issuanceShenzhen SEG Group Co., Ltd. Article 5 of the Equity Transfer Agreement which the Company had signed with SEG Group at the time of the Company’s listing stipulated: SEG Group permits the Company, as well as its subsidiaries of theCompany and affiliated companies to use the 8 registered trademarks that SEG Group has presently registered at the StateTrademark Office; italso permits theCompany to take the aforesaid trademarks and symbols that are similar to these marks as the symbol of the Company, as well as to use the aforesaid symbols or symbols that are similar to these symbols during the operation process; the Company doesn’t have to pay SEG Group any fee for the use of the aforesaidtrademarks or symbols.In the report period, this commitmentwas still executed according to thecommitment.Other commitments (includingadditional commitments)Shenzhen SEG Group Co., Ltd. According to the problem of “Yourcompany’s existing same industry competition in theelectronic market business with SEGIn the report period, controllingshareholder abided by the above commitment.Group” pointed outby Shenzhen Securities Regulatory Bureau in 2007 at the spot investigation of the Company, the Company received written Commitment Letter from SEG Group on Sep.14, 2007 and the content was as follows: our Group has similar business in Shenzhen electronic market with Shenzhen SEG Co., Ltd. (Shenzhen SEG), and the business was resulted by history and it has objective market developmentbackground. The Group made commitment: For the future, we do not operate on the market which is similar to Shenzhen SEG singly in the same city. The aforesaid matters have been disclosed in Securities Times ,China Securities Journal and Hong Kong Wen Wei Po and Juchao Website dated Sep. 18, 2007. In the report period, the holding company observed the above commitment.3.4 Estimation of accumulative net profit from the beginning of the year to the end of next report period to be a loss probably or the warning of its material change compared with the same period of last year and explanation of its reason √Applicable □InapplicableFore-notice of performances Carry-back of lossesYear-beginning to the end of next report period The same period oflast yearChange of increase/decrease (%)Estimated amount ofaccumulative net profit(RMB’0000)Approximately 1,600.00to2,700.00-14,608.35 -- -- Basic earnings per share(RMB/Share)Approximately 0.0204 to -0.1861 -- --0.0344Explanations onfore-notice ofperformances(1) SEG Samsung in which the Company holds its equity is predicted to suffer aloss accumulatively from RMB 30 million to RMB 50 million from year-beginning toend of next report period;(2) The performance prediction has not been pre-audited by CPAs.3.5 Other significant events which need explanations3.5.1 Particulars about securities investment □Applicable √Inapplicable3.5.2 Registration form of receiving research, communication and interview in the report periodDate Place Way ObjectsDiscussed main contents andsupplied materials Jan. 6, 2010 Office of the Company Telephone communication Investors Basic information of theCompany Feb. 12, 2010 Office of the Company Telephone communication Holder of B share Basic information of theCompany Mar. 26, 2010 Office of the Company Telephone communication Holder of B share Basic information of theCompany Apr. 7, 2010Office of the CompanyEnquire in written formSecurities DailyGot to know relevant public information of the Company3.5.3 Explanations of other significant events √Applicable □InapplicableThe net profit attributable to owners of parent company disclosed in the 1st quarterly report 2009 was RMB 2.85 million, but that of the same period of last year disclosed in the report was RMB -88.21 million, with the change amount of RMB -91.06 million. The reason for such change was the net profit attributable to owners of parent company of SEG Samsung in which the Company holds 22.45% of its equity disclosed in the 1st quarterly report 2009 was RMB-122 million, whereas that of the same period of last year disclosed in 1st quarterly report 2010 was RMB -504 million. The Company calculated the investment gains from SEG Samsung based on equity method, which caused the investment losses of the same period of last year disclosed in this report of the Company increased by RMB 91.06 million over that disclosed in the 1st quarterly report of 2009.3.6 Particulars about derivatives investment □Applicable √Inapplicable3.6.1 Particulars about derivatives investment held at the end of report period □Applicable √Inapplicable§4. Appendix4.1 Balance sheetPrepared by Shenzhen SEG Co., Ltd. March 31, 2010 Unit: RMBBalance at period-end Balance at year-beginning Items Consolidation Parent Company Consolidation Parent Company Current assets:Monetary funds 498,955,096.86372,852,381.52485,135,270.94 375,350,393.53 SettlementprovisionslentCapitalTransactionassetfinancereceivableNotesAccounts receivable 17,234,225.88400,000.0018,130,631.40 1,134,357.47 Accounts paid in advance 20,037,842.341,081,095.0018,404,268.08 8,035,295.00 receivableInsurancereceivablesReinsuranceContract reserve ofreinsurance receivableInterest receivable 2,460,821.922,460,821.922,460,821.92 2,460,821.92Dividend receivableOther receivables 12,042,162.4945,095,461.3911,971,998.74 45,306,466.00 Purchase restituted financeassetInventories 1,919,437.275,886,392.39 Non-current asset duewithin one yearassetsOthercurrentTotal current assets 552,649,586.76421,889,759.83541,989,383.47 432,287,333.92 Non-current assets:Granted loans and advancesFinance asset available for4,229,970.093,548,500.003,843,571.87 3,304,100.00 salesHeld-to-maturityinvestmentLong-term accountreceivableLong-term equity129,274,947.39310,372,446.43119,732,099.86 300,829,598.90 investmentInvestment property 438,740,452.42345,143,558.87442,502,999.44 347,797,315.91 Fixed assets 210,589,972.7523,031,843.38189,516,718.30 23,314,450.93 Construction in progress 9,776,526.6826,192,075.55materialEngineeringDisposal of fixed assetassetbiologicalProductiveOil and gas assetIntangible assets 4,681,177.38610,581.394,756,432.31 651,865.38 Expense on Research andDevelopmentGoodwill 10,328,927.8210,328,927.82Long-term expenses to be 13,684,505.73961,414.0213,041,779.82 1,165,451.06apportionedDeferred income tax asset 7,586,398.995,994,015.937,586,398.99 5,994,015.93 assetnon-currentOtherTotal non-current asset 828,892,879.25689,662,360.02817,501,003.96 683,056,798.11 Total assets 1,381,542,466.011,111,552,119.851,359,490,387.43 1,115,344,132.03 Current liabilities:Short-termloansLoan from central bankAbsorbing deposit andinter-bank depositborrowedCapitalTransaction financialliabilitiespayableNotesAccounts payable 7,716,840.382,149,017.128,225,509.02 2,178,169.12Accounts received in90,214,246.1242,701,579.41105,563,890.39 65,801,272.52 advanceSelling financial asset ofrepurchaseCommission charge andcommission payableWage payable 1,172,559.9524,450.874,261,476.99 2,065,724.98 Taxes payable 26,095,556.9526,470,386.0424,421,758.66 24,773,634.49 payableInterestDividend payable 921,420.73153,403.29921,420.73 153,403.29 Other accounts payable 95,328,850.9637,415,008.7786,454,289.91 41,932,495.62 payablesReinsuranceInsurance contract reserveagencySecurity trading ofSecurity sales of agencyNon-current liabilities duewithin 1 yearliabilitiescurrentOtherTotal current liabilities 221,449,475.09108,913,845.50229,848,345.70 136,904,700.02 Non-current liabilities:loansLong-termpayableBondspayableLong-termaccountSpecial accounts payableliabilitiesProjectedDeferred income tax liabilities 22,970,034.63547,125.7123,160,034.29 547,125.71 non-currentliabilitiesOtherTotal non-current liabilities 22,970,034.63547,125.7123,160,034.29 547,125.71 Total liabilities 244,419,509.72109,460,971.21253,008,379.99 137,451,825.73 Owner’s equity (or shareholders’equity):Paid-in capital (or sharecapital)784,799,010.00784,799,010.00784,799,010.00 784,799,010.00 Capital public reserve 409,833,425.36407,164,608.41396,922,482.95 394,348,208.41 Less: Treasury stocksReasonable reserveSurplus public reserve 102,912,835.67102,912,835.67102,912,835.67 102,912,835.67 Provision of general riskRetained profit -252,672,245.53-292,785,305.44-268,431,923.52 -304,167,747.78 Balance difference offoreign currency translation-536,479.61-542,916.63Total owner’s equity attributableto parent company1,044,336,545.891,002,091,148.641,015,659,488.47 977,892,306.30 Minority shareholders’ interests 92,786,410.4090,822,518.97Total owner’s equity 1,137,122,956.291,002,091,148.641,106,482,007.44 977,892,306.30 Total liabilities and owner’sequity1,381,542,466.011,111,552,119.851,359,490,387.43 1,115,344,132.03 4.2 Profit statementPrepared by Shenzhen SEG Co., Ltd. Jan.-Mar. 2010 Unit: RMBAmount in this period Amount in last period ItemsConsolidation Parent Company Consolidation Parent Company I. Total operating income 91,307,818.0528,545,784.8967,892,989.04 28,312,781.50 Including: Operating income 91,307,818.0528,545,784.8967,892,989.04 28,312,781.50 InterestincomeInsurancegainedCommission charge andcommission incomeII. Total operating cost 64,748,815.0510,069,765.9037,235,307.68 6,271,611.87 Including: Operating cost 56,496,489.228,821,226.1931,746,485.69 6,224,508.93 InterestexpenseCommission charge andcommission expenseCash surrender valueNet amount of expense ofcompensationNet amount of withdrawalof insurance contract reserveBonus expense of guaranteeslipReinsuranceexpenseOperating tax and extras 3,724,614.301,652,232.843,012,887.52 1,426,154.86 Sales expenses 1,370,260.25906,378.64Administration expenses 6,914,893.783,749,113.976,753,654.36 3,527,096.41 Financial expenses -3,757,442.50-4,152,807.10-3,684,098.53 -3,406,148.33Losses of devaluation of asset -1,500,000.00-1,500,000.00Add: Changing income offair value (Loss is listed with“-”)Investment income (Loss is-3,029,152.47-3,029,152.47-115,823,698.14 -115,823,699.14 listed with “-”)Including: Investmentincome on affiliated companyand joint ventureExchange income (Loss islisted with “-”)III. Operating profit (Loss is23,529,850.5315,446,866.52-85,166,016.78 -93,782,529.51 listed with “-”)Add: Non-operating income 139,079.30300.001,620,912.10 1,486,477.57Less: Non-operating41,229.18100,985.93expenseIncluding: Disposal loss ofnon-current assetIV. Total Profit (Loss is listed23,627,700.6515,447,166.52-83,646,090.61 -92,296,051.94 with “-”)Less: Income tax 5,951,587.044,064,724.182,313,487.22 450,000.00V. Net profit (Net loss is listed17,676,113.6111,382,442.34-85,959,577.83 -92,746,051.94 with “-”)Net profit attributable to15,759,677.9911,382,442.34-88,214,473.65 -92,746,051.94 owner’s equity of parentcompanyMinority shareholders’ gains1,916,435.622,254,895.82and lossesVI. Earnings per sharei. Basic earnings per share 0.02010.0145-0.1124 -0.1182 ii. Diluted earnings per share 0.02010.0145-0.1124 -0.1182 VII. Other consolidated income 12,964,835.2412,816,400.00-574,782.68 -682,253.97 VIII. Total consolidated income 30,640,948.8524,198,842.34-86,534,360.51 -93,428,305.91 Total consolidated income28,677,057.4224,198,842.34-88,896,727.62 -93,428,305.91 attributable to owners of parentcompanyTotal consolidated income1,963,891.432,362,367.11attributable to minorityshareholders4.3 Cash flow statementPrepared by Shenzhen SEG Co., Ltd. Jan.-Mar. 2010 Unit: RMBAmount in this period Amount in last period ItemsConsolidation Parent Company Consolidation Parent Company I. Cash flows arising fromoperating activities:Cash received from selling76,838,162.928,489,484.2877,509,335.13 16,793,838.47 commodities and providinglabor servicesNet increase of customerdeposit and inter-bank depositNet increase of loan fromcentral bankNet increase of capitalborrowed from other financialinstitutionCash received fromoriginal insurance contract feeNet cash received fromreinsurance businessNet increase of insuredsavings and investmentNet increase of disposal oftransaction financial assetCash received from interest,commission charge andcommissionNet increase of capitalborrowedNet increase of returnedbusiness capitalWrite-back of tax receivedOther cash receivedrelating to operating activities64,583,939.9735,796,951.0335,621,486.09 34,108,393.77 Subtotal of cash inflowarising from operating activities141,422,102.8944,286,435.31113,130,821.22 50,902,232.24 Cash paid for purchasingcommodities and receivinglabor service34,506,524.285,428,566.4833,515,780.98 4,689,090.60Net increase of customerloans and advancesNet increase of deposits incentral bank and inter-bankCash paid for originalinsurance contractcompensationCash paid for interest,commission charge andcommissionCash paid for bonus ofguarantee slipCash paid to/for staff andworkers11,883,672.355,234,585.349,605,770.00 4,602,269.51 Taxes paid 23,601,020.7018,545,462.2824,959,921.99 18,464,019.40 Other cash paid relating tooperating activities53,590,151.5017,876,799.3431,135,749.73 14,893,005.25Subtotal of cash outflowarising from operating activities123,581,368.8347,085,413.4499,217,222.70 42,648,384.76Net cash flows arisingfrom operating activities17,840,734.06-2,798,978.1313,913,598.52 8,253,847.48II. Cash flows arising frominvesting activities:Cash received from recovering investment 2,198,720.242,198,720.24Cash received frominvestment income5,270,590.49 Net cash received from 15,444.00141,500.00。
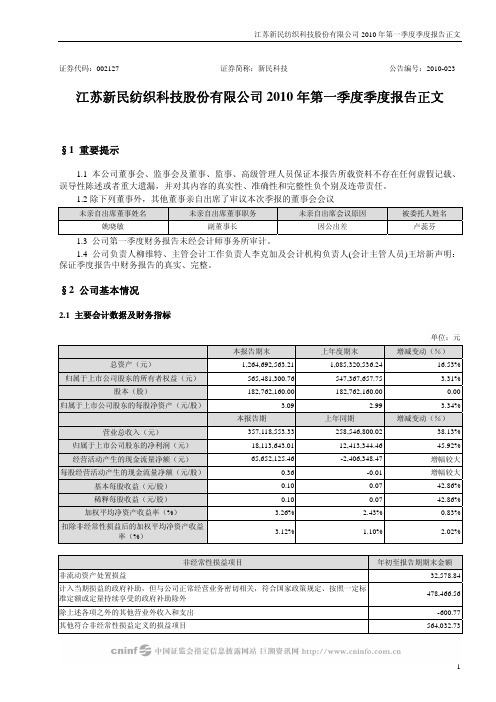
证券代码:002127 证券简称:新民科技公告编号:2010-023 江苏新民纺织科技股份有限公司2010年第一季度季度报告正文§1 重要提示1.1 本公司董事会、监事会及董事、监事、高级管理人员保证本报告所载资料不存在任何虚假记载、误导性陈述或者重大遗漏,并对其内容的真实性、准确性和完整性负个别及连带责任。
1.2除下列董事外,其他董事亲自出席了审议本次季报的董事会会议未亲自出席董事姓名未亲自出席董事职务未亲自出席会议原因被委托人姓名姚晓敏副董事长因公出差卢蕊芬1.3 公司第一季度财务报告未经会计师事务所审计。
1.4 公司负责人柳维特、主管会计工作负责人李克加及会计机构负责人(会计主管人员)王培新声明:保证季度报告中财务报告的真实、完整。
§2 公司基本情况2.1 主要会计数据及财务指标单位:元本报告期末上年度期末增减变动(%)总资产(元)1,264,692,563.211,085,320,536.24 16.53%归属于上市公司股东的所有者权益(元)565,481,300.76547,367,657.75 3.31%股本(股)182,762,160.00182,762,160.00 0.00归属于上市公司股东的每股净资产(元/股) 3.09 2.99 3.34%本报告期上年同期增减变动(%)营业总收入(元)357,118,553.33258,546,800.02 38.13%归属于上市公司股东的净利润(元)18,113,643.0112,413,344.46 45.92%经营活动产生的现金流量净额(元)65,652,125.46-2,406,348.47 增幅较大每股经营活动产生的现金流量净额(元/股)0.36-0.01 增幅较大基本每股收益(元/股)0.100.07 42.86%稀释每股收益(元/股)0.100.07 42.86%加权平均净资产收益率(%) 3.26% 2.43% 0.83%扣除非经常性损益后的加权平均净资产收益3.12% 1.10% 2.02%率(%)非经常性损益项目年初至报告期期末金额非流动资产处置损益32,578.84计入当期损益的政府补助,但与公司正常经营业务密切相关,符合国家政策规定、按照一定标478,466.56准定额或定量持续享受的政府补助除外除上述各项之外的其他营业外收入和支出-600.77其他符合非经常性损益定义的损益项目564,032.73所得税影响额-185,737.87少数股东权益影响额-120,564.74合计768,174.75对重要非经常性损益项目的说明公司报告期内其他符合非经常性损益定义的损益项目(汇兑损益)比上年同期减少94.00%,主要原因是由于人民币对日元汇率升值幅度低于去年同期,使控股子公司新民化纤及新民高纤为购买进口设备而产生的日元设备借款汇兑收益同比下降所致。
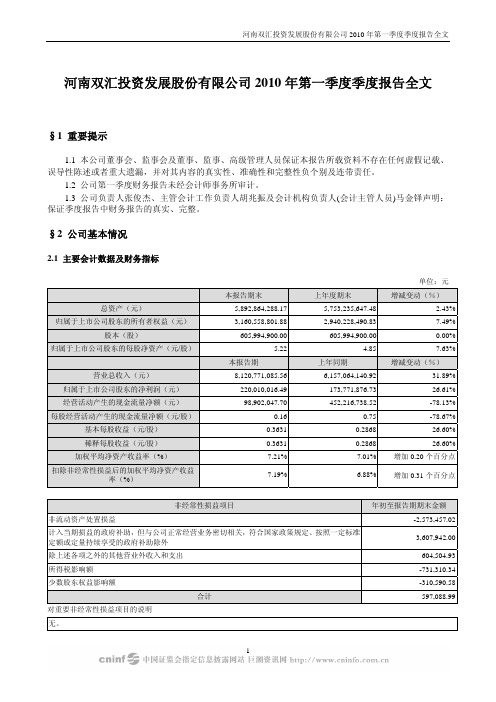
河南双汇投资发展股份有限公司2010年第一季度季度报告全文§1 重要提示1.1 本公司董事会、监事会及董事、监事、高级管理人员保证本报告所载资料不存在任何虚假记载、误导性陈述或者重大遗漏,并对其内容的真实性、准确性和完整性负个别及连带责任。
1.2 公司第一季度财务报告未经会计师事务所审计。
1.3 公司负责人张俊杰、主管会计工作负责人胡兆振及会计机构负责人(会计主管人员)马金铎声明:保证季度报告中财务报告的真实、完整。
§2 公司基本情况2.1 主要会计数据及财务指标单位:元本报告期末上年度期末增减变动(%)总资产(元)5,892,864,288.175,753,235,647.48 2.43%归属于上市公司股东的所有者权益(元)3,160,558,801.882,940,228,490.83 7.49%股本(股)605,994,900.00605,994,900.00 0.00%归属于上市公司股东的每股净资产(元/股) 5.22 4.85 7.63%本报告期上年同期增减变动(%)营业总收入(元)8,120,771,085.566,157,064,140.92 31.89%归属于上市公司股东的净利润(元)220,010,016.49173,771,876.73 26.61%经营活动产生的现金流量净额(元)98,902,047.70452,216,738.52 -78.13%每股经营活动产生的现金流量净额(元/股)0.160.75 -78.67%基本每股收益(元/股)0.36310.2868 26.60%稀释每股收益(元/股)0.36310.2868 26.60%加权平均净资产收益率(%)7.21%7.01% 增加0.20个百分点扣除非经常性损益后的加权平均净资产收益7.19% 6.88% 增加0.31个百分点率(%)非经常性损益项目年初至报告期期末金额非流动资产处置损益-2,573,457.02计入当期损益的政府补助,但与公司正常经营业务密切相关,符合国家政策规定、按照一定标准3,607,942.00定额或定量持续享受的政府补助除外除上述各项之外的其他营业外收入和支出604,504.93所得税影响额-731,310.34少数股东权益影响额-310,590.58合计597,088.99对重要非经常性损益项目的说明无。

中国银行股份有限公司 2010年第一季度报告(全文) (中国会计准则)中国银行股份有限公司2010年第一季度报告正文§1 重要提示1.1本行董事会、监事会及董事、监事、高级管理人员保证本报告所载资料不存在任何虚假记载、误导性陈述或者重大遗漏,并对其内容的真实性、准确性和完整性承担个别及连带责任。
1.2本行2010年4月27日董事会审议通过了本行《2010年第一季度报告》。
本行董事会会议应出席董事15名,实际亲自出席董事14名。
黄世忠独立董事委托梁定邦独立董事代为出席会议并表决。
1.3本行第一季度财务报告未经审计。
1.4本行董事长肖钢、行长李礼辉,主管会计工作的副行长周载群及会计机构负责人肖伟声明:保证本季度报告中财务报告的真实、完整。
1.5报告期内,本行不存在控股股东及其关联方非经营性占用资金的情况,不存在违反规定决策程序对外提供重大担保的情况。
§2 公司基本情况2.1 公司基本信息股票简称中国银行股票代码 601988(A股)上市证券交易所上海证券交易所股票简称中国银行股票代码 3988(H股)上市证券交易所香港联合交易所有限公司董事会秘书姓名张秉训联系地址中国北京市复兴门内大街1号,100818电话(86)10-66592638传真(86)10-66594568电子信箱bocir@2.2 主要会计数据及财务指标2.2.1基于中国会计准则编制的主要会计数据及财务指标单位:百万元人民币(另有说明者除外)项目2010年3月31日2009年12月31日本报告期末比上年度末增减(%)资产总计 9,721,6738,751,943 11.08归属于母公司所有者权益合计 541,960514,992 5.24每股净资产(人民币元) 2.14 2.03 5.24项目 2010年1-3月比上年同期增减(%)经营活动产生的现金流量净额 254,932 (21.54)每股经营活动产生的现金流量净额(人民币元)1.00 (21.54)项目 2010年1-3月2009年1-3月本报告期比上年同期增减(%)净利润 27,34619,286 41.79归属于母公司所有者的净利润 26,17518,509 41.42基本每股收益(人民币元) 0.100.07 41.42扣除非经常性损益后基本每股收益(人民币元)0.100.07 40.41稀释每股收益(人民币元) 0.100.07 41.42净资产收益率(%,年率,加权平均) 19.8115.53 上升4.28个百分点净资产收益率(%,年率,加权平均,扣除非经常性损益后)19.6015.48上升4.12个百分点非经常性损益项目列示如下:单位:百万元人民币项目 2010年1-3月固定资产处置损益 38投资性房地产处置损益36投资性房地产公允价值变动产生的损益293其他营业外收支191相应税项调整(101)少数股东损益(77)合计280注:1、其他营业外收支是指发生的与经营业务活动无直接关系的各项收入和支出,包括出纳长款收入、结算罚款收入、预计诉讼赔款、捐赠支出、行政罚没款项、出纳短款损失和非常损失等。
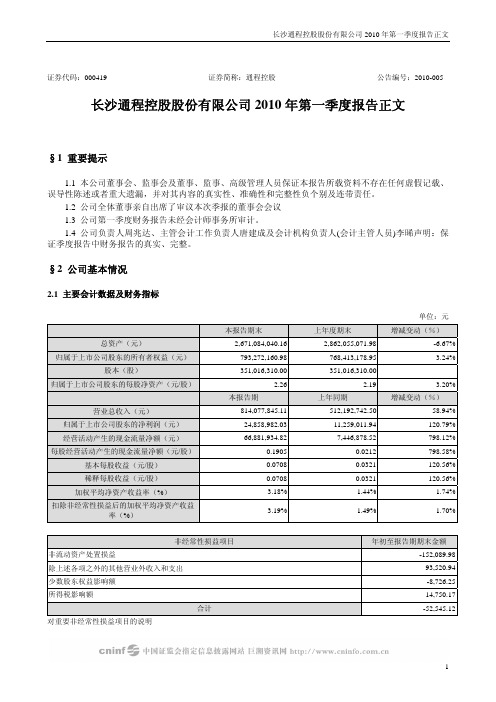
证券代码:000419 证券简称:通程控股公告编号:2010-005 长沙通程控股股份有限公司2010年第一季度报告正文§1 重要提示1.1 本公司董事会、监事会及董事、监事、高级管理人员保证本报告所载资料不存在任何虚假记载、误导性陈述或者重大遗漏,并对其内容的真实性、准确性和完整性负个别及连带责任。
1.2 公司全体董事亲自出席了审议本次季报的董事会会议1.3 公司第一季度财务报告未经会计师事务所审计。
1.4 公司负责人周兆达、主管会计工作负责人唐建成及会计机构负责人(会计主管人员)李晞声明:保证季度报告中财务报告的真实、完整。
§2 公司基本情况2.1 主要会计数据及财务指标单位:元本报告期末上年度期末增减变动(%)总资产(元)2,671,084,040.162,862,055,071.98 -6.67%归属于上市公司股东的所有者权益(元)793,272,160.98768,413,178.95 3.24%股本(股)351,016,310.00351,016,310.00归属于上市公司股东的每股净资产(元/股) 2.26 2.19 3.20%本报告期上年同期增减变动(%)营业总收入(元)814,077,845.11512,192,742.50 58.94%归属于上市公司股东的净利润(元)24,858,982.0311,259,011.94 120.79%经营活动产生的现金流量净额(元)66,881,934.827,446,878.52 798.12%每股经营活动产生的现金流量净额(元/股)0.19050.0212 798.58%基本每股收益(元/股)0.07080.0321 120.56%稀释每股收益(元/股)0.07080.0321 120.56%加权平均净资产收益率(%) 3.18% 1.44% 1.74%扣除非经常性损益后的加权平均净资产收益3.19% 1.49% 1.70%率(%)非经常性损益项目年初至报告期期末金额非流动资产处置损益-152,089.98除上述各项之外的其他营业外收入和支出93,520.94少数股东权益影响额-8,726.25所得税影响额14,750.17合计-52,545.12对重要非经常性损益项目的说明本年捐赠支出20万元。
证券代码:000758 证券简称:中色股份公告编号:2010-013 中国有色金属建设股份有限公司2010年第一季度季度报告正文§1 重要提示1.1 本公司董事会、监事会及董事、监事、高级管理人员保证本报告所载资料不存在任何虚假记载、误导性陈述或者重大遗漏,并对其内容的真实性、准确性和完整性负个别及连带责任。
1.2 公司第一季度财务报告未经会计师事务所审计。
1.3 公司负责人罗涛、主管会计工作负责人王宏前、财务总监宫新勇及会计机构负责人(会计主管人员)刘依斌声明:保证季度报告中财务报告的真实、完整。
§2 公司基本情况2.1 主要会计数据及财务指标单位:元本报告期末上年度期末增减变动(%)总资产(元)9,601,374,355.179,341,266,644.58 2.78%归属于上市公司股东的所有者权益(元)1,816,359,032.941,796,510,912.73 1.10%股本(股)638,880,000.00638,880,000.00 0.00%归属于上市公司股东的每股净资产(元/股) 2.84 2.81 1.07%本报告期上年同期增减变动(%)营业总收入(元)1,273,590,106.50850,776,591.21 49.70%归属于上市公司股东的净利润(元)13,226,148.5111,071,335.04 19.46%经营活动产生的现金流量净额(元)-169,864,824.9153,579,190.04 -417.04%每股经营活动产生的现金流量净额(元/股)-0.2660.084 -416.67%基本每股收益(元/股)0.0210.019 10.53%稀释每股收益(元/股)0.0210.019 10.53%加权平均净资产收益率(%)0.73%0.64% 0.09%扣除非经常性损益后的加权平均净资产收益率(%)0.76%-0.87% 1.63%非经常性损益项目年初至报告期期末金额非流动资产处置损益563,258.68除同公司正常经营业务相关的有效套期保值业务外,持有交易性金融资产、交易性金融负债产350,798.46生的公允价值变动损益,以及处置交易性金融资产、交易性金融负债和可供出售金融资产取得的投资收益除上述各项之外的其他营业外收入和支出-1,337,359.33少数股东权益影响额72,472.26所得税影响额-205,532.93合计-556,362.86对重要非经常性损益项目的说明无2.2 报告期末股东总人数及前十名无限售条件股东持股情况表单位:股报告期末股东总数(户)92,821前十名无限售条件流通股股东持股情况股东名称(全称)期末持有无限售条件流通股的数量种类万向资源有限公司49,662,937 人民币普通股中信银行-招商优质成长股票型证券投资基金9,628,913 人民币普通股中国银行-大成蓝筹稳健证券投资基金8,023,872 人民币普通股中国工商银行-南方成份精选股票型证券投资基金7,805,760 人民币普通股大成价值增长证券投资基金7,367,216 人民币普通股中国银行-易方达深证100交易型开放式指数证券投资基金7,130,140 人民币普通股全国社保基金一一零组合5,321,525 人民币普通股国际金融-花旗-MARTIN CURRIE INVESTMENT MANAGEMENT LIMITED4,679,982 人民币普通股中国工商银行-融通深证100指数证券投资基金4,620,152 人民币普通股中国光大银行股份有限公司-国投瑞银景气行业证券投资基金2,600,474 人民币普通股§3 重要事项3.1 公司主要会计报表项目、财务指标大幅度变动的情况及原因√适用□不适用1、应收票据较年初增加124.08%,主要是公司本期以银行承兑汇票方式结算货款增加所致。
证券代码:300059 证券简称:东方财富 公告编号:2010-012东方财富信息股份有限公司2010年第一季度季度报告正文§1 重要提示1.1本公司股票在深圳证券交易所创业板市场上市,该市场具有较高的投资风险。
创业板公司具有业绩不稳定、经营风险高、退市风险大等特点,投资者面临较大的市场风险,应审慎作出投资决定。
1.2 本公司董事会、监事会及董事、监事、高级管理人员保证本报告所载资料不存在任何虚假记载、误导性陈述或者重大遗漏,并对其内容的真实性、准确性和完整性负个别及连带责任。
1.3 公司第一季度财务报告未经会计师事务所审计。
1.4 公司负责人沈军、主管会计工作负责人陆威及会计机构负责人(会计主管人员)叶露声明:保证季度报告中财务报告的真实、完整。
§2 公司基本情况2.1 主要会计数据及财务指标单位:元本报告期末 上年度期末 本报告期末比上年度期末增减总资产 1,642,190,373.36 321,104,466.12 411.42%归属于公司普通股股东的所有者权益(或股东权益)1,586,639,803.89 270,776,399.74 485.96% 归属于公司普通股股东的每股净资产(元/股)11.33 2.58 339.15%年初至报告期期末 比上年同期增减 经营活动产生的现金流量净额(元)21,858,787.76 -5.17% 每股经营活动产生的现金流量净额(元/股)0.16 -28.88%报告期 年初至报告期期末本报告期比上年同期增减营业收入 45,894,723.17 45,894,723.17 27.66% 归属于公司普通股股东的净利润 20,311,404.15 20,311,404.15 30.64% 基本每股收益(元/股) 0.19 0.19 18.75% 稀释每股收益(元/股) 0.19 0.19 18.75% 净资产收益率(%) 7.23 7.23 -0.48% 扣除非经常性损益后的净资产收益率(%)6.00 6.00 -0.60% 非经常性损益合计 3,454,500.01 3,454,500.01 54.56% 非经常性损益对所得税的影响合计 493,500.00 493,500.00 1216.00%非经常性损益项目 年初至报告期期末金额非流动资产处置损益计入当期损益的政府补助,但与公司正常经营业务密切相关,符合国家政策规定、按照一定标准定额或定量持续享受的政府补助除外3,948,000.01 所得税影响额 -493,500.00合计 3,454,500.012.2 报告期末股东总人数及前十名无限售条件股东持股情况表单位:股报告期末股东总数(户) 18519前十名无限售条件流通股股东持股情况股东名称(全称) 期末持有无限售条件流通股的数量种类国投信托有限公司-国投瑞丰证券投资资金信托 380,000人民币普通股 国泰君安证券股份有限公司 283,091人民币普通股 中国工商银行-上投摩根内需动力股票型证券投资基金280,885人民币普通股 张松元 280,000人民币普通股 刘树清 270,906人民币普通股 刘永合 255,690人民币普通股 朱晴波 255,520人民币普通股 聊城鲁西东华对外贸易有限公司 236,188人民币普通股 朱振国 197,600人民币普通股 赖虽治 150,000人民币普通股2.3 限售股份变动情况表单位:股股东名称 年初限售股数本期解除限售股本期增加限售股数期末限售股数限售原因解除限售日(非交易日顺延)沈 军 39,250,68539,250,685公开发行前限售2013年3月19日熊向东 17,147,50017,147,500公开发行前限售2011年3月19日深圳市秉合投资有限公司 9,000,0009,000,000公开发行前限售2011年3月19日徐 豪 7,761,5007,761,500公开发行前限售2011年3月19日海通开元投资有限公司 5,000,0005,000,000公开发行前限售2012年7月22日沈友根 4,800,0004,800,000公开发行前限售2013年3月19日陆丽丽 4,702,5004,702,500公开发行前限售2013年3月19日詹颖珏 3,086,5503,086,550公开发行前限售2011年3月19日鲍一青 2,331,2402,331,240公开发行前限售2011年3月19日史 佳 2,331,2402,331,240公开发行前限售2011年3月19日陶 涛 1,748,4301,748,430公开发行前限售2011年3月19日左宏明 1,319,0451,319,045公开发行前限售2011年3月19日王敏文 1,200,0001,200,000公开发行前限售2011年3月19日张 森 902,500902,500公开发行前限售2011年3月19日上海融客投资管理有限公司 780,000780,000公开发行前限售2011年3月19日上海宝樽国际贸易有限公司 600,000600,000公开发行前限售2011年3月19日陆利斌 600,000600,000公开发行前限售2011年3月19日王正东 600,000600,000公开发行前限售2011年3月19日程 磊 582,810582,810公开发行前限售2011年3月19日廖双辉 475,000475,000公开发行前限售2011年3月19日罗会云 420,000420,000公开发行前限售2011年3月19日陆 威 171,000171,000公开发行前限售2011年3月19日吴善昊 114,000114,000公开发行前限售2011年3月19日吴治明 76,00076,000公开发行前限售2011年3月19日网下配售股份 7,000,0007,000,000网下新股配售限售2010年6月19日合 计 112,000,000112,000,000-- --§3 管理层讨论与分析3.1 公司主要会计报表项目、财务指标大幅度变动的情况及原因√ 适用 □ 不适用1、货币资金余额较年初增长490.41%,主要是由于公司向社会公开发行人民币普通股(A股)35,000,000股,每股发行价为人民币40.58元,共募集资金1,420,300,000.00元,扣除发行费用后,计募集资金净额为人民币1,295,552,000.00元;2、应收账款余额较年初增长2.67%,主要是由于公司业务正常发展,销售规模拓展所致;3、应收利息余额较年初增长270.39%,主要是由于上年同期部分存款利息已结算,而本期公司大部分存款仍处于计息期间,尚未结息,因此计提应收利息额较多;4、应付账款余额较年初增长539.75%,主要是由于公司部分业务成本及费用等尚未付款,但已按权责发生制核算应付账款;5、股本余额较年初增长33.33%,资本公积余额较年初增长2382.78%,主要是由于公司向社会公开发行人民币普通股(A股)35,000,000股,扣除发行费用后,计募集资金净额为人民币1,295,552,000.00元,其中注册资本人民币35,000,000.00元,资本溢价人民币1,260,552,000.00元,计入“资本公积”;6、营业收入较上年同期增长27.67%,主要是由于公司克服困难,科学决策,积极抓住市场机遇,进一步提升服务理念,坚持“用户为王”,紧紧把握网络财经信息服务行业及网站用户的需求,加强产品和服务创新,完善营销体系建设,各项业务都实现了全面提升,主营收入继续保持健康快速增长;7、营业成本较上年同期增长27.37%,主要是由于随公司业务规模扩大而正常增长;8、营业税金及附加较上年同期增长37.96%,主要是由于随公司主营业务收入增加而相应增加;由于业务模式不同,金融数据服务及广告服务业务所对应的营业税金附加费率不同,造成营业税金及附加的增长幅度高于营业收入的增长幅度,属于正常范畴;9、销售费用较上年同期增长17.77%,主要是由于公司经营规模扩大、销售人员增加,加大市场推广力度,重视品牌宣传,导致销售费用相应增长;10、管理费用较上年同期增长73.20%,主要是由于公司经营规模扩大引起相关的职工薪酬、办公费用、以及其它项目管理费用的同步增长;11、所得税费用较上年同期增长 31.81%,主要是由于营业收入持续增长,营业成本及费用得到有效控制,利润总额增长较快;12、营业利润、利润总额和归属于母公司所有者的净利润较上年同期分别增长24.05%、30.87%和 30.64%,主要是由于公司经营规模扩大,营业收入持续增长,成本及费用管控科学有效,利润和净利润持续保持健康良好增长;13、支付给职工以及为职工支付的现金较上年同期增长34.33%,主要是由于经营规模扩大,公司员工数量增加,相应支付的职工薪酬等费用随之增长;14、支付的各项税费较上年同期增长89.23%,主要是由于2008年公司属于享受税收优惠政策“两免三减半”的免税期,因此在上年同期无需支付2008年的企业所得税,而2009年属于减半缴纳企业所得税期间,因此本期需要缴纳上年第四季度企业所得税,造成该项现金流出较上年同期增幅较大;15、支付的其它与经营活动有关的现金较上年同期增加24.51%,主要是由于公司经营规模扩大,经营活动活跃,造成该项现金流出相应增长。
证券代码:002230 证券简称:科大讯飞公告编号:2010-014 安徽科大讯飞信息科技股份有限公司2010年第一季度季度报告正文§1 重要提示1.1 本公司董事会、监事会及董事、监事、高级管理人员保证本报告所载资料不存在任何虚假记载、误导性陈述或者重大遗漏,并对其内容的真实性、准确性和完整性负个别及连带责任。
1.2 公司第一季度财务报告未经会计师事务所审计。
1.3 公司负责人刘庆峰、主管会计工作负责人张少兵及会计机构负责人(会计主管人员)叶新华声明:保证季度报告中财务报告的真实、完整。
§2 公司基本情况2.1 主要会计数据及财务指标单位:元本报告期末上年度期末增减变动(%)总资产(元)694,610,364.33728,219,506.49 -4.62%归属于上市公司股东的所有者权益(元)593,563,255.50583,876,410.56 1.66%股本(股)160,749,000.00160,749,000.00 0.00%归属于上市公司股东的每股净资产(元/股) 3.69 3.63 1.65%本报告期上年同期增减变动(%)营业总收入(元)56,149,818.9645,570,124.11 23.22%归属于上市公司股东的净利润(元)9,033,983.637,330,611.57 23.24%经营活动产生的现金流量净额(元)-16,721,748.09-24,670,546.80 32.22%每股经营活动产生的现金流量净额(元/股)-0.10-0.15 32.22%基本每股收益(元/股)0.060.05 20.00%稀释每股收益(元/股)0.060.05 20.00%加权平均净资产收益率(%) 1.54% 1.37% 0.17%扣除非经常性损益后的加权平均净资产收益0.85% 1.08% -0.23%率(%)非经常性损益项目年初至报告期期末金额非流动资产处置损益-3,750.64计入当期损益的政府补助,但与公司正常经营业务密切相关,符合国家政策规定、按照一定标准4,885,079.38定额或定量持续享受的政府补助除外除上述各项之外的其他营业外收入和支出-116,972.19所得税影响额-713,798.76合计4,050,557.79对重要非经常性损益项目的说明无重要非经常性损益项目的说明。
无锡小天鹅股份有限公司2010年第一季度季度报告全文§1 重要提示1.1 本公司董事会、监事会及董事、监事、高级管理人员保证本报告所载资料不存在任何虚假记载、误导性陈述或者重大遗漏,并对其内容的真实性、准确性和完整性负个别及连带责任。
1.2 公司第一季度财务报告未经会计师事务所审计。
1.3 公司负责人方洪波先生、主管会计工作负责人马俊霞女士及会计机构负责人(会计主管人员)曾睿先生声明:保证季度报告中财务报告的真实、完整。
§2 公司基本情况2.1 主要会计数据及财务指标单位:元本报告期末上年度期末增减变动(%)总资产(元)4,533,423,236.453,878,629,773.92 16.88%归属于上市公司股东的所有者权益(元)1,933,268,337.261,854,911,284.10 4.22%股本(股)547,655,760.00547,655,760.00 0.00%归属于上市公司股东的每股净资产(元/股) 3.53 3.39 4.13%本报告期上年同期增减变动(%)营业总收入(元)1,662,106,246.14974,105,929.15 70.63%归属于上市公司股东的净利润(元)78,261,091.5643,639,765.07 79.33%经营活动产生的现金流量净额(元)-386,451,128.5424,940,968.36 -1,649.46%每股经营活动产生的现金流量净额(元/股)-0.710.05 -1,520.00%基本每股收益(元/股)0.140.08 75.00%稀释每股收益(元/股)0.140.08 75.00%加权平均净资产收益率(%) 4.13% 2.68% 1.45%扣除非经常性损益后的加权平均净资产收益4.16% 1.87% 2.29%率(%)非经常性损益项目年初至报告期期末金额非流动资产处置损益-845,279.21计入当期损益的政府补助,但与公司正常经营业务密切相关,符合国家政策规定、按照一定标准938,559.42定额或定量持续享受的政府补助除外除同公司正常经营业务相关的有效套期保值业务外,持有交易性金融资产、交易性金融负债产生95,961.60的公允价值变动损益,以及处置交易性金融资产、交易性金融负债和可供出售金融资产取得的投资收益除上述各项之外的其他营业外收入和支出-954,987.56所得税影响额123,133.52少数股东权益影响额87,062.77合计-555,549.46对重要非经常性损益项目的说明2.2 报告期末股东总人数及前十名无限售条件股东持股情况表单位:股报告期末股东总数(户)27,373前十名无限售条件流通股股东持股情况股东名称(全称)期末持有无限售条件流通股的数量种类广东美的电器股份有限公司131,510,011人民币普通股GAOLING FUND,L.P. 41,602,180境内上市外资股TITONI INVESTMENTS DEVELOPMENT30,851,714境内上市外资股LTD.无锡市财政局22,057,657人民币普通股中国工商银行-鹏华优质治理股票型证券投15,217,658人民币普通股资基金(LOF)BOCI SECURITIES LIMITED 14,923,844境内上市外资股中国工商银行-南方绩优成长股票型证券投6,203,619人民币普通股资基金招商证券香港有限公司5,725,361境内上市外资股中国工商银行-东吴嘉禾优势精选混合型开5,498,622人民币普通股放式证券投资基金中国建设银行-国泰金鼎价值精选混合型证5,485,636人民币普通股券投资基金§3 重要事项3.1 公司主要会计报表项目、财务指标大幅度变动的情况及原因单位:元√适用□不适用序号 指标项目 本期数 年初数 变动率1 货币资金 456,333,704.60852,448,970.81 -46.47%2 应收票据 1,753,170,705.11604,499,731.15 190.02%3 应收账款 612,846,478.95874,635,649.01 -29.93%4 预付账款 141,887,489.3466,243,273.07 114.19%5 可供出售金融资产 425,712.00312,816.00 36.09%6 在建工程 13,750,456.0223,101,817.68 -40.48%7 长期待摊费用 23,830,162.0316,773,746.67 42.07%8 短期借款 -1,000,000.00 -100.00%9 应付票据 165,336,799.5514,000,000.00 1080.98%10 应交税费 53,286,883.29116,221,316.66 -54.15%11 递延所得税负债 48,811.8031,877.40 53.12%12 其他非流动负债 5,338,900.003,679,000.00 45.12%序号 指标项目 本期数 去年同期 变动率13 营业收入 1,662,106,246.14974,105,929.15 70.63%14 营业税金及附加 5,091,868.017,247,483.23 -29.74%15 管理费用 77,055,101.3840,946,880.74 88.18%16 财务费用 -1,171,952.69749,646.93 -256.33%17 资产减值损失 -13,083,139.6862,240.73 -21120.22%18 投资收益 1,289,048.9511,055,072.87 -88.34%19 营业利润 100,560,926.3529,854,931.59 236.83%20 营业外收入 2,753,456.8316,751,638.84 -83.56%21 利润总额 99,926,719.0043,957,477.67 127.33%22 所得税费用 15,210,768.878,088,837.93 88.05%23 少数股东损益 6,454,858.57-7,771,125.33 -183.06%24 经营活动产生的现金流量净额 -386,451,128.5424,940,968.36 -1649.46%25 投资活动产生的现金流量净额 -8,447,650.17-3,361,083.63 151.34%26 筹资活动产生的现金流量净额 -1,216,487.50-1,793,422.67 -32.17%27 现金及现金等价物的增加 -396,115,266.2119,786,462.06 -2101.95%1、受金融市场宏观政策变化影响,现汇收款减少,银行承兑汇票收款增加。
北京联信永益科技股份有限公司2010年第一季度季度报告全文§1 重要提示1.1 本公司董事会、监事会及董事、监事、高级管理人员保证本报告所载资料不存在任何虚假记载、误导性陈述或者重大遗漏,并对其内容的真实性、准确性和完整性负个别及连带责任。
1.2 公司第一季度财务报告未经会计师事务所审计。
1.3 公司负责人彭小军、主管会计工作负责人何金生及会计机构负责人(会计主管人员)毕玉农声明:保证季度报告中财务报告的真实、完整。
§2 公司基本情况2.1 主要会计数据及财务指标单位:元本报告期末上年度期末增减变动(%)总资产(元)805,378,994.94400,341,444.62 101.17%归属于上市公司股东的所有者权益(元)622,288,629.02161,751,461.48 284.72%股本(股)68,530,000.0051,030,000.00 34.29%归属于上市公司股东的每股净资产(元/股)9.08 3.17 186.44%本报告期上年同期增减变动(%)营业总收入(元)116,564,256.50122,781,889.16 -5.06%归属于上市公司股东的净利润(元)1,250,837.548,355,872.06 -85.03%经营活动产生的现金流量净额(元)-114,258,096.95-75,319,860.22 -51.71%每股经营活动产生的现金流量净额(元/股)-1.67-1.48 -12.84%基本每股收益(元/股)0.020.16 -87.50%稀释每股收益(元/股)0.020.16 -87.50%加权平均净资产收益率(%)0.71% 6.41% -5.70%扣除非经常性损益后的加权平均净资产收益0.55% 6.41% -5.86%率(%)非经常性损益项目年初至报告期期末金额计入当期损益的政府补助,但与公司正常经营业务密切相关,符合国家政策规定、按照一定标准250,000.00定额或定量持续享受的政府补助除外合计250,000.00对重要非经常性损益项目的说明工业促进局支持中小企业发展专项款2.2 报告期末股东总人数及前十名无限售条件股东持股情况表单位:股报告期末股东总数(户)11,698前十名无限售条件流通股股东持股情况股东名称(全称)期末持有无限售条件流通股的数量种类张长天286,050人民币普通股王军良160,000人民币普通股中国农业银行-宝盈策略增长股票型证券投资120,000人民币普通股基金范强112,150人民币普通股刘光灿104,645人民币普通股蒋春花100,707人民币普通股陈益群70,000人民币普通股何怀斌65,165人民币普通股蔡雪冰61,405人民币普通股四川天邑信息科技股份有限公司60,000人民币普通股§3 重要事项3.1 公司主要会计报表项目、财务指标大幅度变动的情况及原因√适用□不适用一、资产负债表项目:1.货币资金比年初增加219.39%,主要原因是报告期内发行股票收到投资款所致;2.预付账款比年初增加135.73%,主要原因是报告期内实施项目结算款项增加所致;3.其他应收款比年初下降39.13%,主要原因是收回项目履约保函所致;4.递延所得税资产比年初增加64.52%,主要原因是2010年企业所得税按月申报预缴,所得税费用暂时性差异增加所致;5.短期借款比年初增加100%,主要原因是2010年一季度补充流动资金借款所致;6.应付票据比年初下降100%,主要原因是2010年一季度结算兑付所致;7.预收账款比年初下降45.23%,主要原因是项目验收后实现营业收入所致;8.应交税费比年初下降123.24%,主要原因是报告期末抵扣进项税额增加所致;9.股本比年初增加34.29%,主要原因是报告期内发行股票所致;10.资本公积金比年初增加1616385.67%,主要原因是报告期内发行股票收到股本溢价所致。
二、利润表项目:1.营业税金及附加比去年同期增加100.88%,主要原因是报告期内技术服务收入结构性增加所致;2.销售费用比去年同期增加33.53%,主要是报告期内拓展内蒙、山西、河北等外阜大项目使得市场费用增加所致;3.资产减值损失比去年同期减少81.12%,主要是报告期新增应收账款减少所致。
4.投资损失比去年同期增加61.54%,主要原因是信息公司投资的银通金达亏损增加所致;5.所得税费用比去年同期减少75.28%,主要原因是报告期同比利润总额减少所致。
三、现金流量表项目:1.经营活动产生的现金流量净额比去年同期降低3893.82万元,主要原因是,报告期内应实施项目需要同比增加支付货款4112.01万元所致;2.筹资活动产生的现金流量净额比去年同期增加43935.50万元,主要原因是本期发行股票收到投资款所致。
3.2 重大事项进展情况及其影响和解决方案的分析说明1.公司是否存在向控股股东或其关联方提供资金:否2.日常经营重大合同的签署和履行情况:无3.3 公司、股东及实际控制人承诺事项履行情况√适用□不适用承诺事项承诺人承诺内容履行情况股改承诺无无无股份限售承诺发行前全体股东公司控股股东、实际控制人陈俭承诺:自公司股票上市之日起36个月内,不转让或者委托他人管理其持有的公司股份,也不由公司回购其持有的上述股份。
公司股东联想投资有限公司、北京电信投资有限公司、彭小军先生、李超勇先生承诺:自公司股票上市之日起一年内不转让其持有的公司股份。
公司高级管理人员陈俭、彭小军、李超勇承诺:在公司任职期间每年转让的股份不超过本人持有公司股份总数的百分之二十五,若从公司离职,自离职之日起半年内不转让所持有的公司股份。
报告期内,上述承诺人均严格履行所作的承诺。
收购报告书或权益变动报告书中所作承诺无无无重大资产重组时所作承诺无无无发行时所作承诺陈俭公司控股股东、实际控制人陈俭承诺:不从事与公司业务相同、类似以及其他可能与公司构成竞争的业务。
报告期内,上述承诺人均严格履行所作的承诺。
其他承诺(含追加承诺)无无无3.4 对2010年1-6月经营业绩的预计单位:元归属于上市公司股东的净利润比上年同期下降50%以上2010年1-6月预计的经营业绩同比下降70%-90%2009年1-6月经营业绩归属于上市公司股东的净利润:15,306,094.70业绩变动的原因说明由于IT行业季节性的影响造成市场签单减少;部分客户项目投资延缓;加上公司上半年人员增加导致费用增加,预计经营业绩将下降。
3.5 证券投资情况□适用√不适用§4 附录4.1 资产负债表编制单位:北京联信永益科技股份有限公司 2010年03月31日单位:元期末余额年初余额项目合并母公司合并母公司流动资产:货币资金529,985,044.36502,720,783.06165,939,071.75 66,343,885.94结算备付金拆出资金交易性金融资产应收票据应收账款109,172,683.4743,481,682.5792,276,426.73 30,864,119.55预付款项32,685,302.597,626,964.8413,865,816.12 2,665,478.22应收保费应收分保账款应收分保合同准备金应收利息应收股利其他应收款6,785,034.6513,993,321.7711,146,975.98 3,930,215.54买入返售金融资产存货117,540,122.3724,925,902.72107,888,920.50 41,333,077.40一年内到期的非流动资产其他流动资产流动资产合计796,168,187.44592,748,654.96391,117,211.08 145,136,776.65非流动资产:发放贷款及垫款可供出售金融资产持有至到期投资长期应收款长期股权投资1,202,810.4350,551,600.001,476,690.17 50,551,600.00投资性房地产固定资产2,121,592.24697,103.481,785,710.63 472,238.63在建工程工程物资固定资产清理生产性生物资产油气资产无形资产5,079,375.213,198,000.285,471,300.19 3,464,500.27开发支出商誉长期待摊费用递延所得税资产807,029.62376,608.00490,532.55 376,608.00其他非流动资产非流动资产合计9,210,807.5054,823,311.769,224,233.54 54,864,946.90资产总计805,378,994.94647,571,966.72400,341,444.62 200,001,723.55流动负债:短期借款40,000,000.0020,000,000.0020,000,000.00 20,000,000.00向中央银行借款吸收存款及同业存放拆入资金交易性金融负债应付票据20,000,000.00 应付账款98,375,762.2939,660,038.74110,540,398.95 40,044,517.31预收款项30,251,675.5211,054,126.8155,233,266.76 18,704,744.31卖出回购金融资产款应付手续费及佣金应付职工薪酬4,453,248.281,818,207.384,474,271.09 1,941,377.04应交税费-3,707,493.47-843,551.8415,950,032.25 7,299,892.76应付利息应付股利其他应付款11,167,173.3012,604,588.309,592,014.09 9,159,381.76应付分保账款保险合同准备金代理买卖证券款代理承销证券款一年内到期的非流动负债其他流动负债流动负债合计180,540,365.9284,293,409.39235,789,983.14 97,149,913.18非流动负债:长期借款应付债券长期应付款专项应付款预计负债递延所得税负债其他非流动负债2,550,000.002,550,000.002,800,000.00 2,800,000.00非流动负债合计2,550,000.002,550,000.002,800,000.00 2,800,000.00负债合计183,090,365.9286,843,409.39238,589,983.14 99,949,913.18所有者权益(或股东权益):实收资本(或股本)68,530,000.0068,530,000.0051,030,000.00 51,030,000.00资本公积441,813,661.74441,788,464.7427,331.74 2,134.74减:库存股专项储备盈余公积6,846,259.386,846,259.386,846,259.38 6,846,259.38一般风险准备未分配利润105,098,707.9043,563,833.21103,847,870.36 42,173,416.25外币报表折算差额归属于母公司所有者权益合计622,288,629.02560,728,557.33161,751,461.48 100,051,810.37少数股东权益0.000.00所有者权益合计622,288,629.02560,728,557.33161,751,461.48 100,051,810.37负债和所有者权益总计805,378,994.94647,571,966.72400,341,444.62 200,001,723.554.2 利润表编制单位:北京联信永益科技股份有限公司 2010年1-3月单位:元本期金额上期金额项目合并母公司合并母公司一、营业总收入116,564,256.5047,029,388.79122,781,889.16 27,572,295.15其中:营业收入116,564,256.5047,029,388.79122,781,889.16 27,572,295.15利息收入已赚保费手续费及佣金收入二、营业总成本117,806,556.7246,037,220.38116,361,308.61 26,341,516.09其中:营业成本94,607,799.0336,738,941.1195,853,919.09 17,039,881.25利息支出手续费及佣金支出退保金赔付支出净额提取保险合同准备金净额保单红利支出分保费用营业税金及附加1,051,745.93376,853.70523,557.62 89,103.58销售费用3,465,294.55971,283.802,595,045.98 590,194.00管理费用18,303,049.587,645,732.4616,605,111.28 8,074,466.85财务费用291,767.61239,709.96323,359.54 254,623.29资产减值损失86,900.0264,699.35460,315.10 293,247.12加:公允价值变动收益(损失以“-”号填列)投资收益(损失以“-”号-273,879.740.00-169,544.72 0.00填列)其中:对联营企业和合-273,879.740.00-273,879.74 0.00营企业的投资收益汇兑收益(损失以“-”号填列)三、营业利润(亏损以“-”号填-1,516,179.96992,168.416,251,035.83 1,230,779.06列)加:营业外收入2,926,016.00557,247.052,748,081.71 1,227,685.09减:营业外支出其中:非流动资产处置损失四、利润总额(亏损总额以“-”1,409,836.041,549,415.468,999,117.54 2,458,464.15号填列)减:所得税费用158,998.50158,998.50643,245.48 229,330.52五、净利润(净亏损以“-”号填1,250,837.541,390,416.968,355,872.06 2,229,133.63列)归属于母公司所有者的净1,250,837.541,390,416.968,355,872.06 2,229,133.63利润少数股东损益0.000.00六、每股收益:(一)基本每股收益0.020.16(二)稀释每股收益0.020.16七、其他综合收益0.000.000.00 0.00八、综合收益总额1,250,837.541,390,416.968,355,872.06 2,229,133.63归属于母公司所有者的综1,250,837.541,390,416.968,355,872.06 2,229,133.63合收益总额归属于少数股东的综合收益总额4.3 现金流量表编制单位:北京联信永益科技股份有限公司 2010年1-3月单位:元本期金额上期金额项目合并母公司合并母公司一、经营活动产生的现金流量:销售商品、提供劳务收到的85,493,273.1022,449,845.2264,810,812.31 17,988,677.45现金客户存款和同业存放款项净增加额向中央银行借款净增加额向其他金融机构拆入资金净增加额收到原保险合同保费取得的现金收到再保险业务现金净额保户储金及投资款净增加额处置交易性金融资产净增加额收取利息、手续费及佣金的现金拆入资金净增加额回购业务资金净增加额收到的税费返还2,676,016.00307,247.052,583,081.71 1,062,685.09收到其他与经营活动有关8,450,017.252,089,461.047,715,341.52 9,091,756.27的现金经营活动现金流入小计96,619,306.3524,846,553.3175,109,235.54 28,143,118.81购买商品、接受劳务支付的159,828,627.7226,947,134.68118,708,454.03 32,103,800.89现金客户贷款及垫款净增加额存放中央银行和同业款项净增加额支付原保险合同赔付款项的现金支付利息、手续费及佣金的现金支付保单红利的现金支付给职工以及为职工支13,792,395.464,859,176.3513,009,132.94 6,646,605.97付的现金支付的各项税费21,604,092.668,829,990.959,359,930.40 2,315,085.61支付其他与经营活动有关15,652,287.466,473,357.229,351,578.39 3,686,752.61的现金经营活动现金流出小计210,877,403.3047,109,659.20150,429,095.76 44,752,245.08经营活动产生的现金-114,258,096.95-22,263,105.89-75,319,860.22 -16,609,126.27流量净额二、投资活动产生的现金流量:收回投资收到的现金取得投资收益收到的现金处置固定资产、无形资产和其他长期资产收回的现金净额处置子公司及其他营业单位收到的现金净额收到其他与投资活动有关的现金投资活动现金流入小计购建固定资产、无形资产和255,108.99190,798.9995,456.41 0.00其他长期资产支付的现金投资支付的现金质押贷款净增加额取得子公司及其他营业单位支付的现金净额支付其他与投资活动有关的现金投资活动现金流出小计255,108.99190,798.9995,456.41 0.00投资活动产生的现金-255,108.99-190,798.99-95,456.41流量净额三、筹资活动产生的现金流量:吸收投资收到的现金459,286,330.00459,286,330.00其中:子公司吸收少数股东投资收到的现金取得借款收到的现金20,000,000.0040,000,000.00发行债券收到的现金收到其他与筹资活动有关的现金筹资活动现金流入小计479,286,330.00459,286,330.0040,000,000.00偿还债务支付的现金分配股利、利润或偿付利息289,550.00262,550.00374,650.00 238,950.00支付的现金其中:子公司支付给少数股东的股利、利润支付其他与筹资活动有关436,401.45192,978.00的现金筹资活动现金流出小计725,951.45455,528.00374,650.00 238,950.00筹资活动产生的现金478,560,378.55458,830,802.0039,625,350.00 -238,950.00流量净额四、汇率变动对现金及现金等价物的影响五、现金及现金等价物净增加额364,047,172.61436,376,897.12-35,789,966.63 -16,848,076.27加:期初现金及现金等价物160,436,754.6460,983,281.35108,012,781.75 24,559,061.67余额六、期末现金及现金等价物余额524,483,927.25497,360,178.4772,222,815.12 7,710,985.404.4 审计报告审计意见:未经审计。