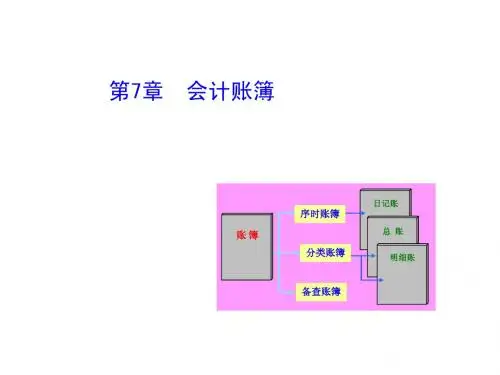
会计学07 清华大学课件
- 格式:ppt
- 大小:536.50 KB
- 文档页数:4

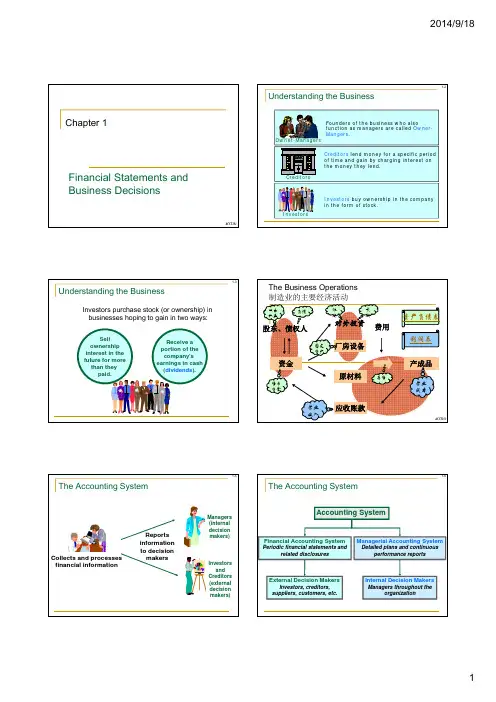


7-1D Company has the following information available as of Dec. 31, 2010: 1-30 31-60 61-90 Over 90 Total AR Days Days Days Days $60,000 $46,500 $7,400 $3,700 $2,400 Total credit sales for the year ended Dec. 31, 2010, were $825,000. The balance in the Allowance for Uncollectible Accounts at Dec. 31, 2010, is a $500 debit. The estimated bad debts percentages are as follows: as a percentage of credit sales 1% as a percentage of ending accounts receivable 10% as a percentage of aging accounts receivable: 1-30 days 3% 31-60 days 15% 61-90 days 35% Over 90 days 75% Prepare the journal entry on Dec. 31, 2010 to estimate bad debts: a. percentage of credit sales method b. percentage of ending accounts receivable method 7-1 c. aging of accounts receivable methoda. Bad Debts Expense Allowance for Uncollectible Accounts b. Bad Debts Expense Allowance for Uncollectible Accounts c. Bad Debts Expense Allowance for Uncollectible Accounts* ($825,000 X .01)= $8,250 ** ($60,000 X .10) = $6,000 ($6,000 + $500) = $6,5008,250* 8,250 6,500** 6,500 6,100*** 6,100***($46,500 X .03) + ($7,400 X .15) + ($3,700 X .35) + ($2,400 X .75) = $5,600 ($5,600 + $500) = $6,1007-2Lecture OutlineChapterRelation between inventory and COGS7Inventories and Costs of Goods SoldThe items included in inventory Accounting for inventory COGS Valuation Specific identification LIFO FIFO Weighted average Other valuation methods and analysis Lower-of-cost-or-market method Effect of inventory errors Evaluate related ratios7-4Perpetual Periodic7-3What is Inventory(存货)? Goods that are either manufactured or purchased for resale in the normal course of business. Merchandising• Items purchased to be resoldDetermining Inventory ItemsInventory includes all goods that a company owns and holds for sale, regardless of where the goods are located when inventory is counted counted.Items requiring special attention include:Goods in Transit (在途存货) Goods on Consignment (委托代销) Goods Damaged or Obsolete(毁损 或过期)7-6 Manufacturing• Raw materials(原材料) • Work-in-process(在产品) • Finished goods(产成品)7-57-2Goods in TransitFOB Shipping Point Public Carrier Seller Ownership passes to the buyer here. Public Carrier Seller FOB Destination Point Buyer7-7Goods on ConsignmentMerchandise is included in the inventory of the consignor, the owner of the inventory.BuyerThanks for selling my inventory i t in i your store.Consignee代销方Consignor委托方7-8Goods Damaged or ObsoleteDamaged or obsolete goods are not counted in inventory.Determining Inventory CostsInclude all expenditures necessary to bring an item to a salable condition and location.+ Duties + Freight In (Transportation In)- PurchaseInvoice In oice CostDi Discounts t - Purchase Returns and Allowances+ AssemblingCost should be reduced to net realizable value(可实现净值).7-9+ Warehouse and Insurance?7 - 10What’s the effect if we record transportation cost as inventory/period cost? 把运输费用记为存货/期间费用,分别对会计 报表产生什么样的影响?Inventory and Cost of Goods Sold When the products are sold, the cost of the inventory becomes COGS in the IS COGS: the expenses incurred to purchase or manufacture the merchandise sold during a period. Net Sales – COGS= Gross Profit (Gross Margin)7 - 117 - 127-3The Allocation of Inventory Cost between COGS and Ending Inventory- MerchandisingBeginning Inventory Net Cost of PurchaseThe Allocation of Inventory Cost between COGS and Ending Inventory__ T-accountInventory Beg. Bal. Purchase $ 1,000 $ 3,000 COGS End. Bal. $ 2,000 $2,000Cost of Goods Available For SaleCost of Goods Available for Sale = Inventory (Beg) + PurchaseCost of Goods Sold (IS)Ending Inventory (BS)7 - 13Cost of Goods Available for Sale = Inventory (End) + COGS7 - 14Class Discussion: Daniel Dobbins Distillery Daniel Dobbins• High quality products:“Old Trailridge” Bourbon Whiskey(波本威士忌) • Iron-free spring water, fire-charred white oak barrelDaniel Dobbins Distillery Production Process Volume• During 1980s, production volume ≈ sales volume • Baby boom may drive the market demand from year 1991 • Increase production level by 50% since 19887 - 15Mix混合Heat 加热(淀粉—糖)Ferment 发酵(糖-酒精)Aging (4 year) 陈化(至少四年)Mix 勾兑(石灰石泉水)Distillation 蒸馏7 - 16Daniel Dobbins Distillery Production costs• Cost of oak barrel: average $60/barrel• Oak barrel will be disposed after 4 years’ productionDaniel Dobbins Distillery Year 1988,increase oak barrel by 50%• Sales 40,000 barrels, Sales revenue $ 40 mill (= $1000×40,000) • Federal excise tax $ 30 mill • COGS (= $50×40,000) 2 mill • Production 60,000 barrels, oak barrel 3.6 mill (= $60×60,000) • Other expenses 4.6 mill • NI -$ 0.2 mill• Other production costs: average cost $50/barrel Year 1987 and before before, production and sales level=40,000barrels• • • • • • Price $1000/barrel, Sales revenue $ 40 mill Federal excise tax $ 30 mill COGS (= $50×40,000) 2 mill Oak barrel (= $60×40,000) 2.4 mill Other expenses 4.6 mill NI $ 1 mill7 - 177 - 187-4Lecture OutlineDaniel Dobbins Distillery Should the cost of oak barrel be charged to the current accounting period? If oak barrel is added to inventory cost, how about the NI in 1987 and 1988? NI for 1987 is the same 1988, COGS=$4.4mill[= $(50+60)×40,000]; NI $1mill Where is the cost of the newly added oak barrel? When the cost of oak barrel impact NI?7 - 19Relation between inventory and COGS The items included in inventory Accounting for inventory COGS Valuation Specific identification LIFO FIFO Weighted average Other valuation methods and analysis Lower-of-cost-or-market method Effect of inventory errors Evaluate related ratios7 - 20Perpetual PeriodicShould I keep Inventory Accounts Updated for each Sale? Discount Appliance Superstore• Sell washers, dryers, refrigerators, microwaves, and dishwashers, etc. • 50 salespersons work independently. • Sales loss is huge in the case of inventory shortage. shortageInventory systemIs inventory account updated when each sale and purchase is made? Yes Æ Perpetual, No Æ PeriodicPerpetual Records are updated when a purchase h or sale l is i made. d Records reflect total items in inventory or sold at any given time. Most often used when each item has a relatively high value, or the cost of running out of or overstocking an item is expensive.Periodic Records are not updated p when a purchase or a sale is made. Only the dollar amount of the sale is recorded. Used when inventory is composed of a large number of diverse items, each with a relatively low value.7 - 22 Newsstand• Sales concentrate during the morning and evening rush hours. • Sell newspapers, magazines, pens, snacks, and other odds and ends. • Lose customers if they wait for a long time.7 - 21Transactions involve inventoriesPurchases Transportation costs Purchase returns Purchase discounts Sales Sales returns Closing entries for COGS7 - 23Example: Accounting for Inventory Purchases and SalesHarper’s Hats recorded the following transactions for 2010: Jan 1 Mar 1 Mar 1 Mar 1 May 2 May 2 Jun 30 Jul 3 Beginning inventory Purchase Purchase returns Freight in Purchase Purchase discount Sales Sales return Ending inventory 10 @ $10 15 @ $15 3 @ $15 $10 10 @ $20 2/10, n/30 20 1 137 - 24=$100 =$225 =$45 =$10 =$200 =$87-5Example: Journal Entries for PurchasesHarper purchased 15 hats at $15 each on March 1. Record the entries for both the perpetual and the periodic systems. Perpetual: March 1 Dr Inventory … … … … … … … … … … … … Dr.Cr. Accounts Payable … … … … … … … … … 225 225Example: Journal Entries for Transportation CostHarper hired a trucking company to deliver its March 1 purchase of 15 hats. The trucking company charged $10. Record the entries for both the perpetual and the periodic systems.Perpetual: March 1 Dr. Inventory … … … … … … … … … … … … Cr. Cash ……………………… 10 10Purchase 15 hat @$15.Periodic: March 1 Dr. Purchases … … … … … … … … … … … …Cr. Accounts Payable … … … … … … … … … 225 225Delivery charge on 15 hats.Periodic: March 1 Dr. Freight in … … … … … … … … … … … … Cr. Cash ……………………… 10 107 - 26Purchase 15 hat @$15.7 - 25Delivery charge on 15 hats.Example: Journal Entries for Purchase ReturnsOf the 15 hats delivered on March 1, three were defective and Harper returned them the same day. Record the entries for both the perpetual and the periodic inventory systems. Perpetual: March 1Dr. Accounts Payable (Cash) … … … … … Cr. Inventory … … … … … … … … … 45 45Example: Journal Entries for Purchase DiscountsOn May 2, Harper purchased 10 hats at $20 each, pay cash immediately. The supplier offered terms of 2/10, n/30. Record the entries for both the perpetual and the periodic inventory systems. Perpetual: p May y2 Dr. Inventory … … … … … 200 Cr. Accounts Payable … … … … … … … … … 200Return 3 hats @ $15.Periodic: March 1 Dr. Accounts Payable (Cash) … … … … … … … 45Cr. Purchase return … … … … … … … … … 457 - 27Periodic: May 2 Dr. Purchase … … … … … Cr. 200 Accounts Payable … … … … … … … … … 2007 - 28Return 3 hats @ $15.Example: Journal Entries for Purchase Discountscontinue Perpetual: May 2 Dr. Accounts Payable … … … … … 200 Cr. Cr. Inventory … … … … … … … … … Cash ……………………… 4 196Summary: difference between perpetualand periodic in purchasePurchases Transportation costs Purchase returns Purchase discountsPerpetualAll adjustments are entered directly in the Inventory account.PeriodicAll adjustments are accumulated in an array of temporary holding accounts: Purchases Freight In Purchase Returns Purchase DiscountsRecord purchase discounts on 10 hats.Periodic: May 2 Dr. Accounts Payable … … … … … 200 Cr. Purchase Discounts… … … … … … … … … 4 Cr. Cash … … … … … … … … … 196Record purchase discounts on 10 hats.The difference in journal entries: one with and one without temporary accounts7 - 297 - 307-6Example:Journal Entries for SalesIn June, Harper’s Hats sold 20 hats for $25 each (selling the old ones first). Record the entries for both the perpetual and the periodic systems.Perpetual: June Dr. Accounts Receivable … … … … … … … Cr. Cr. Dr. COGS … … … … … … … … … Inventories (10@$10, 10@$15) … … … 500 500 250 250 Sales Revenue … … … … … … … … … …Example:Journal Entries for Sales ReturnsOn July 3, one hat was returned from a late June purchase. Record the entries for both the perpetual and the periodic inventory systems. Perpetual: June 3 Dr. Sales Returns. . . . . . . . . . . . . . . 25 Cr. Accounts Receivable. . . . . . .1 hat returned from June purchase.25 15Dr. Inventory. . . . . . . . . . . . . . . . . . .15 Cr. Cost of Goods sold . . . . . . . . Periodic: June 3 Dr. Sales Returns. . . . . . . . . . . . . . . 25 Cr. Accounts Receivable. . . . . . .Placed returned hat back into inventory.Sell 20 hats for $25 each.Periodic: June Dr. Accounts Receivable … … … … … 500 Cr. Sales Revenue … … … … … … … … … …Sell 20 hats for $25 each.5007 - 311 hat returned from June purchase.No entry for COGS.257 - 32Example: Accounting for InventoryPurchases and SalesHarper’s Hats recorded the following transactions for 2010: Jan 1 Mar 1 Mar 1 Mar 1 May 2 May 2 Jun 30 Jul 3 Beginning inventory Purchase Purchase returns Freight in Purchase Purchase discount Sales Sales return Ending inventory 10 @ $10 15 @ $15 3 @ $15 $10 10 @ $20 2/10, n/30 20 1 137 - 33Example:Closing Entries for COGS_ perpetualAt the end of the period, the accounting system generates an ending inventory balance, $251 and a COGS number, $235. NO ENTRY!Inventory (1/1) (3/1) (3/1) (5/2) (7/3) Bal. 100 225 10 200 (6/30) 15 2517 - 34=$100 =$225 =$45 =$10 =$200 =$8COGS (6/30) 250 (7/3) Bal. 235 15(3/1) (5/2)45 4 250Example:Closing Entries for COGS_ periodic1, the purchase, freight-in, purchase discounts, and purchase returns, are closed to COGS accountsDec 31 Dr. COGS. . . . . . . . . . . . . . . . . . Dr. Purchase Returns. . . . . . . . . . . . Dr. Purchase Discounts. . . . . . . . . . Cr. Freight In. . . . . . . . . . . . . . . . . Cr. Purchases. . . . . . . . . . . . . . . .Example:Closing Entries for COGS_ periodic2, Beginning inventory is closed to COGS: Dec 31 Dr. COGS. . . . . . . . . . . . . . . . . . Cr. Inventory. . . . . . . . . . . . . . . . 100100To close beginning inventory to COGS.386 45 4 3, With a periodic system, a physical count is the only way to get the information about ending inventory, so as to compute COGS: 10 425 Dec 31 Dr. Inventory. . . . . . . . . . . . . . . . . . Cr. COGS. . . . . . . . . . . . . . . .7 - 35To close temporary accounts to COGS.2512517 - 36To update ending inventory accounts and COGS.7-7Example:Closing Entries for COGS_ periodicWith a periodic system, a physical count is the only way to get the information necessary to compute COGS:Example:Closing Entries for COGS_ periodicSuppose a physical account indicates that the firm has 13 units of inventory with a cost of $251. 100 ( Beginning Inventory, Jan 1, 2010) 386 ( Purchases for the year) 486 ( C Cost t of f goods d available il bl for f sale l during d i 2010) 251 ( Ending Inventory, December 31, 2010) Inventory 235 ( Cost of Goods Sold for 2010)COGS Pur. 386 End. Inv. 251 Beg. Beg. Inv. 100 End.7 - 37+ = – =Beginning Inventory, Inventory January 1 1, 2010 Purchases for the year Cost of goods available for sale during 2010 Ending Inventory, December 31, 2010 Cost of Goods Sold for 2010+ = – =Inventory 100 COGS 100CountCOGS 251 End. 2512357 - 38Perpetual & PeriodicJournal Entries_Closing entriesPerpetualAll journal entries are posted to the ledger. Results in new balances for Inventory and COGS. Numbers are verified by physical count.Physical Count of InventoryEssential to maintaining reliable inventory accounting records, both perpetual and periodic.PeriodicTemporary holding accounts are accumulated and added to COGS. Beginning balance of Inventory account is transferred to COGS Ending balance of Inventory is based on Count.P Perpetual lPhysical count either confirms records are accurate or highlights shortages and clerical errors.P i di PeriodicQuantity count is the only way to get information necessary to compute ending inventory: Inventory costing (assigning a unit cost to each type of merchandise). Ending inventory = quantity of each type x its unit cost.7 - 407 - 39Perpetual vs. PeriodicCOGS Computation Perpetual The accounting records yield the COGS for the period as well as the amount of inventory that should be found with a physical count. count The difference between the records and actual count = inventory lost, stolen, or spoiled. Dr. Inventory Shrinkage Expense Cr. InventoryPerpetual & PeriodicSummarizing Example Perpetual System – at each saleCost of Goods Sold (COGS) Merchandise Inventory 870 870Periodic Company does not know what ending inventory should be. Physical count is the only way to get information about ending di i inventory t Assumes COGS is the difference between cost of goods available for sale and ending inventory. Cannot tell whether goods were sold, lost, stolen, or spoiled.7 - 41• • • • •Beginning balance 100 Purchases + 910 Available for sale 1,010 Cost of goods sold –870 Ending balance 140 (Derived)__________________________________________________________________• Ending inventory count identifies spoilage, theft, etc. 7 - 427-8Perpetual & PeriodicSummarizing Example Periodic System – at each saleNo entry is made so at year-end, do not have an up to date inventory count or COGS. Must conduct an ending inventory count.Cost of Merchandise Acquired_DetailedGross Profit Calculation• • • • •Beginning balance 100 Purchases +910 Available for sale 1,010 Ending Balance – 140 Cost of Goods Sold 870 (Derived)7 - 43 7 - 44________________________________________________________________• Spoilage/theft, etc. buried in COGSLecture OutlineRelation between inventory and COGS The items included in inventory Accounting for inventory COGS Valuation Specific identification LIFO FIFO Weighted average Other valuation methods and analysis Lower-of-cost-or-market method Effect of inventory errors Evaluate related ratios7 - 45Inventory Valuation MethodsPerpetual Periodic If inventory prices were not changing, all methods would produce the same COGS and ending inventory amounts. Since prices do change, which are assigned to COGS and ending inventory? Four methods are generally accepted:• • • • Specific identification - U.S. and IFRS acceptable First-in, first-out (FIFO) - U.S. and IFRS acceptable Weighted-average - U.S. and IFRS acceptable Last-in, first out (LIFO) - U.S. only acceptable7 - 46Specific Identification Cost Flow· Specifically identify the cost of each unitOther Inventory Cost FlowsKernel King buys and sells corn and had the following transactions for 1999: June 10 Purchased 10 tons at $6 per ton. July 28 Purchased 10 tons at $9 per ton. October 10 Sold 10 tons at $11 per ton. ton How much profit did Kernel King make ? Case #1 Sold Old Corn $110 60 $ 50 Case #2 Sold New Corn $110 90 $ 20 Case #3 Sold Mixed Corn $110 75 $ 357 - 48sold.· The individual cost of each unit is chargedagainst revenue as COGS.· To compute COGS and ending inventory, afirm must know each unit sold and its cost.· Example: Airplane, ship.Sales ($11 x 10 tons) COGS (10 tons) Gross margin7 - 477-9Inventory Cost Flow Methods:FIFO, LIFO, and Weighted AverageInventory Method Choice:Conceptual comparison between LIFO and FIFO Assumption Costs of more recent purchased inventories are more closed to true value of the inventories.FIFOLIFOAverage Cost¶ The oldestunits are sold and the newest units remain in inventory.¶ The newestunits are sold and a d the t eo oldest dest units remain in inventory. most recent units purchased is transferred to COGS.¶ An average cost iscomputed for all inventory e to y a available a ab e for sale during the period. by multiplying the number of units sold by the average cost per unit.7 - 49LIFO Costs of more recent purchased inventories go to COGS. Gives a better reflection of COGS in the IS. Gives a better measure of income.¶ The cost of theoldest units purchased is transferred to COGS¶ The cost of the ¶ COGS is computedFIFO Costs of more recent purchased inventories go to inventory account. Gives a better measure of inventory value on the BS.7 - 50Inventory Method Choice:when there is inflation for the inventory priceCase #1 Sold Old Corn $110 60 $ 50 Case #2 Sold New Corn $110 90 $ 20 Case #3 Sold Mixed Corn $110 75 $ 35Inventory Method Choice:when there is inflation for the inventory priceFIFO COGS INCOME Ending Inventory Total Assets Low High High HighLIFO High Low Low LowSales ($11 x 10 tons) COGS (10 tons) Gross margin1. 2. 3. 4.Suppose the income tax rate is 30%. How much taxes does the firm send to the government when the firm uses FIFO? How much taxes does the firm send to the government if the firm uses LIFO? Which inventory method would a firm use if he wants to minimize taxes?7 - 517 - 52Class Discussion What is the relationship between FIFO/LIFO choice and Perpetual/Period choice? Why not LIFO?The LIFO method of accounting for inventory is primarily a U.S. invention. Many countries around the world will not allow LIFO to be used and other countries discourage its use. The IASC calls LIFO an undesirable but “allowable” method. Inflation and tax effect Timing of purchase7 - 53Class ProblemStocks, Inc. inventory records unit Beg. Bal. Purchase 16/01 Sale, Jan. 25 ($45 per set) Purchase 16/02 Sale, Feb. 27 ($40 per set) Purchase 10/03 Sale, Mar. 30 ($50 per set) 460 110 216 105 307 350 190 28 9,800 36 3,780 cost 30 32 Total costs $13,800 3,520 ,Assuming Stocks, Inc. use periodic inventory system, calculate the COGS under LIFO and FIFO inventory cost flow assumption.7 - 547-10Class ProblemTotal sales are 216 + 307 + 190 = 713 units FIFO unit Beg. Bal. Purchase 16/01 Purchase 16/02 Purchase 10/03 Total COGS 460 110 105 350 cost 30 32 36 28 unit 460 110 105 38 713 cost 30 32 36 28 22,164 unit 148 110 105 350 713 LIFO cost 30 32 36 28 21,540Class Problem (alternative approach)Inv. (beg.) + Purchase – COGS = Inv. (end.) COGS = Inv.(beg.) – Inv.(end.) + Purchase Inv. (beg.) = 460 × $30 = $13,800 Total purchase in dollar: 110 × $32 + 105 × $36 + 350 × $28 = $17,100 How much is the ending inventory? How many units of inventories left. 460 + 110 + 105 +350 – (216 + 307 +190) = 312 units When FIFO is used. Inv (end.) is the inventories most recently purchased, the 312 units are assumed to be from the inventories from purchase on Mar 10. Inv. (end.) = 312 × $28 =$8,736 COGS = $13,800 – $ 8,736 + 17,100 = $22,164 When LIFO is used. Inv (end.) is the inventories least recently purchased, the 312 units are assumed to be from the beginning inventories on Jan 1. Inv. (end.) = 312 × $30 =$9,360 COGS = $13,800 – $ 9,360 + 17,100 = $21,540 7 - 55 7 - 56Class Problem(what if perpetual inventory is used?)The COGS for the 1st sale on Jan. 25.Before sale balance unit Jan. 1 Purchase Jan. 16 460 110 cost 30 32 Inventory sold unit 106 110 216 The COSG for Jan. 25 sale is 106×30 + 110×32 = $6,720 cost 30 32 After sale balance unit 354 0 354 cost 30Class Problem(what if perpetual inventory is used?)The COGS for the 2nd sale on Feb. 27.Before sale balance unit Jan. 1 Purchase Feb. 16 354 105 cost 30 36 Inventory sold unit 202 105 307 The COSG for Feb. 27 sale is 105×36 + 202×30 = $9,840 cost 30 36 After sale balance unit 152 0 152 cost 307 - 577 - 58Class Problem(what if perpetual inventory is used?)The COGS for the 3rd sale on Mar. 30.Before sale balance unit Jan. 1 Purchase Mar.10 152 350 cost 30 28 Inventory sold unit 0 190 190 The COSG for Mar. 30 sale is 190×28 = $5,320 28 cost After sale balance unit 152 160 312 cost 30 28Lecture OutlineRelation between inventory and COGS The items included in inventory Accounting for inventory COGS Valuation Specific identification LIFO FIFO Weighted average Other valuation methods and analysis7 - 59Perpetual PeriodicThus, the total COGS is $6,720 + 9,840 +5,320 =$21,880Lower-of-cost-or-market method Effect of inventory errors Evaluate related ratios7 - 607-11Lower of Cost or Market Ending inventory should be valued at the lower of its cost ($45) or market value ($43) (Rarely record holding gains – conservatism) Market value• Input market – replacement cost (i.e. LIFO cost) • Output market – net realizable value (NRV) or NRV less a normal profit margin • Market value – middle of those three numbersLoss on write-down of inventory(or COGS) Merchandise Inventory 2 27 - 61Valuation of Inventory at Lower-of-Cost-or-Market (存货计价的成本与市价孰低法)Inventory Item Quantity A B C DTotalUnit Cost Price $10.25 22.50 8.00 14.00Unit Market Price $ 9.50 24.10 7.75 14.75Total Cost $ 4,100 2,700 4,800 3,920$15,520Total Market $ 3,800 2,892 4,650 4,130$15,472Lower C or M$ 3,800 2 700 2,700 4,650 3,920 $15,070400 120 600 280The market decline based on individual items ($15,520 – $15,070) = $4507 - 62Inventory Errors Revenue – recognized in the period when earned, realized, realizable Expenses – recognized in the period when they helped to produce revenues Types of Errors• Accidental (wrong amounts, accounts, GAAP, etc.) • Intentional – Profit pressures may cause managers to• Delay the recording of purchases/expenses • Accelerate incomplete sales orders7 - 63Inventory Errors7 - 64Inventory ErrorsInventory Errors An undiscovered inventory error usually affects• All future periods if left undetected • Two reporting periods if detected and correctly counted by the end of the second year• The error will cause misstated amounts in the period in which the error occurred, but the effects will then be counterbalanced by identical offsetting amounts in the following period • If ending inventory is understated, retained earnings is understated • If ending inventory is overstated, retained earnings is overstated7 - 65 7 - 667-12Effects of Inventory Errors on Current Year’s IncomeUnderstate end inventory Overstate end inventory -Understate begin inventory -Overstate begin inventory --The Effect of an Error in Ending Inventory on Income(1)An error in inventory results in COGS being overstated or understated. (2)The ending (2)Th di inventory i error has h the h opposite i effect on gross margin and net income. (3)Any uncorrected error will affect the financial statements for two years. (ending inventory = beginning inventory of next year)7 - 68Sales ( ) COGS (–) COGS: Begin Inventory (+) Purchase (–) End Inventory = COGS Gross Margin Other Operating Expense Net Income----Low High Low -Low--High Low High -HighLow --Low High -HighHigh --High Low -Low7 - 67Inventory Gross Profit and Turnover Gross profit – Sales Revenue less COGS• Expressed in dollar or percentage terms• Sales Revenue $100,000,000 100% • COGS $60 000 000 60% $60,000,000 • Gross Profit Margin $40,000,000 40%Inventory Gross Profit and Turnover Can also be used to save time counting ending inventory, assuming GPM is a constant 40%• Sales Revenue $100 $100 • Cost of Goods Sold ? $60 • Gross Profit Margin (40% x $100) --------------------------------------------------------• Beginning Inventory $50 • Purchases +$70 • Ending Inventory – ?? = $60 • Cost of Goods Sold $60$40• Varies significantly by industry, wholesaler (lower due to volume) versus retailer (higher), presence of R&D, etc.7 - 697 - 70Inventory Gross Profit and Turnover Gross profit percentage can be used to check the accuracy of the accounting records• Unusually lower percentage may mean the company has tried to avoid taxes by failing to record all salesInventory Gross Profit and Turnover Inventory turnoverCost of goods sold Average Inventory 100,000 20,000 + 30,000 = 4 2 Some other factors that may cause a decline in the percentage are• Price wars that reduce selling prices • Shifting of the product mix sold • Increase in shoplifting or embezzlement7 - 71• On average inventory is being stocked/sold four times per year • Higher turnover is associated with greater efficiency (lower costs associated with stocking/handling inventory) • Effective in assessing companies in the same industry Days in inventory365 days / 4 = 91.25• On average inventory is held 91.25 days before it is sold7 - 72。