高考英语图表作文
- 格式:ppt
- 大小:122.50 KB
- 文档页数:2
高考英语指导写作专题:图表说明文一,图表说明1,分类:数字表、函数关系图、曲线图(graph);表格(table);几何图形(figure);图形表、饼状图(pie chart);条状图、柱状图(bar chart);平面图、示意图、外形图(diagram)。
2,一般可分三个层次来写:按照题目要求描述图表反映的总情况,即概括大意。
对数字进行仔细的比较,抓住特点进行分析、归纳并找出产生变化的原因。
读图表后的想法、结论、评论或针对反映出的问题采取的解决措施。
二.表达方式:1,常用的描述句型The table/chart/diagram/graph shows that ...According to the table/chart/diagram/graph...As is shown in the table/chart/diagram/graph...As can be seen from the table/chart/diagram/graph/figures...We can see from the figures/statistics...It is clear/ apparent from the figures/statistics...2.图表中数据(data)的具体表达法数据(data)在某一个时间段固定不变:fixed in time在一系列的时间段中转变:changes over time增加:increase/raise/rise/...减少:decrease/grow down/drop/fall/decline稳定:remain stable3.描写变化的形容词及副词rapid/rapidly,dramatic/dramatically,significant/significantly,sharp/sharplysteep/steeply,steady/steadily,gradual/gradually,slow/slowly,slight/slightly三、写作模板As (is) shown/indicated by the figure/in the table/graph/pie chart/chart,_____ has been increased/decreased significantly/steadily from _____ to_____. From the sharp decline/rise in the chart,it goes without saying that_____.There are at least two reasons accounting for / contributing to ____. On the one hand, _____ On the other hand, _____. _____is due to the fact that_____. In addition,_____is responsible for_____. Maybe there are other reasons to show. But it is generally believed that the above mentioned reasons are commonlyconvincing/persuasive.As far as I am concerned,I hold the view that_____. I am sure my opinion is both sound and well-grounded.四,作文范例1,最近你校对中学生的消费情况进行了调查。
高考英语图表作文In the first graph, we can see a steady increase in the number of people using smartphones over the past decade. This is hardly surprising, given the rapid advancements in technology and the increasing availability of affordable smartphones. It seems that almost everyone has a smartphone these days, and it has become an essential tool for communication, entertainment, and even work.Moving on to the second graph, we can observe a similar trend in the use of social media. The number of active social media users has been steadily rising, with no signs of slowing down. This is indicative of the growing importance of social media in our daily lives, as it has become a primary platform for communication, information sharing, and even advertising.Looking at the third graph, we can see a significant increase in online shopping activities. This is not surprising, given the convenience and accessibility ofonline shopping platforms. With just a few clicks, people can purchase almost anything they need, and have it delivered right to their doorstep. It's no wonder that traditional brick-and-mortar stores are facing increasing competition from online retailers.In summary, these graphs paint a picture of a society that is increasingly reliant on technology for communication, social interaction, and consumption. It's clear that smartphones, social media, and online shopping have become integral parts of our daily lives, and their influence will only continue to grow in the future.。
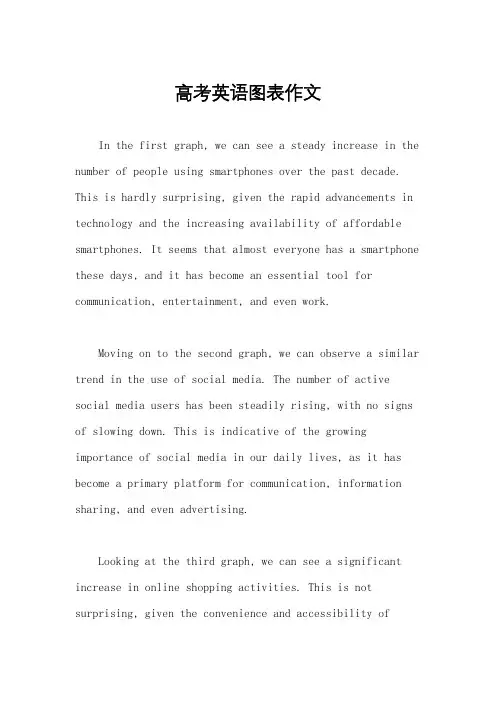
高考英语书面表达练习——图表作文(格式与范例)作文一假如你是李华,在最近的研究性学习当中,受《21世纪中学生英语报》 (The 21st Century )之邀,你对你所在的班60名同学(男女各半)进行了上网目的的调查。
现将调查结果(如下表所示)用英语给报社的编辑写一封信,报道此事,以引起舆论的关注,并提出你的观点和建议。
0%5%10%15%20%25%30%35%40%read newssend e-mailschatstudyplay games注意:1、报道应包括图表所示全部内容,可适度发挥。
2、文章的开头与结尾已给出,不计入总词数。
3、词数: 1504、参考词汇:调查: make a surveyDear editor ,I have recently made a survey among 30 boys and 30 girls in my class about their purpose of getting on the Internet. ______________________________________________[思路点拨]1. 题材:书信; 说明+议论 2. 时态:一般现在时 3. 人称:第三人称 4. 要点提示:(1)上网的目的;(2)读新闻; (3)发送邮件;(4)聊天;(5)学习;(6)玩游戏;(7)评语 5. 篇章结构:文章可分两段[文采修饰]1. 连接词的选用:but, both …, and, moreover, otherwise2. 高级词汇的选用:keep in touch with, as for …, use … as …, benefit from, pay attentionto, altogether, in one ’s opinion.3. 复杂句型的选用:what …most 引导的主语从句;as 引导的让步状语从句;倒装语序等。
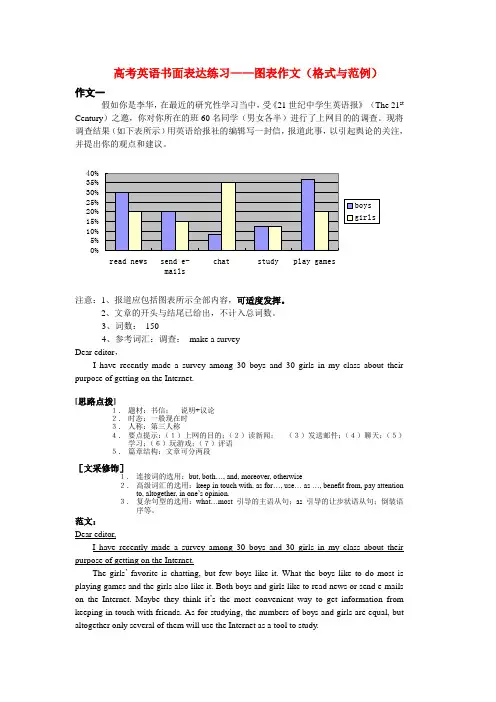
图表分析类受某英文报的委托,你最近对高中生的英语阅读兴趣做了一次调查。
请根据以下信息,用英语为该报写一篇100词左右的短文。
短文的标题及首句已为你写好。
调查内容:在新闻、故事、科普、学习方法四种英文文章中,学生最喜欢哪一种调查范围:湖北省的10所中学调查对象:高中生调查人数:1,000调查方式:访谈调查结果:(见下图)Reading Interests of SeniorMiddle School StudentsRecently,a survey has been done tofind out the reading interests of senior middle school students. In this survey,one thousand senior middle school students from ten schools in Hubei Province were interviewed. They were asked which they liked reading most among the four categories of English articles,news,stories,popular science articles and articles about learning methods.The survey shows that more than half of the students like to read news most. Twentysix percent of the students say that English stories are their favorite. Only seven percent of the students are most interested in reading articles about learning methods. However,the number of students who enjoy reading popular science articles doubles that of those who prefer reading articles about learning methods.柱状图是高中英语课本中常见的图形,要求学生通过柱状图图中数据和提示内容写一短文,属于比较、对照类。

英语作文图表作文(五篇范文)第一篇:英语作文图表作文图表分析作文1As is clearly shown in the table/ figure/ graph / chart, 图表总体描述 between 年代 and 年代.Especially, 突出的数据变化.There are three reasons for 具体表示急剧上升、下降或特殊现象的词.To begin with, 原因一.In addition / Moreover, 原因二.For example, 具体例证.Last but no least, 原因三.In short,总结上文.As far as I am concerned, / For my part, / As for me,作者自己的观点.On the one hand, 理由一.On the other hand, 理由二.In brief,总结上文.图表分析作文2The table / figure / graph / chart shows that 图表总述from 年代to年代.It is self-evident that突出的数据变化.Three possible reasons contribute to 具体表示急剧上升、下降或特殊现象的词或代词代替上文内容.One reason is that原因一.Another reason is that 原因二.For instance,举例证.What’s more原因三.As a result, 重述上文之趋势.However, in my opinion 作者观点.For one thing,理由一.For another, 理由二.T o sum up,总结上文.图表分析作文3It can be seen from the table / figure / graph / chart that图表总述between年代and年代.Especially,突出的数据变化.Why are there such great changes during 图表涉及的年头数years? There are mainly two reasons explaining具体表示急剧上升、下降或特殊现象的词或代词代替上文内容.First,原因一.In the old days,比较法说明过去的情况.But now,说明现在的情况.Second,原因二.As a result,总结上文.In my viewpoint,作者自己的观点.On the one hand,论点一.On the other hand,论点二.图表分析作文4As the table / figure / graph / chart shows,图表总述in the past years年代.Obviously,突出的数据变化.Why are there suchsharp contrasts during 图表涉及的年头 years?Two main factors contribute to具体表示急剧上升、下降或特殊现象的词或代词代替上文内容.First of all,原因一.In the past,比较法说明过去的情况.But now 说明现在的情况.Moreover,原因二.Therefore,总结上文.As I see it,作者自己的观点.For one thing,论点一.For another,论点二.图表作文补充句型• As is shown in the graph…如图所示…•The graph shows that…图表显示…•As can be seen from the table,…从表格中可以看出…•From the chart, we know that…从这张表中,我们可知…• All these data clearly prove the fact that… 所有这些数据明显证明这一事实,即…• The increase of ….In the ci ty has reached to 20%.….在这个城市的增长已达到20%.• In 1985, the number remained the same.1985年,这个数字保持不变.• There was a gradual decline in 1989.1989年,出现了逐渐下降的情况.第二篇:英语图表作文图表描述专题训练(一)这类作文时,注意以下几点:第一,审题时,除了要把握好图表的表层信息外,还要分析图标的深层含义,如原因、根源、可能的发展趋势等。
英语高考作文图表类In the chart, we can see that the number of people using smartphones has been increasing steadily over the past decade. This trend is not surprising, considering the convenience and versatility that smartphones offer in our daily lives.Looking at the data, it is clear that the younger generation is the most avid users of smartphones. This is understandable, as they have grown up in a digital age where smartphones are an integral part of communication and social interaction.Interestingly, the chart also shows that the use of smartphones varies among different regions. While urban areas tend to have higher smartphone usage rates, rural areas are catching up as technology becomes more accessible and affordable.One striking point to note is the impact of smartphoneusage on traditional forms of communication. With the riseof messaging apps and social media platforms, people are increasingly relying on their smartphones to stay connected, leading to a decline in face-to-face interactions and phone calls.Despite the concerns about smartphone addiction and its negative effects on mental health, it is undeniable that smartphones have revolutionized the way we communicate and access information. As technology continues to advance, it will be fascinating to see how our relationship with smartphones evolves in the future.。
英语图表作文模板及范文(通用12篇)(经典版)编制人:__________________审核人:__________________审批人:__________________编制单位:__________________编制时间:____年____月____日序言下载提示:该文档是本店铺精心编制而成的,希望大家下载后,能够帮助大家解决实际问题。
文档下载后可定制修改,请根据实际需要进行调整和使用,谢谢!并且,本店铺为大家提供各种类型的经典范文,如工作总结、工作计划、合同协议、条据文书、策划方案、句子大全、作文大全、诗词歌赋、教案资料、其他范文等等,想了解不同范文格式和写法,敬请关注!Download tips: This document is carefully compiled by this editor. I hope that after you download it, it can help you solve practical problems. The document can be customized and modified after downloading, please adjust and use it according to actual needs, thank you!Moreover, our store provides various types of classic sample essays for everyone, such as work summaries, work plans, contract agreements, doctrinal documents, planning plans, complete sentences, complete compositions, poems, songs, teaching materials, and other sample essays. If you want to learn about different sample formats and writing methods, please stay tuned!英语图表作文模板及范文(通用12篇)英语图表作文模板及范文第1篇The table/chart diagram/graph shows (that)According to the table/chart diagram/graphAs (is)shown in the table/chart diagram/graphAs can be seen from the table/chart/diagram/graph/figures,figures/statistics shows (that)……It can be seen from the figures/statisticsWe can see from the figures/statisticsIt is clear from the figures/statisticsIt is apparent from the figures/statisticstable/chart/diagram/graph figures (that)……table/chart/diagram/graph shows/describes/illustrates图表类英语作文范文The past years have witnessed a mounting number of Chinese scholars returning from overseas.As is lively illustrated by the column chart, the number of returnees climbed from a mere thousand in 20XX to over thousand in 20XX, at an annual increase rate of around 50%.A multitude of factors may have led to the tendency revealed by the chart, but the following are the critical ones from my perspective.First and foremost, along with the development ofChinese economy and society, the number of Chinese studying abroad has been soaring in the past years, which has provided an eXpanding base for the number of returnees.In the second place, the government has enacted a series of preferential policies to attract overseas Chinese scholars back st but not least, the booming economy, science and technology in this country have generated more attative job opportunites for scholars returning from overseas.The waves of returnees will definitely contribute to this nation’s development, since they have brought back not only advanced science and technology but also pioneering concepts of education and management.With more scholars coming back from overseas, and with the concerted efforts of the whole nation,we have reasons to eXpect a faster rejuvenation of this country.更多培训课程:苏州个人提升英语更多学校信息:苏州虎丘区朗阁教育机构咨询电话:英语图表作文模板及范文第2篇Students tend to use computers more and more frequently nowadays.Reading this chart, we can find that the average number of hours a student spends on the computer per week has increased sharply.In 1990, it was less than 2 hours; and in 1995, it increased to almost 4 hours, and in 2000, the numbersoared to 20 hours.Obviously computers are becoming increasingly popular.There are several reasons for this change.First,computers facilitate us in more aspects of life.Also, the fast development of the Internet enlarges our demands for using computers.We can easily contact with friends in remote places through the Internet.Besides, the prices of computers are getting lower and lower,which enables more students to purchase them.However, there still eXist some problems, such as poor quality, out-of-date designs and so on.And how to balance the time between using computers and studying is also a serious problem.Anyhow, we will benefit a lot from computers as long as we use them properly.英语图表作文模板及范文第3篇As can be clearly seen from the graph/table/chart (As is shown in the table/figure), great changed have taken place in_______,The_________have/has skyrocketed/jumped from _____to _____.When it comes to the reasons for the changes,different people give different eXplanations.Here I shall just give a begin with, ______What’s more,___________, Last but not least, ________.While it is desirable that ___________,there are still some problems and difficulties for __________Firstly, __________,In addition, __________,In a word, __________.以上就是为大家整理的英语专四图表作文范文模板,希望能够对大家有所帮助。
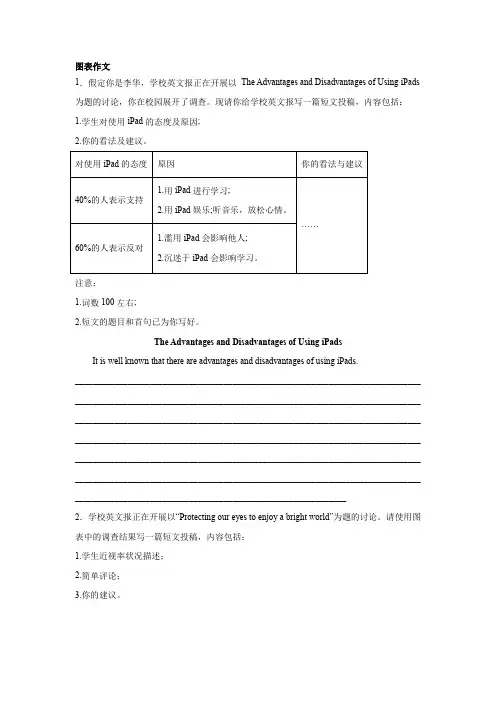
图表作文1.假定你是李华,学校英文报正在开展以The Advantages and Disadvantages of Using iPads注意:1.词数100左右;2.短文的题目和首句已为你写好。
The Advantages and Disadvantages of Using iPadsIt is well known that there are advantages and disadvantages of using iPads._______________________________________________________________________________ _______________________________________________________________________________ _______________________________________________________________________________ _______________________________________________________________________________ _______________________________________________________________________________ _______________________________________________________________________________ ______________________________________________________________2.学校英文报正在开展以“Protecting our eyes to enjoy a bright world”为题的讨论。
英语高考图表作文范文The bar chart shows the percentage of different age groups participating in regular physical exercise. As we can see, the age group of 18-24 has the highest percentage, with over 70% of people engaging in regular physical exercise. On the other hand, the age group of 65 and above has the lowest percentage, with only around 20% of people participating in regular physical exercise.The line graph illustrates the change in the average temperature over the course of a year. It is evident that there is a clear seasonal pattern, with the temperature peaking in the summer months and dropping to its lowest point in the winter. The difference between the highest and lowest temperatures is quite significant, indicating a wide range of temperature fluctuations throughout the year.The pie chart displays the distribution of household expenses in a typical family. It is apparent that the largest portion of the expenses goes towards housing,accounting for nearly 40% of the total expenditure. This is followed by transportation and food, each making up around 20% of the expenses. Other categories, such as healthcare, entertainment, and education, make up the remaining 20% of the household expenses.The table provides information on the top 10 countries with the highest GDP per capita. It is notable that Luxembourg ranks first, with a GDP per capita of over $100,000, followed by Switzerland and Norway. On the other hand, countries like India and Indonesia have significantly lower GDP per capita, with values below $10,000.In conclusion, the various types of graphs and charts provide valuable insights into different aspects of society and the economy. By analyzing and interpreting these visual representations, we can gain a better understanding of the world around us.。

英语一图表类作文1. The chart shows the percentage of people indifferent age groups who use social media on a daily basis. It's interesting to see that the younger generations are the most active users, with over 90% of teenagers using social media every day.2. Looking at the data, it's clear that social media has become an integral part of our daily lives. Even older age groups, such as those over 60, are now using social media regularly, albeit to a lesser extent compared to younger age groups.3. The rise of social media has changed the way we communicate and interact with each other. It has become a primary source of news, entertainment, and connection for many people, regardless of their age.4. However, the chart also highlights the potential negative effects of excessive social media use, such asaddiction, mental health issues, and decreased productivity. It's important for users to be mindful of their usage andset boundaries to maintain a healthy balance.5. In conclusion, social media has undoubtedly revolutionized the way we connect and share information,but it's essential to use it responsibly and in moderationto avoid its negative consequences. Let's embrace the benefits of social media while also being aware of its potential drawbacks.。
高考英语写作素材之作文精选:图表类(共16篇)高考英语写作素材之作文精选:图表类(共16篇)精选范文一:最近,你作为研究性学习课题组的成员就高中英语教材的看法在同学中间开展了一次调查,调查的结果如下:请根据以上调查结果,写一120左右的调查报告。
报告的开头已给出。
I recently surveyed my classmates about their views on the new English textbook…One possible version:I recently surveyed my classmates about their views on the new English textbook. According to the survey, 80% of the students were quite satisfied with it, while 15% disliked it and 5% had no opinion. Students who liked it said the pictures with the texts were very attractive, which greatly aroused their interests in learning. Moreover, the book was very interesting, covering many hot topics and providinglots of cultural knowledge of the world. However, students who disliked it complained there were too many new words and difficult sentences, making the texts difficult to understand. In conclusion, the new English textbook has helped most students improve their English enormously.精选范文二:面对中学生“出国热”,社会对此有不同的看法。
【例文】The average family income in our Kangming City increased from 8,000 yuan per year in 1998 to 20,000 yuan in 2008. In the meantime, the structure of the average family expenses has changed, too. These graphs show the change clearly.The biggest part of the average family expenses is housing. In 1998, the average family spent 25 percent of its income on housing. In 2880, expenses on housing rose to 42 percent. Food and drink are the second biggest part of the average family expenses. In 1998, about 18% of the average income was spent on this item. In 2008, the figure grew to 30%. As a result of such increase in the expenses on housing and food, expenses on other items have been reduced from 57% in 1998 to 28%in 2008.Thus, a conclusion can be drawn that as income increases, people can improve their living step. But still the average family has to spend a large part of income to meet the basic needs.【译文】在我们康明城市家庭平均收入从8000元,每年1998至2008年的20,000元。
图表作文1.Directions: Write an English composition in 120-150 words according to the instructions given below in Chinese.随着电脑普及率的提高,老师、家长和学生对手写字的重视程度降低了。
下图是一项调查显示中学生不想改善字迹的理由。
请说明该现象并发表自己的看法。
_______________________________________________________________________________ _______________________________________________________________________________ _______________________________________________________________________________ _______________________________________________________________________________ _______________________________________________________________________________ _______________________________________________________________________________ __________________________________2.Directions: Write an English composition in 120-150 words according to the instructions given in Chinese.假设你是李华,你的英语老师把你班同学分成几个小组来调查班里患近视(short-sightedness)的同学的人数和原因。
图表式作文It is obvious in the graphic/table that the rate/number/amount of Y has undergone dramatic changes. It has gone up/grown/fallen/dropped considerably in recent years (as X varies). At the point of X1, Y reaches its peak value of ...(多少).What is the reason for this change? Mainly there are ... (多少) reasons behind the situation reflected in the graphic/table. First of all, ...(第一个原因). More importantly, ...(第二个原因). Most important of all, ...(第三个原因).第一段:The table/graph/chart shows, as far as ______(is/are)concerned, _______________________.第二段:(第二段分为三种情况:1、一直上升;2、一直下降;3、一部分上升,一部分下降。
下面针对这三种情况进行结构模仿)。
1、(以1978年到1998年城镇乡村收入的稳步较长图为例)。
a.一直上升According to the figures show in the graph, we can see that________, had been increasing at a steady rate from the year of 1978 to 1998. In addition, during the period, ____________had raise from 349.9 Yuan to 5425 Yuan, morethan 5 times .Meanwhile, _______had also grown from 133.6 Yuan to 2100 Yuan.b. 一直下降According to the figures show in the graph, we can see that___________, had been decreasing at e steady rate from the year of 1978 to 1998. In addition, during the periond,____________had reduced from 349.9 Yuan to 5425 Yuan, more than 5 times .Meanwhile ,_______had also gone down 133.6 Yuan to 2100 Yuan.2、[以从1995年到1999年西安人的日常生活支出(食物、服装和娱乐)的变化为例]c. 一部分上升,一部分下降:According to the figures in the graph, we can see that__________had been increasing by 9% and 7%, respectively from the year of 1995 to1999. However,___________(the expenses on food)had been decline by30% ,during the same period. The statistics of rise and fall seem to exist in isolation but closely to one another. 第三段:There are several reasons for that phenomenon. On the hand, _____;On the other hand,_________,___________.注:横线部分为自己需填充的内容,这只是整篇文章的格式,红色横线部分视考题而定,可填充的内容经济类/发展类/旅游类/文化交流类:1. The policy of reformation and opening spreader widely in China should be taken into account firstly, when considering the reason for the steady increase of the citizen's income.2. The people of China has the spirit of working hard in order to improve their living.3. China's rapid economic development lays the base.4. In the past twenty five years, remarkable changes have taken place in China's tourism rank in the world.5. The economy of China has developed so fast in twenty years that China now becomes more and more important in the world.6. I'm confident that with the development of China the numbers of visitors and the foreign exchange earrings will certainly continues to increase in the future.7. With the rapid development of technology and the global economy ,the world is becoming international, cultural exchanges are becoming more and more frequent ,which is inevitably improving our mutual understanding and friendship with other countries.食品类:1、In order to live a healthy long life, we have to restrict our calorie intake eating the food with less fat.2、We should make our diet more nutritional and balance the calorie intake to enjoy a healthy life.3、To improve the bad situation, people should eat calcium-enriched food, such as fish,milk,beancurd and so on . 娱乐类/体育类:如看书/看电视1、We should make a balance between them to benefit themselves.2、The age in which we live now is an information one.3、People should go to the gym and take part in some sports, such as basketball, volleyball, swimming and so .All the exercise help people keep healthy.友谊类/文化交流类:1、People all over the world love and respect each other. The best way to show our love is to help others when they are in difficulties.2、Everyone should be encouraged required to try to be self-reliant.3、When one in trouble, others should help him.PS:经典句子:1、Scientists have warned that unless effective measures are taken, the problem of pollution will eventually get out of hand.2、For citizens ,they are supposed to conform to rules and regulations of the traffic.3、And the government should educate people in this respect ,which will draw people's attention of the serious problem.4、For drivers their speed should be restricted . Otherwise, they should be punished severely.5、It is time the anchorites concerned took proper steps the traffic problem.6、As long as each of us takes actions. I deeply believe the problem will be well resolved to an extend作文中可用的谚语或句子:As a saying goes:俗话说1、A good beginning is half done. 良好的开端是成功的一半。
高考英语图表作文In this article, we'll take a peek at the trends reflected in the chart about student participation in extracurricular activities.First up, let's talk about the rise in sports participation. It's clear that students are really getting into the swing of things and joining teams or clubs. I mean, who doesn't love the thrill of a game or the camaraderie of a team? It's not just about winning; it's about learning teamwork, discipline, and how to handle pressure.Then there's the steady growth in art and music activities. I bet it's because students are realizing that there's more to life than just studying. Creativity is an essential part of being human, and these activities give them a chance to express themselves in a unique way. Plus, who knows? Maybe some of them will even become the next Beethoven or Picasso!But wait, there's more! The chart also shows a spike in participation in community service. It's really heartwarming to see that students are interested in contributing to society. Helping others not only feels good, but it also teaches valuable life lessons about empathy and responsibility.And finally, we can't forget about the tech。