高考英语图表作文讲解解析
- 格式:ppt
- 大小:783.50 KB
- 文档页数:34
高考英语图表类作文写作技巧讲解一、考点分析图表作文以说明文和议论文为主。
考查时要求学生根据所给的图表、数据等进行分析,阅读文字和说明,然后组织语言进行写作,得出令人信服的结论,必要时还要加入个人观点。
二、专题详解1)文体一:说明文文体特点:(重事实)说明文是以说明为主要表达方式,用简洁明了的语言来解释说明事物,阐明事理。
它要求语言要简明扼要,客观准确。
框架:第一段:概括说明内容常用的词有:1.table, a pie chart饼图, a bar chart柱状图, graph, survey, picture2.describe, show, represent, illustrate, reveal,3. figure, statistic, number, percentage, proportion常用的开篇句型(即概述图表内容时常用的表达法):1.The graph/chart/table above shows / describes / illustrates that...2. From the above graph/chart, it can be seen that…3. As shown in the graph / survey, …4.The chart/table shows the differences between…5. I launched an inquiry into… / I conducted a survey on… / to…第二段:描述变化情况并分析引起变化的因素A. 写作关键:1.对比分析,寻找数据的变化规律;2.筛选数据这些数据是否具有典型代表性、是否需要一一列出?一般而言首尾数字以及增减值是必需的;3.强调数据间的关系,突出变化。
B. 常用词汇和套语:a.描写数据变化常用套语:增加:1.There was a great / stable / slight increase /rise in…倍数:2.The number /rate has nearly doubled, compared with that of last year.3.The number is …times as much as that of….保持不变:4.In 1985, the number remained the same.减少:5. There was a gradual/sharp decline in 1989.分别列举:6. The numbers / percentages are… and…respectively.b.说明因果关系表示原因:as / since / due to / owning to / thanks to / because (of)进一步解释:that is to say / to put it another way表示结果:therefore / thus / as a result ( consequence), so that提示例证:(take…)for example / instance, …such as (一般不用于句首),常用套语:提出第一个原因:The first reason can be seen by every person.The first and most impo rtant reason / One of the premier causes is that…解释某一种现象:…is the cause of ……mainly / partially contribute(s) to the tendency of……account(s) for the fact / phenomenon…总括性解释原因:There exist… reasons, which may account for this difference.The reasons for the phenomenon may be as follows:There are several causes for this significant growth in….例证:This point can be confirmed by the fact / example of + nn + is a case in point.第三段:总结归纳/提议/提出解决办法结尾常用套语1.In my opinion / Perso nally / As far as I’m concerned2.In short/ In brief/ In a word/ In conclusion /In summary/ To sum up,3. From what has been discussed above, we can draw the conclusion that…4. Obviously, if we want to…, it is necessary…/ There is no doubt that atten tion must be paid…2)文体二:议论文文体特点:(重说理)议论文是以议论为主要表达方式的一种文体。
高中英语:图表类书面表达专项讲解【基础回顾】考点归纳:图表式作文在高考这出现的机会较小。
尽管如此,我们还是应对此类作文予以重视,因为图表式作文是通过提供的一组或几组数据来反映某个趋势或某一问题、现象。
要求考生图表中的相关数据进行描述、分析和评论,并得出合乎逻辑的结论。
它是将数据、形象信息转换为文字信息的过程,此类作文最能考查考生逻辑推理的能力。
图表作文命题常用的形式:①数据表格:矩形的竖行和横行进行排列的表格,它反映的是多种事物的相互关系;②饼状图:它用来表示各事物在总体中所占的比例及相互关系;③柱状图:它用来表示几种事物的变化情况及相互关系;④曲线图:它常用来表示事物的变化趋势;⑤混合式:既有柱形图又有饼状图或表格或曲线图等。
基础必读:图表式作文的写作必读第一步审题图表类作文的审题与其他类型的作文相比难度较大,主要表现在考生不易准确、全面地把握图表显示的信息。
因此要通过审题抓住主要数据反映的主要问题即所要表达的要点;通过审题确立表达时所要用的时态:特定时间用过去时;经常出现的情况或自己的评述用一般现在时。
第二步谋篇做图表类书面表达时,常采用三段式的谋篇方法:Para1概述图表所反映的信息;Para2分析现象产生的原因或根据题中所提供的原因进行叙述;Para3展望未来或提出问题的方法、建议或希望。
第三步表达1.概述图表所反映的信息时要注意就图表中那些最有代表性、规律性的数字,或变化大的数字进行重点阐述。
尽量避免简单罗列数据,报流水账;2.善于抓住总的规律、趋势对现象产生到的原因利用合理想象来进行分析或据题中所提供的原因进行叙述。
如利用数据进行有力的论证;3.展望未来或提出解决问题的方法、建议或希望时要紧紧围绕主题去展开。
切忌游离主题而任意发挥;4.适当运用高级词汇并灵活运用图表类写作常用的经典句型。
图表式作文的描述方法第一种情况:横向对比。
描述这种图表需要对比各种数据间的差别,主要以数值、倍数、排列等方式来描述。
图表作文本节内容一)图表作文写作要求图表作文就是把非文字信息(通常为各种图表表示的数字信息等)转换成文字信息的一种作文。
它要求我们用文字来描述非文字性的图表或对图表显示的关系作解释说明。
图表作文一般在题目中给出作文的标题和一个或几个统计表格、圆图形、曲线图或条形图,有时还用英文或中文提纲的形式给出提示,具体要求:1. 用文字描述图表,客观解释图表中所传递的信息,并找出某种规律或趋势;2. 就图表中所反映的某种趋势或问题分析其原因或后果。
图表作文着重说明事实,常常通过对图表中所反映的具体数据的说明、分析、比较,对某种事物或现象的事实或变化情况等加以说明,并提出结论或看法。
因此,图表作文常常采用议论文的写作方法。
二)写作步骤1.仔细阅读图表,了解图表所达的内容。
首先,用一句话概括图标的内容。
2.描写图表所反映的问题或规律3.结尾部分得出结论,表述自己的观点,结束全文。
(1)如果图表反映的是好的现象,首先要肯定、发表观点最后预测未来;(2)如果图表反映的是不好的现象,首先要否定、提出解决办法或建议三)写作实用表达(一)点明主题引用具体或粗略的数据,然后作出概括性分析,点名主题或引出需要论述的问题。
常用的词有:1.泛指一份数据图表:a data graph/chart/diagram/illustration/table饼图:pie chart 表格图:table 柱形图:bar chart趋势曲线图:line chart / curve diagram2.describe, show, represent, illustrate, reveal等等。
3. figure, statistic, number, percentage, proportion常用的开篇句型(即概述图表内容时常用的表达法)1.The graph/chart/table above shows / describes / illustrates that.....2. From the above graph/chart, it can be seen that…3. As is shown in the graph…4.The chart/table shows the differences between…5. According to the table/pie chart/ graph/bar graph, we can see/conclude that …(二)分析差异描写变化及总趋势特征、分析差异:数据说明常用套语:1.There was a great /slight increase /rise in…2.The number /rate has nearly doubled, compared with that of last year.3.The number is …times as much as that of….原因说明常用套语:1.The reason for…is that…2.The change results from the fact that…3.There are several causes for this significant growth in…. To begin with .... In addition/ Furthermore/ Moreover,...4. There are many factors that may account for...but the following are...(三)得出结论结尾常用套语1. Personally/ as far as I’m concerned/ in short/ in brief/ in conclusion /in summary2. It’s clear/evident from the chart that… / We can draw the conclusion that…3. From what has been discussed above/Taking into account all these factors, we can draw the conclusion that…4. There is no doubt that special attention must be paid to the problem of...5. It is high time that we put an end to the tendency of...图表作文常用单词、词组和句型总结:1)表示数据变化的单词或词组rapid/ rapidly 迅速的,飞快的,dramatic/ dramatically 急剧的sharp /sharply 明显的,急剧的significant/ significantly 重大的sradual/ gradually 渐进的,逐渐的steady / steadily 稳固的stable / stably 稳定的slow /slowly 缓慢的slight / slightly 略微的2)在描述中常用到的词汇significant changes 图中一些较大变化noticeable trend 明显趋势distribute 分配in terms of/ regarding/ with regard to/ as far as sth is concerned 关于,就...而言3) 描述增减变化常用的句型Compared with … is still increased by …The number of … grew/rose from … to …An increase is shown in …; then came a sharp increase of …In … the number remains the same/drops to …There was a very slight (small/slow/gradual) rise/increase in ......There was a very steady (marked/sharp/rapid/sudden/dramatic) drop (decrease/decline/fall/reduction) in ....../ compared with that of last year).4) 图表作文常用句型精选1. The table shows the changes in the number of.....over the period from....to......该表格描述了在...年至...年间...数量的变化。
作文题型分析讲解一.专题知识梳理——图表作文、图片作文知识点1:图表作文一. 图表作文考查形式:1. 是以表格形式,将统计的数据或被说明的事物直接用表格形式体现出来,即统计表。
2. 是以图形形式◆表示数据变化的曲线图;◆表示数据的大小或数量之间的差异的条形图;◆表示总体内部结构变化的扇形图。
二. 图表作文常用的写作模板参考模板一:As is shown/indicated/illustrated by the figure/percentage in the table(graph/picture/pie/chart), ______ (作文题目的议题) has been on rise/ decrease (goes up /increases / drops / decreases),significantly /dramatically /steadily rising /decreasing from ______ in ______ to______ in ______. From the sharp/marked decline/ rise in the chart, it goes without saying that______.There are at least two good reasons accounting for ______. On the one hand, ______. On the other hand, ______ is due to the fact that ______. In addition, ______ is …参考模板二:According to the graph, ______ (图表结果). The ______ amount rises from _____ to______ while ______ climbs from ______ to ______(数据), both of which demand our prompt attention. As a citizen/student, my suggestions to ______ (点出主题)are listed as follows.To begin with, ______ (建议一). ______(观点). In addition, ______ (建议二). ______(观点). Thirdly, ______ (建议三). ______(观点).In a word, only if we pay much attention to our everyday behavior and take actions to _________(重申主题), can we make contributions to __________.(美好生活的向往)三. 图表写作常用句型及短语1.The data from the pie chart shows that _______ ranks first at 58%, which is followed by_____ at 33%. However, the least proportion goes to _________ at only 9%.(图表数据类文章第一段可能遇到的经典句型)2. The graph/chart/table above shows…3. From the above graph/chart, it can be seen that...4. As (正如) is shown in the graph, ...5. It has been shown from the table that…Facts1. There was a great /slight increase /rise in…2. There has been a sudden/slow/rapid fall/drop in…3. The rate dropped slightly from 38%in…to 31% in…4. By comparison with, it decreased/increased/fell from…to…5. Statistics show a 20% rise/reduction in traffic accidents compared with last year.6. The population owning mobile phones increased by 10% in 1999.Reasons:1. The reason why/for…is that…2. One may think of the change as a result of…3. The change in … largely results from the fact that…4. This brings out the important fact that…5. ... is the key factor (因素) in…6. There are several causes for this significant growth in….First,….Second,…总结归纳:1. in a word ,/ in short,(简而言之)/ generally speaking(总的来说)2. In summary, it is important…3. From what has been discussed above, we can draw the conclusion (得出结论)that…4. Obviously/Apparently 很明显地), if we want to…, it is necessary…提出建议:1. There is no doubt that (毫无疑问) attention must be paid to…2. I suggest (建议)the government take effective measures to …3. Personally, I think(就我来看) the “golden week” should remain, for…逻辑过渡词:常用转折,对比及比较的词汇:While, but, on the contrary, however, compare with, in contrast to ,as…as, the same as, be similar to, more than, less than常用描写趋势变化的词汇:表示上升的动词increase, rise, go up,表示下降的动词reduce, drop, go down, fall,表示平稳及其他remain, slowly, slightly, gradually, sharply, rapidly, the number of…, from…to 及比较级,倍数句型等。
图表作文详细指南图表作文一般是对某个具体问题的调查或统计,通常以表格或图形来呈现,常常反映出一个普遍的问题。
体裁多为说明文、议论文。
考生需根据图片提供的数据和文字进行分析,并过渡到普遍现象。
常见的命题形式有表格、柱状图、饼状图、曲线图等。
写作时需要介绍图表中数据有什么变动,反映了哪些问题和趋势,并分析问题或数据背后的原因, 结合自己的看法谈谈解决措施或给出观点。
近三年考情风向标年份卷别话题命题形式20232022全国乙卷如何在课堂外学英语图表半开放式2021看图可知,图表类作文考试频率不算高,但是我们还是要了解基本写作方法,有备无患。
写作技巧点拨I.审题1.审读图表,比较数据,得出变化规律,提炼要点2.分析要点,确立主题;3.灵活运用横向对比,即描述数据的变化;纵向说明,反映出问题。
II.三步成文第一步:开门见山,点明图表所反映的现象第二步:分析图表所示内容的原因或进行评论第三步:归纳总结或发表评论,提供建议等语料赋能1.图表类型graph 曲线图figure 几何图形pie chart 饼状图bar chart 柱状图diagram 平面图、示意图table 表格2.数据表达50% of...../fifty percent of .... ...的百分之五十Half of the ... 一半A quater of 四分之一3 quaters of 四分之三Nine out of ten / nine in ten 十个中有九个The majority of ... 大多数the minority of 少数Account for 70 percent 占百分之703.常用句型开头:1.As can be indicated in the table... 正如表格所表明2.As is revealed in the table... 如图所示3.According to the figures given in the table... 根据表中的数据4.This chart shows that... 图表表明5.As is clearly shown by the graph... 正如图像所示6.It can be seen/concluded from the statistics that... 从数据可知7. from the chart , we can see that...主体:(数据描述)1.A is by far the largest... A是目前最大的.....2.The figure has nearly doubled/tripled, as against that of last year. 与去年相比,数据几乎翻了两倍/三倍3.There is a slight/slow/steady/rapid rise in population. 在人口方面有轻微的/缓慢的/稳定的/迅速的增长.4.As is shown/demonstrated in the graph , great changes have taken place in... 如图所示,....发生了巨大变化5.Sth.be on the increase//rise/decline/ decrease ....正在增长/减少6.It has decreased /increased by 30% compared with last year. 与去年相比,已经增长了30%。

高中英语新高考-英语作文:图表题指导与解读(热点话题:消费)考查图表的描述一般还是要慎重地,因为图表描述属于相当高层次地写作了,多出现在雅思托福写作中。
一方面要考查读图能力,另外一方面要把图转换成文,比较耽误时间的。
所以江苏在用图表加文字的形式,这样通过文字的描述也很大程度上辅助考生转换图表。
但下面作文就是一张图,然后让概括。
而概括和描述还有区别。
我以为单纯考数据图表不是和高考命题思想一致的。
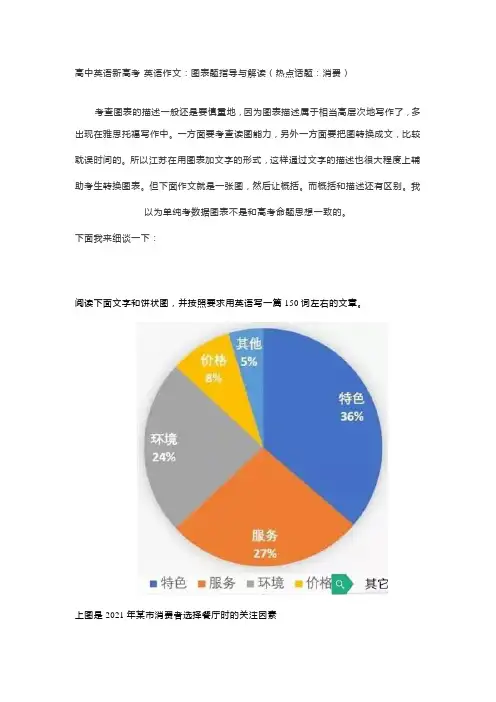
下面我来细谈一下:阅读下面文字和饼状图,并按照要求用英语写一篇150词左右的文章。
上图是2021年某市消费者选择餐厅时的关注因素1.用约30个词概括上图内容;2.请简要分析以上因素影响消费者选择的原因;3.谈谈你就餐的关注因素,并用2-3个理由或论据支撑你的看法。
注意:作文中不能出现真实姓名和学校名称。
第一部分30个词的概括图表描述,关键是找准比例的主体,请思考:36%的主体:消费者还是特色?选择前者:36%的消费者选择特色选择后者:特色在所有的因素中占36%结合提示信息:2017年某市消费者选择餐厅时的关注因素,应该取后者。
如果有学生取前者,也没问题。
其次要会基本的数据表达,再复杂的数据,也要简化成:在……中,A占多少比例。
这就是:Among …, A makes up / accounts for …%.注意:Among后一定是一个名词,这个名词后会可能带上一个后置定语或定语从句。
分析:核心词为“因素”,后面带上后置定语:消费者选择餐厅时的。
这样就可以写成:As is illustrated in the chart, among factors influencing diners’ choice of a restaurant, distinctive features rank first, accounting for 36%. Next come service and the dining environment, 27% and 24% respectively. Others like price make up the least proportion.这样描述是详细描述图表,但是根据要求“概括”,所以还要去掉细节:As is illustrated in the chart, among factors influencing diners’ choice of a restaurant, distinctive features rank first. Next come service and the dining environment. Others like price make up the least proportion.积累词汇:占据:make up, account for分别是:… and … respectively占据首位:rank first, take a lion’s share, be in the lead; top the list其次是:Next comes…对比范文:A survey was conducted in a city in 2017 about factors contributing to diners’ preference of a restaurant. Flavor features, service and the dining environment made up the biggest proportion.个人之见:这个描述完全忽略了最小值,但是熟悉雅思图表描述的都知道,图表描述一般抓两头,即最大和最小,这样才能形成对比,从而挖掘规律。
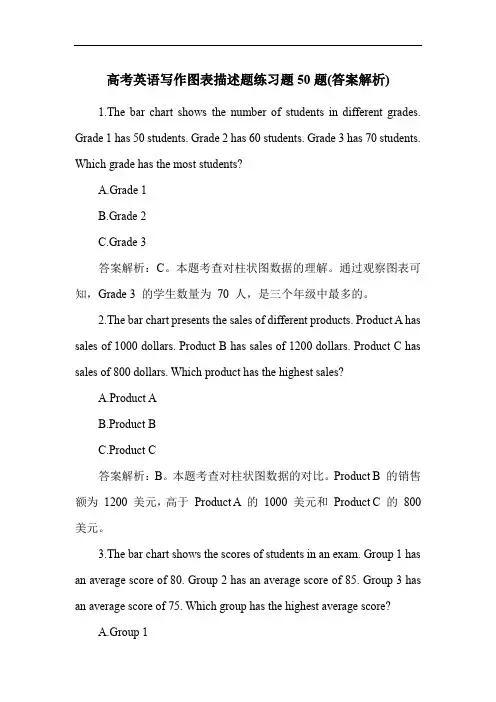
高考英语写作图表描述题练习题50题(答案解析)1.The bar chart shows the number of students in different grades. Grade 1 has 50 students. Grade 2 has 60 students. Grade 3 has 70 students. Which grade has the most students?A.Grade 1B.Grade 2C.Grade 3答案解析:C。
本题考查对柱状图数据的理解。
通过观察图表可知,Grade 3 的学生数量为70 人,是三个年级中最多的。
2.The bar chart presents the sales of different products. Product A has sales of 1000 dollars. Product B has sales of 1200 dollars. Product C has sales of 800 dollars. Which product has the highest sales?A.Product AB.Product BC.Product C答案解析:B。
本题考查对柱状图数据的对比。
Product B 的销售额为1200 美元,高于Product A 的1000 美元和Product C 的800 美元。
3.The bar chart shows the scores of students in an exam. Group 1 has an average score of 80. Group 2 has an average score of 85. Group 3 has an average score of 75. Which group has the highest average score?A.Group 1B.Group 2C.Group 3答案解析:B。


专题08图表类写作-新高考英语写作精讲+写作模板距离高考还有一段时间,不少有经验的老师都会提醒考生,愈是临近高考,能否咬紧牙关、学会自我调节,态度是否主动积极,安排是否科学合理,能不能保持良好的心态、以饱满的情绪迎接挑战,其效果往往大不一样。
以下是本人从事10多年教学经验总结出的以下学习资料,希望可以帮助大家提高答题的正确率,希望对你有所帮助,有志者事竟成!养成良好的答题习惯,是决定高考英语成败的决定性因素之一。
做题前,要认真阅读题目要求、题干和选项,并对答案内容作出合理预测;答题时,切忌跟着感觉走,最好按照题目序号来做,不会的或存在疑问的,要做好标记,要善于发现,找到题目的题眼所在,规范答题,书写工整;答题完毕时,要认真检查,查漏补缺,纠正错误。
总之,在最后的复习阶段,学生们不要加大练习量。
在这个时候,学生要尽快找到适合自己的答题方式,最重要的是以平常心去面对考试。
英语最后的复习要树立信心,考试的时候遇到难题要想“别人也难”,遇到容易的则要想“细心审题”。
越到最后,考生越要回归基础,单词最好再梳理一遍,这样有利于提高阅读理解的效率。
另附高考复习方法和考前30天冲刺复习方法。
2.(改编自2022春·河南安阳宝丰县第一高级中学校高三联考)假期社区活动你调查了某科技企业人员构成,请参照下列图表将调查结果发表在学校英文报上。
内容包括:1.调查结果概述;2.对人员构成做出评价;3.对此现象提出看法。
注意:1.词数100左右;2.短文的题目和首句已为你写好。
参考词汇:大学本科生Undergraduate 大学专科生Junior college students硕士生Master studentPersonnel Composition of an EnterpriseNowadays, with the high demand of skills in the enterprise, there is an increase in the advanced workers with a higher diploma.________________________________________________________________________________________ ____________________________________________________________________________________________ ____________________________________________________________________________________________ ____________________________________________________________________________________________ ____________________________________________________________________________________________ ____________________________________________________________________________________________ ____________________________________________________________________________________________ ______________________________________________________【答案】Personnel Composition of an EnterpriseNowadays, with the high demand of skills in the enterprise, there is an increase in the advanced workers with a higher diploma.As is shown in the pie chart, the percentage of workers with high diplomas is the main formation of the enterprise. Undergraduates cover 28% of the whole staff. Also, there are respectively 33% master students and 39% junior college students.As far as I’m concerned, it is a trend that in the near future, people with no advanced knowledge can not find their dream work, since with the development of science and technology, there are critical demands for workers. For us students, it is our duty to study more knowledge and skills to meet the needs of society. Only when we are equipped with enough knowledge and more abilities can we get on well in society.【简要分析】本篇书面表达属于图表类写作。
英文图表作文分析1.图表分析作文的种类图表就是数字、图像传达信息的一种形式,图表分析作文就是将这些数字、图像所包含的信息转换成传神表意的说明文字。
图表的种类很多,一般把各种数字资料,按照一定的顺序,通过表格形式表现出来的叫表(table),利用点、线、图等把信息资料通过图像表现出来的叫图(graph或chart),常用的图形有柱形图(bar graph),曲线图(line graph),圆形图(circular graph),图解图(diagram),饼形或百分比图(pie or percentage graph),象形图(pictorial graph),流程图(flow chart)等等。
2.图表分析作文的写作要领2.1. 读懂标题,然后根据主题进行分析。
虽然文章的中心思想和细节是通过图表来表示的,但同一张图表,如果命题不同,作者观察、分析问题的角度就有所不同,写出的短文也可能完全不同。
请看下面两个圆形图:上面两张图如果命题为“The Similarities and Differences of the Two Marketing Concepts”,本文可以首先对两张图分别进行说明,对两种观念的异同进行比较,然后得出结论;如果命题为“The Development of Marketing Concept”,本文的重点则偏重于市场营销观念的变化及其变化的原因。
写作时可首先指出两种观念的重点虽然明显不同,但后者显然脱胎于前者,然后再分析这种观念变化的原因。
请比较下面两篇文章:例文①:The Similarities and Differences of the Two Marketing ConceptsLet us take a look at the two circular graphs and compare the similarities and differences of the two marketing concepts.The concepts illustrated in Fig.1and Fig.2 are roughly the same in their main business mentality and tactics.Both are new and advanced concepts in business administration.Moreover,both lay stress on an orientation predominated by market demand.The latter,however,is also quite different from the former.First,the marketing focal point in Fig.1 is not the same as the in Fig.2.In the former,meeting consumers' needs and making a profit form the basis of business operations,while in the latter social long-term interests are also taken into account.Second,the former only considers two aspects of the problem in supplying products and services. But in contrast,the latter has to achieve a better balance between the three aspects—business profit,consumer demand and public social interests.Therefore,the latter is more advanced and more beneficial to social development.In addition,it has a more practical and revolutionary significance.例文②:The Developm ent of Marketing ConceptLet us take a look at the two circular graphs and analyze the causes for the development of marketing concepts.Fig.2 is quite different from Fig.1,but is obviously born out of Fig.1.The former refers to the concept predominated by market demand,whose stress is laid on the link between consumer demand and business profit,while the latter stands for the one led by society and market demand,which emphasizes the balance between social public interests,consumer demand and business profit.Some reasons may account for the development of marketing concept.First,consumer demand is not always in agreement with social long-term interests.For example,when household appliances with great power consumption do not accord with the demands of economy on electricity,companies should consider improving on the product from social long-term interests.Second,meeting consumer demand on short-term basis is no longer business standard of conduct.A company,which can meet bothconsumers current demands and social long-term interests is more welcomed.Finally,in commodity production,companies should pay attention to environmental protection and ecological balance,because they are closely related to consumers and society.It is just because of these that comes the development of marketing concept.2.2.仔细分析图表,尽可能正确理解图表的真正含义。
高考英语作文复习--图表类作文专题讲解第一类:图表类作文写作步骤:1.点明图表所反映的主题。
常用词汇:table, chart, figure, graph, describe, tell,show, represent等2.分析数据差异及趋势或者描写数据代表内容。
注意层次。
常用词汇:rise,increase, drop, reduce, decrease, fall. but, on the contrary, however, the same as, be similar to, be different from 等3.归纳总结或发表自己看法。
常用词汇:in a word, in short, to sum up, We candraw the conclusion that……等。
重点句子:一.引入话题1.It can be seen from the table that….2.As is indicated in the chart,….3.From the sharp rise (上升n.) / decline (下降n.) in the chart, it goes withoutsaying that….(不用说…)4.It has gone up(上升) / fallen / dropped(下降) considerably in recent years.二.描述变化或原因1.表示递进what’s more, besides, in addition, furthermore, to makematters worse, what’s worse (更糟糕的是)2.表示解释account for , that is to say, mean, in other words3.表示变化---快速上升rise (increase / go up ) sharply (quickly, rapidly)Eg: The number sharply went up.---缓慢下降decrease (reduce/ come down/ decline/ drop/ fall) slowly---表示对比compare with , contrary to, on the contrary4.描述多重原因---There are several reasons behind the situation reflected in the above table. First of all, ……; More importantly,…….; Most importantly,……..;---There are at least two good reasons accounting for this phenomenon. On one hand,…….; On the other hand,………; In addition,…. is responsible for….三.总结或评论1.Personally speaking, in a word, in conclusion,2.It can be concluded that….(可以得出结论,)3.From the above discussion, we have enough reasons to predict what will happenin the near future.4.The trend described in the table will continue for quite a long time if necessarymeasures are not taken.5.As far as I’m concerned, I hold the view that……6.I’m sure my opinion is both sound and well-grounded. (既合理又理由充分)写作模版:1.分析图表数字代表内容Ascan be seen from the chart, _____________________(话题).Different people hold different opinions on this matter.Obviously, the majority of the people believe that ______________. However, others (20%) consider that_______________. Besides, another 5% hold the view that_______________.As far as I am concerned, we should pay more attention to __________. On one hand, ________________. On the other hand, __________________.2.分析数字反映的原因As can be seen from the chart, ____________________(话题). Different people hold different opinions. About 60% of the people ____________, while 25% of the people ______________.The least people, accounting for 15%, _______________.Various reasons are responsible for their different choices. To begin with, ___________. What’s more, ______________.Besides, _____________.As far as I am concerned, I am in favor of the view that_____________. I believe that ___________________.或As far as I am concerned, despite such problems, I hold the view that we should ________________. Only in this way can we _______________.图表类作文实战1:下面的图表显示了你们学校高三学生周末放假的学习生活情况。