高考英语作文_图表作文
- 格式:ppt
- 大小:1.39 MB
- 文档页数:28
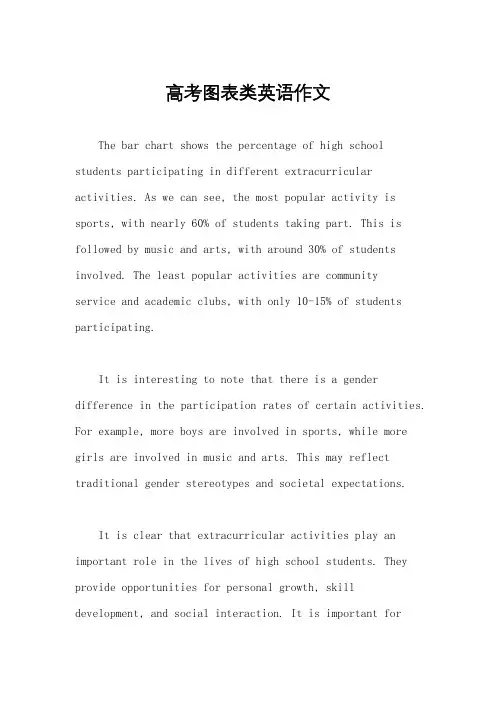
高考图表类英语作文The bar chart shows the percentage of high school students participating in different extracurricular activities. As we can see, the most popular activity is sports, with nearly 60% of students taking part. This is followed by music and arts, with around 30% of students involved. The least popular activities are communityservice and academic clubs, with only 10-15% of students participating.It is interesting to note that there is a gender difference in the participation rates of certain activities. For example, more boys are involved in sports, while more girls are involved in music and arts. This may reflect traditional gender stereotypes and societal expectations.It is clear that extracurricular activities play an important role in the lives of high school students. They provide opportunities for personal growth, skill development, and social interaction. It is important forschools to offer a wide range of activities to cater to the diverse interests and talents of their students.In conclusion, the bar chart highlights the diverse range of extracurricular activities that high school students are involved in. It also reveals the gender differences in participation rates. Overall,extracurricular activities are an integral part of the high school experience and contribute to the holistic development of students.。
图表型英语作文模板篇一:英语作文图表类提纲类作文写作模板第一部分、写作模板——图表式作文It is obvious in the graphic/table that the rate/number/amount of Y has undergone dramatic changes. It has gone up/grown/fallen/dropped considerably in recent years (as X varies). At the point of X1, Y reaches its peak of …(多少).What is the reason for this change? Mainly there are …(多少) reasons behind the situation reflected in the graphic/table. First of all, …(第一个原因). More importantly, …(第二个原因). Most important of all, …(第三个原因).From the above discussions, we have enough reason to predict what will happen in the near future. The trend described in the graphic/table will continue for quite a long time (if necessary measures are not taken括号里的使用于那些不太好的变化趋势).第二部分、写作模板——提纲式作文一、说明原因型模块(一)Nowadays , there are more and more XX in some big cities . It is estimated that ( 1 ). Why have there been so many XX ? Maybe thereasons can be listed as follows.The first one is that ( 2 ) .Besides, ( 3 ) . The third reason is ( 4 ). To sum up , the main cause of XX is due to ( 5 ) .It is high time that something were done upon it. For one thing , ( 6 ). On the other hand , ( 7 ). All these measures will certainly reduce the number of XX .注释:(1)用具体数据说明XX现象;(2)原因一;(3)原因二;(4)原因三(5)指出主要原因;(6)解决建议一;(7)解决建议二。
图表英语作文英文回答:Chart and graphs are powerful tools for conveying information and illustrating trends, comparisons, and relationships. They provide a visual representation of data, making it easier to understand and draw meaningful conclusions. Charts and graphs can be used in various fields, including business, science, education, and healthcare.One of the most common types of charts is the bar chart. Bar charts are used to compare different values. The height or length of each bar represents the value being compared. Bar charts can be used to illustrate trends, such as sales figures over time, or to compare different categories, such as the sales of different products.Another common type of chart is the line chart. Line charts are used to show how a value changes over time. Theline on the chart connects the data points, creating avisual representation of the trend. Line charts can be used to illustrate trends in stock prices or economic indicators.Pie charts are used to show the proportion of different parts of a whole. Each slice of the pie represents adifferent part, and the size of the slice corresponds tothe proportion of the whole. Pie charts can be used to illustrate the composition of a population, such as the percentage of people in different age groups.Scatterplots are used to show the relationship between two variables. Each point on the scatterplot represents a data point, and the position of the point on the graph shows the values of the two variables. Scatterplots can be used to identify correlations between variables, such asthe relationship between height and weight.Histograms are used to show the distribution of data. Histograms divide the data into bins, and the height ofeach bin represents the number of data points that fall within that bin. Histograms can be used to illustrate thedistribution of incomes in a population or the distribution of test scores.Charts and graphs are an essential tool for communicating information. They provide a visual representation of data, making it easier to understand and draw meaningful conclusions. By understanding the different types of charts and graphs, you can effectively communicate information and make informed decisions.中文回答:图表是传达信息、展示趋势、比较和关系的有力工具。

高考英语作文万能模板徐磊高考英语作文万能模板。
一、图表作文。
Recently, there has been a heated discussion about the topic of (图表主题). From the bar chart/line graph/pie chart, we can see that (具体数据描述). It is obvious that the data is of great significance and deserves our attention.The reasons behind this phenomenon can be various. On the one hand, (原因一). On the other hand, (原因二). Moreover, (原因三). All these factors contribute to the trend shown in the chart.In my opinion, we should take effective measures to deal with this issue. For one thing, (解决方法一). For another, (解决方法二). Only in this way can we turn the situation around and bring about positive changes.To sum up, (总结观点). As long as we make concerted efforts, I am sure that we can overcome the difficulties and achieve our goals.二、观点对比类作文。
Nowadays, with the rapid development of society, the issue of (观点对比主题) has aroused wide public concern. People's opinions on this issue vary from person to person.Some people hold the view that (观点一). They believe that (理由一). Moreover, (理由二). Therefore, they are in favor of the idea that (观点一的结论).However, others have a different perspective. They argue that (观点二). According to their point of view, (理由一). In addition, (理由二). As a result, they advocate the idea that (观点二的结论).As far as I am concerned, I am inclined to side with the former/latter opinion. On the one hand, (支持的理由一). On the other hand, (支持的理由二). Therefore, I firmly believe that (我的观点).In conclusion, (总结观点). Only by taking a rational and objective attitude can we come up with the best solution to the issue of (观点对比主题).三、议论文。
英语作文图表题数据描述1When it comes to describing data in a chart for an English composition, it is crucial to be both accurate and comprehensive. Let's assume we are dealing with a line graph that shows the number of students participating in different extracurricular activities over a period of five years.The overall trend of this line graph is rather interesting. There is a clear upward trend in the number of students joining sports activities. For instance, in the first year, the number was only about 50, but it gradually increased over the years. By the fifth year, the number reached a high of around 150. On the other hand, the number of students involved in art activities shows a fluctuating pattern. It started at around 80 in the first year, then dropped to 60 in the second year, bounced back to 90 in the third year, and finally settled at around 70 in the fifth year.The minimum number among all the activities throughout the five - year period was the number of students in music activities in the second year, which was only 30. While the maximum number was the 150 students in sports activities in the fifth year. By carefully observing and analyzing these key data points and trends, we can effectively convey the information presented in the chart.When dealing with a chart in an English composition, it is crucial to accurately describe the data it presents. Let's assume we have a bar chart that shows the favorite sports among students in a certain school.The chart is divided into several columns representing different sports such as football, basketball, tennis, and swimming. Looking at the heights of the bars, we can see that football has the highest bar, indicating that it is the most popular sport among the students. The number of students who like football is significantly higher compared to those who prefer other sports. Basketball comes second in popularity, with a bar that is about two - thirds the height of the football bar. Tennis and swimming have relatively lower bars, showing that fewer students choose these sports as their favorites.The relationship between these data is quite clear. Football's dominance might be due to its wide - spread popularity globally and the fact that it is often promoted more in schools. Basketball also has a large following, but not as much as football. The lower numbers for tennis and swimming could be because they require more specialized equipment or facilities. By analyzing these data in the chart, we can gain a better understanding of the students' sports preferences.When dealing with a chart in an English composition, it is crucial to present the data information comprehensively. Let's take a line graph showing the population growth in a certain city over the past decade as an example.The title of the graph is "Population Growth in [City Name] from 2014 - 2024". The horizontal axis represents the years, starting from 2014 and ending at 2024, while the vertical axis indicates the population number.In the early years, from 2014 to 2016, the population showed a relatively slow growth rate. The increase was only about 5% during this period. However, between 2016 and 2018, there was a significant jump. The population increased by approximately 15%, which might be due to some economic opportunities emerging in the city at that time. Then, from 2018 to 2022, the growth rate slowed down again, with an increase of around 8%. In the last two years, from 2022 to 2024, the growth rate remained stable, with a marginal increase of about 3%. This shows that the population growth in this city has been fluctuating over the past decade, influenced by various factors such as economic development, policy changes and environmental conditions.4When dealing with chart - based English composition, it is essentialto accurately describe the data presented in the chart and then dig deeper into the implications behind these figures. For instance, if we have a chart showing the sales volume of different types of books in a bookstore over a certain period. Let's assume that the data shows that novels account for 40% of the total sales, textbooks 30%, self - help books 20% and children's books 10%.This data reflects some interesting phenomena. The high percentage of novel sales might be due to the fact that people, especially students and young adults, are eager to explore fictional worlds for relaxation and inspiration. Novels often offer an escape from the daily routine. Textbooks having a significant share could be because of the compulsory nature in educational settings. Self - help books are becoming more popular as people are constantly seeking ways to improve themselves in this highly competitive society. However, the relatively low percentage of children's books might imply that either the bookstore doesn't stock a wide variety of appealing children's books or that parents are more inclined to buy books from specialized children's bookstores. In conclusion, by carefully analyzing the data in the chart, we can gain a better understanding of the reading preferences and related social phenomena.5When it comes to describing data in a chart for an English composition, it is crucial to present the information clearly andcomprehensively. Let's take an example of a pie chart showing the hobbies of students in a class.The pie chart is divided into several sectors, each representing a different hobby. For instance, if reading takes up 30% of the chart, it means that nearly one - third of the students in the class like reading as their hobby. Then, sports might account for 25% of the chart, indicating that a quarter of the students are interested in sports. Music could be 20% of the chart, showing that one - fifth of the students enjoy music. And other hobbies such as painting, dancing, etc., make up the remaining 25%.We can see that reading is the most popular hobby among these students as it has the largest proportion. On the contrary, the hobbies in the "other" category are the least popular as they share the smallest percentage. By directly stating these data, we can effectively convey the basic content of the pie chart.。
图表类的英语作文The pie chart shows the distribution of household expenses in the United States. As we can see, the largest portion of the expenses goes to housing, accounting for 33% of the total. This is followed by transportation at 17%, food at 13%, and healthcare at 8%. Other expenses,including entertainment, clothing, and education, make up the remaining 29%.Moving on to the bar graph, it illustrates the average monthly temperature in a city over the course of a year. We can observe that the temperature starts off relatively low in January, gradually increases, and reaches its peak in July. After that, it begins to decrease again, hitting the lowest point in December. This pattern reflects the typical seasonal changes in temperature.Next, the line graph depicts the fluctuation of stock prices for a particular company over the span of one year. It shows that the stock prices experienced a sharp increasein the first quarter, followed by a slight dip in the second quarter. However, they rebounded in the third quarter and remained relatively stable in the fourth quarter. This indicates the company's performance and the market's reaction to it throughout the year.Finally, the scatter plot displays the relationship between the amount of studying and the grades achieved by a group of students. It reveals that there is a positive correlation between the two variables, as students who study more tend to achieve higher grades. However, there are also outliers, suggesting that other factors may come into play in determining academic performance.In conclusion, these various types of charts and graphs provide valuable insights into different aspects of data and can be used to better understand and analyze complex information.。
高考图表作文英文作文The chart shows the percentage of high school graduates attending college from 2010 to 2020. In 2010, the percentage was 65%, and it increased to 70% in 2015. However, it dropped to 68% in 2020.The bar graph illustrates the average monthly income of different age groups in 2019. People aged 25-34 had the highest average monthly income, while those aged 45-54 had the lowest.The pie chart depicts the distribution of leisure activities among teenagers. Watching TV and using social media accounted for the largest proportion, followed by sports and outdoor activities.The line graph displays the trend of air pollution levels in a city from 2015 to 2020. There was a significant decrease from 2015 to 2017, but it started to rise again in 2018 and continued to increase until 2020.The table compares the consumption of fast food in three different countries. The United States had the highest consumption, followed by the United Kingdom and Canada.The scatter plot shows the relationship between hours of study and exam scores. It indicates a positive correlation, as students who studied more hours tended to achieve higher scores.The diagram represents the sources of greenhouse gas emissions. It reveals that the majority of emissions come from the energy sector, followed by agriculture and industrial processes.The flow chart illustrates the process of recycling plastic bottles. It involves collection, sorting, cleaning, shredding, melting, and finally, the production of new plastic products.。
![图表分析型英语作文[1]](https://uimg.taocdn.com/8e9da73ccec789eb172ded630b1c59eef8c79ae2.webp)
图表分析型英语作文Sample 1 More Candidates for Civil Servants1.根据下图描述报考公务员人数变化的趋势2.分析导致这种趋势的原因3.你的建议As is shown in the bar chart, the number of applicants for civil servants has increased abruptly—by about 10 times, from 100,000 in 2003 to 1,000,000 in 2005.Several factors may contribute to the rush. First and foremost, working as civil servants in China is relatively stable, and Chinese people have a traditional preference for maintaining a life-long career. The rising interest could also be attributed to the unique social status. Comparatively speaking , civil servants are generally highly respected by common people in China. Last, we should not neglect the benefits such as the welfare in government departments.Compared with the striking number of applicants for becoming civil servants, the vacancies issued by the government are scarce.Thus, it is suggested that applicants should weigh their own advantages and disadvantages in case that they would blindlySample 2 College Students’ Booklist1.这是一所大学里学生所购书籍的变化2.你对于学生选择书记类别变化的评价3.哪类书籍你买得比较多?说明原因.198519952005 Philosophy & Society45%23%13%Novels33%17%5%Foreign Language11%31%39%Computer Science2%19%30%Others9%10%13% The table shows the changes of students’ choices of various kinds of books from1985 to 2005. Obviously enough, the number of novels and books of philosophy and society has declined gradually, with that of foreign languages books and computer science ones enjoying much more popularity.Though different readers have their own particular tastes, this phenomenon involves several complicated factors.Firstly, nowadays, most of the college students tend to buy more books concerning foreign languages learning and computer-science, mainly because there is a pressing need of foreign languages and computer skills for their future employment. Secondly, novels are still popular though the selling number decreased thanks to the availability of the Internet. Most of popular books could be read on line.I always buy books of computer science, firstly because it is my major. Secondly, it is well known that computer science often witnesses the fastest changes, thus in order to keep up with the pace, I have to constantly arm myself with new information.enjoy much more popularity. tend to do sth. 倾向于books concerning (有关于) foreign languages learning…thanks to the availability of the Internet. 多亏了网络的便利性on line 在线it is well known that computer science often witnesses (见证了) the fastest changeskeep up with the pace 跟上步伐I have to constantly arm myself with new information.Sample 3 Directions: For this part, you are allowed 30 minutes to write a composition on the topic How People Spend Their Holidays. You should write at least 120 words, and base your composition on the table and the outline given below:1、根据上表,简要描述1990年、1995年、2000年某城市人们度假方式的情况及其变化;2、请说明发生这些变化的原因;3、得出结论。
图表作文1.Directions: Write an English composition in 120-150 words according to the instructions given below in Chinese.当今社会,短视频已成为高中生获取信息的渠道之一,日前,某网站对某地高中生使用短视频的现状作了调查,结果如下:请简单描述该图表,并结合自身或他人情况,谈谈你的看法。
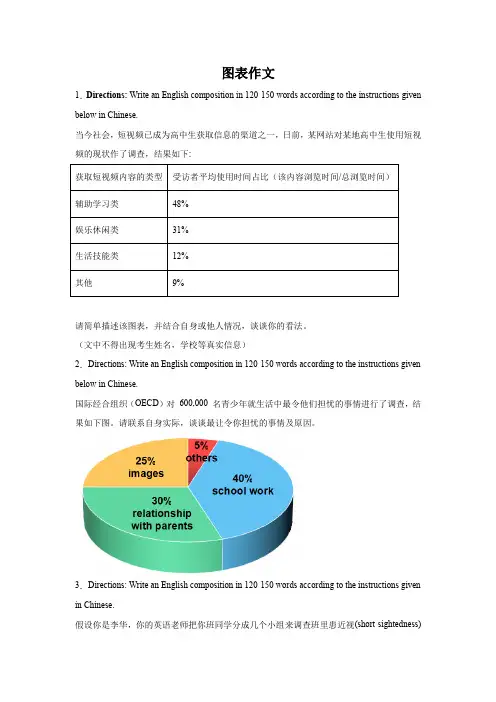
(文中不得出现考生姓名,学校等真实信息)2.Directions: Write an English composition in 120-150 words according to the instructions given below in Chinese.国际经合组织(OECD)对600,000 名青少年就生活中最令他们担忧的事情进行了调查,结果如下图。
请联系自身实际,谈谈最让令你担忧的事情及原因。
3.Directions: Write an English composition in 120-150 words according to the instructions given in Chinese.假设你是李华,你的英语老师把你班同学分成几个小组来调查班里患近视(short-sightedness)的同学的人数和原因。
你们小组调查后做了如下图所示的统计,请分析下面的饼状图,并谈谈你的看法及建议。
注意:1. 词数100左右;2. 可以适当增加细节,以使行文连贯。
_______________________________________________________________________________ _______________________________________________________________________________ _______________________________________________________________________________ _______________________4.Directions: Write an English composition in 120-150 words according to the instructions given in Chinese.下列图表反映的是某高中2010年与2013年学生健康状况调查的部分数据,请你用英语为某报写一份报告,反映你校三年间学生健康状况的变化情况,分析其中原因,并提出一些改进措施。
英语作文图表类范文Here is an essay on the given topic of "English Essay Sample with Graphs and Tables" with more than 1000 words, written entirely in English without any additional punctuation marks.Effective Communication through Graphical RepresentationsIn the realm of academic and professional writing, the seamless integration of textual information and graphical elements has become an essential skill. Graphical representations, such as charts, tables, and diagrams, possess the remarkable ability to convey complex data and ideas in a concise and visually appealing manner. By strategically incorporating these visual aids, writers can enhance the clarity, comprehension, and overall impact of their written work.One of the primary advantages of using graphical representations is their ability to organize and present data in a structured and readily understandable format. Tables, for instance, excel at displaying numerical information or categorical data in a clear and systematic manner. They allow readers to quickly compare and contrast different values or characteristics, enabling them to identify patterns, trends, and relationships that may not be immediately apparent in apurely textual format.Similarly, charts and graphs offer a powerful means of visualizing quantitative data. Bar graphs, line charts, and scatter plots can effectively illustrate trends, distributions, and correlations, making complex information more accessible and digestible for the reader. These visual tools can often convey the essence of a dataset more effectively than a dense paragraph of text, allowing the audience to grasp the key insights at a glance.Beyond numerical data, graphical representations can also be employed to simplify and clarify conceptual information. Flowcharts, for example, can be used to map out step-by-step processes or decision-making frameworks, providing a clear and logical flow of information. Venn diagrams, on the other hand, can be instrumental in demonstrating the relationships and overlaps between different concepts or categories.The strategic placement of graphical elements within a written work can also serve to enhance the overall organization and readability of the text. By positioning relevant charts, tables, or diagrams alongside the corresponding textual explanations, writers can create a seamless integration of visual and verbal content, guiding the reader through the information in a logical and intuitive manner.Moreover, the use of graphical representations can help to break up the monotony of dense textual passages, making the written work more visually appealing and engaging for the reader. Carefully selected and well-integrated graphics can serve as visual anchors, directing the reader's attention and aiding in the retention of key information.However, the effective incorporation of graphical elements in writing is not without its challenges. Writers must ensure that the chosen graphics are truly relevant and add value to the content, rather than serving as mere decorative elements. Additionally, it is crucial to maintain consistency in the style, formatting, and labeling of the graphical representations, as this can significantly impact the overall coherence and professionalism of the written work.Furthermore, writers must be mindful of the accessibility considerations when incorporating graphical elements. Ensuring that the graphics are legible, appropriately sized, and accompanied by clear captions or textual descriptions can make the information accessible to a wider range of readers, including those with visual impairments or other accessibility needs.In conclusion, the strategic use of graphical representations in writing can be a powerful tool for enhancing communication and comprehension. By skillfully integrating charts, tables, and othervisual aids, writers can effectively convey complex information, highlight key insights, and engage their audience in a more meaningful and impactful way. As the demand for clear and visually appealing communication continues to grow, the ability to effectively leverage graphical elements in written work will become an increasingly valuable and sought-after skill.。

图表描述类英语作文(4篇)图表描述类英语作文篇一The above bar chart informs us of the phenomenon that there exist some differences in additional working hours among diverse careers, especially between self-employed businessmen and civil servants. Self-employed businessmen spend nearly 2 hours per day in working overtime. On the contrary, civil servants’ additional working hours is the shortest, only less than 50 minutes per day. The overtime of scientific researchers, cultural and sports workers and teachers is 80 minutes, 70 minutes and 55 minutes respectively.Ample reasons can account for this phenomenon. Firstly, to make more profits, self-employed businessmen have to spend more time in manufacturing products, attracting customers, providing after-sale services and managing staff. Moreover, with the competition becoming fiercer, they have no alternative but to work overtime to avoid being eliminated by the market and their rivals. When it comes to civil servants, things have gone otherwise. Confronted with less risks as well as pressures and leading a steady and routine life, they don’t have to work overtime frequently.Working overtime is a two-bladed sword. Surely, it will generate considerable benefits. However, it will give rise to some damages, especially to our health. We should balance our work, life and health or we will eventually become a machine and salve of work.四级英语作文图表类篇二图片模板:It seems to me that the cartoon / drawing issending a message about ____________(图画内容),which reveals ____________(稍作评价).In myperspective of view, ____________ (表明个人观点)。
图表英语作文范文带翻译Title: The Importance of Graphs and Charts in Presenting Information。
Graphs and charts play a crucial role in conveying complex information effectively. In today's data-driven world, they are indispensable tools for analyzing trends, making comparisons, and illustrating relationships. This essay will explore the significance of graphs and charts in presenting information, examining their various types, and discussing their advantages and limitations.To begin with, graphs and charts offer a visual representation of data, which enhances understanding and interpretation. For instance, a line graph can illustrate changes over time, such as fluctuations in stock prices or temperature variations throughout the year. Similarly, a bar chart can depict comparisons between different categories, like sales figures for various products or the population distribution across different regions. Bypresenting data visually, graphs and charts simplify complex information, making it easier for audiences to grasp key insights at a glance.Moreover, graphs and charts facilitate data analysis by highlighting patterns and trends. Through visualizations, researchers and analysts can identify correlations, outliers, and other significant features in the data. For example, a scatter plot can reveal the relationship between two variables, such as the correlation between study hours and exam scores. By plotting data points on a graph, patterns emerge, enabling researchers to draw conclusions and make informed decisions based on evidence.Furthermore, graphs and charts aid in effective communication by presenting information in a clear and concise manner. In presentations or reports, visual aids like pie charts or histograms can convey key findings more compellingly than lengthy text or numerical tables. Visual representations engage audiences and help them absorb information more readily. Additionally, graphs and charts can be customized with colors, labels, and annotations toemphasize important points or differentiate between data sets, enhancing clarity and impact.However, it is essential to acknowledge the limitations of graphs and charts. While they excel at summarizing large datasets and identifying trends, they can also oversimplify complex phenomena. Misleading visualizations, such as distorted scales or truncated axes, can distort the true nature of the data and lead to erroneous conclusions. Therefore, it is crucial to critically evaluate the design and accuracy of graphs and charts to ensure they accurately represent the underlying information.In conclusion, graphs and charts are invaluable tools for presenting information effectively in various fields, from scientific research to business analytics. They offer visual clarity, facilitate data analysis, and enhance communication by simplifying complex concepts. However, it is essential to use them judiciously and critically evaluate their accuracy to avoid misinterpretation. Ultimately, when used appropriately, graphs and charts are powerful instruments for conveying insights and drivinginformed decision-making.标题,图表在呈现信息中的重要性。
关于图表的英语作文Certainly! Here's an example of an English essay about charts:The Power of Visual Representation: Understanding ChartsIn the age of information overload, the ability to convey complex data in a clear and concise manner is crucial. One of the most effective tools for this purpose is the chart. Awell-designed chart can simplify data, making it accessible and understandable to a wide audience. This essay willexplore the different types of charts, their uses, and the importance of proper design in creating effective visual representations.Types of ChartsCharts come in various forms, each serving a distinct purpose. The most common types include:1. Bar Charts: These are ideal for comparing quantitiesacross different categories. They can be vertical orhorizontal and are particularly useful when there are many categories to compare.2. Pie Charts: Pie charts are excellent for showing the proportion of parts to a whole. They are visually appealingand can quickly convey the relative sizes of different segments.3. Line Graphs: Line graphs are perfect for displaying trends over time. They are particularly useful when data points are numerous and the focus is on how values change over a period.4. Scatter Plots: These charts are used to show the relationship between two variables. They are useful for identifying correlations and patterns that might not be immediately apparent.5. Histograms: Histograms are similar to bar charts but are used to represent the distribution of a dataset. They are particularly useful in statistics to show the frequency of data points within certain ranges.Uses of ChartsCharts are used across various fields and for different purposes:- In business, they help in making strategic decisions by visualizing sales trends, market shares, and customer demographics.- In education, they are used to explain complex concepts by breaking them down into visual components.- In science, they are essential for presenting experimental data and results.- In media, they are used to report statistics and trends to the public in an easily digestible format.Importance of DesignThe design of a chart plays a critical role in its effectiveness. A poorly designed chart can lead to confusion and misinterpretation of data. Key design principles include:- Clarity: The chart should be easy to understand at a glance. - Consistency: The use of colors, fonts, and symbols shouldbe consistent throughout the chart.- Simplicity: Avoid overcrowding the chart with too much information.- Legibility: Text should be large enough to read, and labels should be clear and concise.ConclusionCharts are powerful tools in our visual toolkit. They can transform complex data into easily digestible information, making it accessible to a non-specialist audience. By understanding the different types of charts and adhering to good design principles, we can ensure that our visual representations are both informative and engaging.This essay provides a general overview of charts, their types, uses, and the importance of design in creating effectivevisual representations.。
英语高考图表作文范文The bar chart shows the percentage of different age groups participating in regular physical exercise. As we can see, the age group of 18-24 has the highest percentage, with over 70% of people engaging in regular physical exercise. On the other hand, the age group of 65 and above has the lowest percentage, with only around 20% of people participating in regular physical exercise.The line graph illustrates the change in the average temperature over the course of a year. It is evident that there is a clear seasonal pattern, with the temperature peaking in the summer months and dropping to its lowest point in the winter. The difference between the highest and lowest temperatures is quite significant, indicating a wide range of temperature fluctuations throughout the year.The pie chart displays the distribution of household expenses in a typical family. It is apparent that the largest portion of the expenses goes towards housing,accounting for nearly 40% of the total expenditure. This is followed by transportation and food, each making up around 20% of the expenses. Other categories, such as healthcare, entertainment, and education, make up the remaining 20% of the household expenses.The table provides information on the top 10 countries with the highest GDP per capita. It is notable that Luxembourg ranks first, with a GDP per capita of over $100,000, followed by Switzerland and Norway. On the other hand, countries like India and Indonesia have significantly lower GDP per capita, with values below $10,000.In conclusion, the various types of graphs and charts provide valuable insights into different aspects of society and the economy. By analyzing and interpreting these visual representations, we can gain a better understanding of the world around us.。
英语作文图表分析范文(汇总30篇)(经典版)编制人:__________________审核人:__________________审批人:__________________编制单位:__________________编制时间:____年____月____日序言下载提示:该文档是本店铺精心编制而成的,希望大家下载后,能够帮助大家解决实际问题。
文档下载后可定制修改,请根据实际需要进行调整和使用,谢谢!并且,本店铺为大家提供各种类型的经典范文,如工作总结、工作计划、合同协议、条据文书、策划方案、句子大全、作文大全、诗词歌赋、教案资料、其他范文等等,想了解不同范文格式和写法,敬请关注!Download tips: This document is carefully compiled by this editor. I hope that after you download it, it can help you solve practical problems. The document can be customized and modified after downloading, please adjust and use it according to actual needs, thank you!Moreover, our store provides various types of classic sample essays for everyone, such as work summaries, work plans, contract agreements, doctrinal documents, planning plans, complete sentences, complete compositions, poems, songs, teaching materials, and other sample essays. If you want to learn about different sample formats and writing methods, please stay tuned!英语作文图表分析范文(汇总30篇)英语作文图表分析范文第1篇图表类写作模版(1)模版1According to the chart / graph / diagram / table, we clearly learn that _________.As early as _________,___________.Then,_________.Last,__________.In contrast, by _________,__________.There are many reasons accounting for _________.Firstly, _________.Secondly,__________.Finally,_________.As a result,_________.As far as I am concerned,_________.For one thing,__________.For another,________.In brief, I hold that__________.(2)模版2What is shown in the chart / graph / diagram / table above indicates that in recent years, more and more people payattention to _________.The number of those who _________has increased ________,and furthermore,____________.There are two factors responsible for the changes.In the first place,_________.Moreover,__________.Yet, it is noticeable that __________.From the analysis, we can safely draw the conclusion that__________.It is possible that in the future,the tendency will__________.(3)模版3As is shown in the chart / graph / diagram / table above,__________has charged drastically in the past _________.While ___________,now the percentage of__________is __________.Meanwhile,the number of _________has soared up to ________.There are mainly two possible reasons contributing to the rapid changes.The first is that _________.Secondly,__________.In my point of view, the changes have a great influence on _________.At the same time,_______.To sum up ,_________.英语作文图表分析范文第2篇1、图形种类及概述法:泛指一份数据图表: a data graph/chart/diagram/illustration/table饼图:pie chart直方图或柱形图:bar chart / histogram趋势曲线图:line chart / curve diagram表格图:table流程图或过程图:flow chart / sequence diagram程序图:processing/procedures diagram2、常用的描述用法The table/chart diagram/graph shows (that)According to the table/chart diagram/graphAs (is)shown in the table/chart diagram/graphAs can be seen from the table/chart/diagram/graph/figures,figures/statistics shows (that)……It can be seen from the figures/statisticsWe can see from the figures/statisticsIt is clear from the figures/statisticsIt is apparent from the figures/statisticstable/chart/diagram/graph figures (that)……table/chart/diagram/graph shows/describes/illustrates how……3、图表中的数据(Data)具体表达法数据(Data)在某一个时间段固定不变:fiXed in time在一系列的时间段中转变:changes over time持续变化的data在不同情况下:增加:increase / raise / rise / go up ……减少:decrease / grow down / drop / fall ……波动:fluctuate / rebound / undulate / wave ……稳定:remain stable / stabilize / level off ……最常用的两种表达法:动词+副词形式(Verb+Adverb form)形容词+名词形式(Adjective+Noun form)英语作文图表分析范文第3篇雅思考试学术类图表作文分析考试学术类图表作文要求考生观察一幅图表并用自己的语言呈现出图表中的信息。
高考图表作文英文作文范文The bar chart shows the percentage of high school students who choose different majors in college. It's quite interesting to see that the majority of students choose to major in business, while the least popular major is engineering.Looking at the pie chart, we can see the distribution of college majors among male and female students. It's clear that there is a gender disparity in certain majors, with engineering and computer science being predominantly male, while education and healthcare are predominantly female.The line graph illustrates the change in the popularity of different majors over a 10-year period. It's evidentthat there have been fluctuations in the popularity of certain majors, with business and healthcare experiencing steady growth, while engineering and computer science have seen a decline in popularity.It's worth noting that the choice of college major can have a significant impact on future career prospects. Students should carefully consider their interests and strengths when making this important decision.In conclusion, the data presented in the charts highlights the trends and disparities in the choice of college majors among high school students. It's important for students to make informed decisions based on their individual passions and career goals.。