3D Effects on Vortex-Shedding Flow and Hydrodynamic Coefficients of A Vertically Oscillati
- 格式:pdf
- 大小:1.65 MB
- 文档页数:10

基于 LES 方法的增升装置气动噪声特性分析卢清华;陈宝【摘要】在气动噪声数值计算中,流场的求解精度对涡流扰动的细节计算以及声学的求解结果有着重要的影响。
本文应用 LES 方法对增升装置的流场进行数值模拟,采用可穿透积分面的 Ffcows Wil1iams-Hawkings(FW-H)积分方法进行远场噪声计算。
采用圆柱绕流算例对本文的数值计算方法进行了验证,验证结果表明:本文所使用的LES 方法能准确地捕捉到涡脱落、流动分离等非定常流动现象,可为远场气动噪声的计算提供精确的近场流动的数值解;基于 FW-H 的声类比方法能够精确高效求解远场气动噪声。
在此基础上,对增升装置噪声产生的流动特性、远场特性、风速影响等进行了数值模拟研究。
结果表明:缝翼产生气动噪声的主要原因是,流动在缝翼和主翼之间的凹槽形成的不稳定波以及缝翼钝后缘的小脱落涡;襟翼产生气动噪声的主要原因是,襟翼附近由于流动分离产生的高频的小尺度不稳定涡和低频的大尺度涡。
%The accuracy of flow field has a significant impact on the details of vortex turbu-lence and aeroacoustic calculationresults.LES method is used for high lift device flow field simu-lation,and Ffcows Williams-Hawkings integral surface is used for far-field noise calculation.In this paper,numerical results are validated comparing withtest results of flow around cylinder, comparison shows that LES method used in this paper can capture unsteady flow like vortex shedding and detachment,and provide accurate near field flow solution for the following far field noise calculation,acoustic analogy based on FW-H equation can solve far-field noise accurately and efficiently.Based on this,the flow characteristics,far-field characteristics and flow speed in-fluence of high liftdevice noise generation are numerically studied in this paper.Results show that the slat noise is mainly caused by the unstable turbulence betweenslat and main element of high lift device and slat trailing edge vortex shedding;while the flap noise is mainly caused by small scale high frequency and large scale low frequency vortices generated around the flap.【期刊名称】《空气动力学学报》【年(卷),期】2016(034)004【总页数】8页(P448-455)【关键词】LES;FW-H;增升装置;脱落涡;气动噪声【作者】卢清华;陈宝【作者单位】中国航空工业空气动力研究院,黑龙江哈尔滨 150001;中国航空工业空气动力研究院,黑龙江哈尔滨 150001【正文语种】中文【中图分类】V211.3随着社会的发展和工业技术的进步,国际社会对民用航空业的环保要求越来越苛刻,如何进一步降低飞机的噪声是民用航空业目前面临的一个重要问题。

第24卷第12期 V ol.24 No.12 工 程 力 学 2007年 12 月 Dec. 2007 ENGINEERING MECHANICS153———————————————收稿日期:2006-03-25:修改日期:2006-07-16基金项目:国家自然科学重点基金资助项目(50639030);教育部博士点基金资助项目(20050423002)作者简介:*黄维平(1954),男,浙江人,教授,博士,博导,主要从事海洋工程研究(E-mail: wphuang@); 王爱群(1955),男,山东人,教授,学士,主要从事水利学试验研究(E-mail: ghaq@);李华军(1962),男,山东人,教授,博士,博导,院长,主要从事海洋工程研究(E-mail: huajun@).文章编号:1000-4750(2007)12-0153-05海底管道悬跨段流致振动实验研究及涡激力模型修正*黄维平,王爱群,李华军(中国海洋大学海岸与海洋工程研究所,青岛 266071)摘 要:对输送液体的模型管道进行了涡激振动试验研究,试验结果表明:当理论涡脱频率与管道的固有频率不一致时,作用在振荡管道上的涡激力并非简谐扰力,而是具有一定带宽的窄带随机扰力。
因此,管道的涡激振动响应也是一个随机过程。
当理论涡脱频率与管道的固有频率接近时,管道的涡激振动响应逼近简谐振动。
试验结果也表明:作用在振荡圆柱体上的涡激力频率不仅是流速和圆柱体直径的函数,也是圆柱体固有频率的函数。
关键词:海底管道;涡致振动;试验研究;斯特罗哈频率;涡激升力 中图分类号:TU311.3 文献标识码:AEXPERIMENTAL STUDY ON VIV OF SPAN OF SUBSEA PIPELINEAND IMPROVED MODEL OF LIFT FORCE*HUANG Wei-ping , WANG Ai-qun , LI Hua-jun(Institute of Coastal and Offshore Engineering, Ocean University of China, Qingdao 266071, China)Abstract: Tests for the vortex-induced vibration (VIV) of the models of subsea pipeline with internal flow have been carried out. The results show that if there is a big difference between vortex shedding frequency and natural frequency of cylinder, the lift force acting on oscillating cylinder is a stochastic force with narrow bandwidth and if there is a little difference between them, the response of models is periodic oscillation. It is also revealed that the frequency of vortex shedding on oscillating cylinder will change with not only the velocity of fluid and the diameter of the cylinder, but also natural frequency of the cylinder.Key words: subsea pipeline; VIV; experimental study; Strouhal frequency; lift force浅海石油开发中,由于海底冲刷而导致海底管道出现悬空现象常常困扰油田的安全生产,悬跨段的流致涡激振动将引起管道的疲劳破坏。


低矮结构流场英语English:Low aspect ratio (LAR) structures in a flow field can significantly alter the flow behavior compared to high aspect ratio (HAR) structures. LAR structures have a shorter span compared to their chord length, resulting in a rectangular shape with more vertical walls. This causes the flow to interact differently with the surface compared to HAR structures, leading to separated flow, vortex shedding, and boundary layer transition. These flow mechanisms can also cause an increase in drag and noise generation. In order to mitigate these effects, several methods have been proposed, such as riblets or spanwise wall oscillations. Additionally, the use of active flow control techniques, such as synthetic jets or plasma actuators, can modify the flow near the surface and improve overall aerodynamic performance. Therefore it is important to consider these flow characteristics when designing LAR structures, and utilize techniques to optimize the flow behavior.Translated content:低纵横比(LAR)结构在流场中与高纵横比(HAR)结构相比,可能显著改变流动特性。
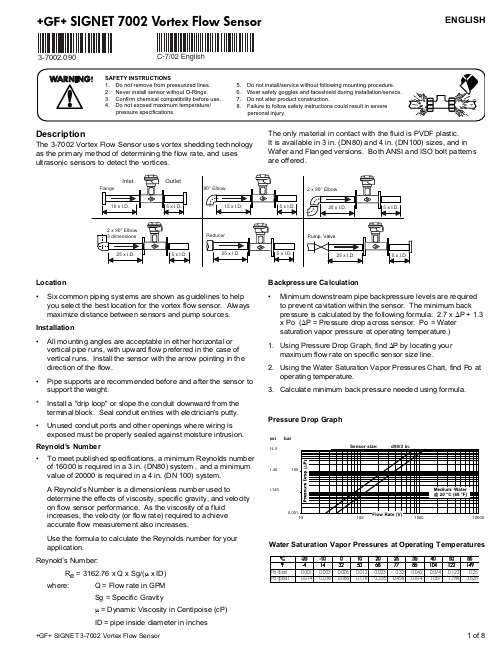
‡ SIGNET 7002 Vortex Flow SensorENGLISH3-7002.090DescriptionThe 3-7002 Vortex Flow Sensor uses vortex shedding technology as the primary method of determining the flow rate, and uses ultrasonic sensors to detect the vortices.The only material in contact with the fluid is PVDF plastic.It is available in 3 in. (DN80) and 4 in. (DN100) sizes, and in Wafer and Flanged versions. Both ANSI and ISO bolt patterns are offered.Location •Six common piping systems are shown as guidelines to help you select the best location for the vortex flow sensor. Always maximize distance between sensors and pump sources.Installation •All mounting angles are acceptable in either horizontal or vertical pipe runs, with upward flow preferred in the case of vertical runs. Install the sensor with the arrow pointing in the direction of the flow.•Pipe supports are recommended before and after the sensor to support the weight.*Install a "drip loop" or slope the conduit downward from the terminal block. Seal conduit entries with electrician's putty.•Reynold’s Number •value of 20000 is required in a 4 in. (DN 100) system.on flow sensor performance. As the viscosity of a fluid increases, the velocity (or flow rate) required to achieve accurate flow measurement also increases.application.Reynold’s Number:R e = 3162.76 x Q x Sg/(µ x ID)where:Q = Flow rate in GPMSg = Specific Gravityµ = Dynamic Viscosity in Centipoise (cP)ID = pipe inside diameter in inchesBackpressure Calculation •Minimum downstream pipe backpressure levels are required to prevent cavitation within the sensor. The minimum back pressure is calculated by the following formula: 2.7 x ∆P + 1.3x Po (∆P = Pressure drop across sensor. Po = Water saturation vapor pressure at operating temperature.)ing Pressure Drop Graph, find ∆P by locating yourmaximum flow rate on specific sensor size ing the Water Saturation Vapor Pressures Chart, find Po atoperating temperature.3.Calculate minimum back pressure needed using formula.Pressure Drop GraphC-7/02 EnglishInstallation•Proper alignment of the sensor with gaskets and flanges is necessary to assure a uniform flow profile through the sensor.•Space flanges in the piping system according to the length of the vortex flow sensor body.•Observe torque recommendations.•Mounting hardware, gaskets and piping system components (shown with broken lines in the diagrams below) are not furnished with the vortex flow sensors.•For flange versions: Bolt length approximations shown in the table above include two flange adapters, two flange rings and a gasket, all typical of +GF+ SYGEF-PVDF piping systemcomponents, plus nuts and washers.•For wafer versions: If the application requires operationoutside the range 15 to 35° C (59 to 95° F), then the accessory Spring Kit (3-7002.391) is necessary to relieve the forces due to thermal expansion of PVDF material and/or to prevent leakage during cooling. Bolt length approximations shown in the table above include sensor length, width dimensions for two each flange adapters, flange rings and gaskets, all typical of +GF+ SYGEF-PVDF piping system components, plus nuts and washers. If the accessory Spring Kit will be used, bolt length requirements increase by 60.0 mm (2.5 inches.)•Do not exceed 70 ºC media temperature •Do not exceed torque specifications.Sensor Config.# of Bolts Bolt Diameter Approximate Bolt Length Required Torque 3" Flange ISO 16M16 (5/8" - 11)70 mm (2.75")40 ± 5 N•m ( 30 ± 4 lbf•ft)3" Flange ANSI 8M16 (5/8" - 11)70 mm (2.75")40 ± 5 N•m ( 30 ± 4 lbf•ft)4" Flange ISO 16M16 (5/8" - 11)80 mm (3.00")45 ± 5 N•m (33 ± 4 lbf•ft)4" Flange ANSI 16M16 (5/8" - 11)80 mm (3.00")45 ± 5 N•m (33 ± 4 lbf•ft)3" Wafer ISO 8M16 (5/8" - 11)180 mm (7.50")25 N•m (18.5 lbf•ft)3" Wafer ANSI 4M16 (5/8" - 11)180 mm (7.50")25 N•m (18.5 lbf•ft)4" Wafer ISO 8M16 (5/8" - 11)220 mm (8.50")30 N•m (22 lbf•ft)4" WaferANSI8M16 (5/8" - 11)220 mm (8.50")30 N•m (22 lbf•ft)Tighten the flange bolts in the appropriate sequence.Tighted each bolt to 50% of the specification, repeat the pattern to 80%, then repeat again to the specified torque.Wiring for Frequency OutputThe open-collector frequency output requires a three-wire connection between the sensor and the monitoring device.To wire the vortex sensor frequency output to remote equipment:•Cable with single twisted-pair plus shield recommended.•Maximum cable length 200 ft.•Install cable through a conduit port andconnect as shown to the terminal block inside the vortex sensor cap.•Open collector voltage is supplied by +GF+ SIGNET instruments.•Use the 2535/2536 input card setting when wiring to the +GF+ SIGNET 9010Intelek-Pro Flow ControllerTo wire the vortex sensor frequency output to a Signet 8550Integral transmitter:cap. The cap will not be used.• Connect the Vortex sensor to the 8550 as shown.Out toremote equipmentCalibration Data: Frequency OutputUse the following K-factor data to program a flow meter which accepts the open collector frequency signal from the vortex flow sensor.The K-factor is the number of pulses generated byeach gallon (or liter) of fluid that passes through the sensor.Calibration - Current OutputThe current output from the 3-7002 is factory-calibrated for full scale operation ( 4-20 mA = 0-4 m/s).Since the sensor is limited to a minimum of 0.2 m/s, the current output is held at 4 mA when flow is less than 0.2 m/s, (or 0.66 ft/s), and increases to 20 mA at the maximum flow velocity (4.0 m/s, or 13.12 ft/s).The charts on page 5 show the relationship between the fluid velocity, the actual flow rate (in GPM and LPM) and the current output. You can also use the following formula to calculate the current output at any specific flow velocity.Example 1: In a pipe with a flow velocity of 2 m/s, what is the correct current output?:+4=12.0mAMax sensor velocityFluid velocity in pipe X 16+4=current output (mA)4 mA20 mAWiring for Current OutputThe 4-20 mA current output selection requires a two-wire loop connection between the sensor and monitoring device.+ 4 = 10.97 mAExample 2: In a 4 in.pipe what should the current output be when the flow rate is 200 gpm?:Velocity-Flow Rate-Current output ChartTechnical DataWetted materials•Sensor body:PVDFPipe size•d90/DN80 (3 in.) and d110/DN100 (4 in.) Linear Flow rangeTurn-down ratio:20:1•d90/DN80 (3 in.):Reynolds ≥ 16000: 0.2 to 4 m/s (0.66 to 13 ft/s)•d110/DN100 (4 in.):Reynolds ≥ 20000: 0.2 to 4 m/s (0.66 to 13 ft/s)NOTE: Below these velocity ranges, Vortex output is non-linear.Electronics module enclosure•Rating:NEMA 4X/IP65•Material:Valox®[Polybutylene TerephThalate (PBT) resin]Weight:Wafer 3 in./DN80: 4.5 lb/2.0 kg4 in./DN 100:7.0 lb./3.2 kgFlange: 3 in./DN80:11.0 lb./5.0 kg4 in./DN100:16.0 lb./7.3 kgElectrical•Accuracy:±1% of reading•Repeatability:±0.25% of reading•Response time: 1 s., first order5 s. settled to 1% of rate •Reverse polarity protection•Open Collector output:•NPN transistor, 10 mA max sink, 30 VDC max pull-up voltage, 0 to 100 Hz, 50% duty cycle, non-isolated.< 100 hz at maximum range.•Power requirement:4.5 to 7 VDC, regulated, 10 mA maximum•Current output:•factory-set; 4 to 20 mA = 0 to 4 m/s (0 to 13 ft/s) (Custom ranges available from factory)•Loop impedance:1Ω maximum at 12 VDC600Ω maximum at 24 VDC •Resolution:≈2.5 µA•Power requirement:12 to 24 VDC, regulated, 20 mA maximum268111417psibar32¡FWafer Vortex Sensor:10bar@30¼C,6.5bar@70¼C(145psi@86¼F,94psi@158¼F) Flange Vortex Sensor:10bar@30¼C,2bar@120¼C(145psi@86¼F,30psi@248¼F) EnvironmentalRating:NEMA 4X/IP65Maximum Media Pressure/Temperature•Ambient temp.:0 to 70 °C (32 to 158 °F)•Storage temp.:-15 to 80 °C (5 to 176 °F)•Relative humidity:0 to 95%, non-condensing •Vibration resistance:At least 1g in every axis up to 500 Hz.(The ultrasonic pickup is unaffected by normal piping system vibrations.)Standards and Approvals•Manufactured under ISO 9001 and ISO 14001•CE3-7000-5x3-7001-5xFlange Vortex Sensor dimensionsSize m m inch m m inch m m inch m m inch DN80133.1 5.2478.0 3.07108.0 4.25251.79.91DN100158.06.2296.03.78127.05.00277.110.91ABC DWafer Vortex Sensor dimensionsSizem m inch m m inch m m inch m m inch DN80196.97.7578.0 3.07199.97.87287.011.3DN100228.69.0096.03.78249.99.84322.612.7A BC D+GF+ SIGNET 7002 Vortex Flow SensorsPart NumberCodeDescription3-7002-2AF 159 000 6573-7002-2AFI 159 000 6583-7002-2AW159 000 6613-7002-2BF 159 000 662High-Purity 4” (d110/DN100) Flange, ANSI 3-7002-2BFI 159 000 663High-Purity 4” (d110/DN100) Flange, ISO 3-7002-2BW159 000 666High-Purity 4” (d110/DN100) Wafer3-7002-3AF 159 000 667PVDF 3” (d90/DN80) Flange, ANSI3-7002-3AFI 159 000 668PVDF 3” (d90/DN80) Flange, ISO 3-7002-3AW159 000 671PVDF 3” (d90/DN80) Wafer3-7002-3BF 159 000 672PVDF 4” (d110/DN100) Flange, ANSI 3-7002-3BFI 159 000 673PVDF 4” (d110/DN100) Flange, ISO 3-7002-3BW159 000 676PVDF 4” (d110/DN100) WaferAccessoriesPart NumberCodeDescription3-8550-1159 000 210Flow Transmitter for Field Mount3-8550-2159 000 212Flow Transmitter with 2 Relays for Field Mount 3-8550-3159 000 2142-Channel Flow Transmitter for Field Mount 3-8050159 000 184Universal Adapter Kit3-0000.393159 000 618Liquid Tight Connector Kit with PG 13.5 to NPT Adapter 3-7002.391159 000 692Spring Kit (includes four (4) springs)Ordering Information‡ SIGNETSignet Scientific Company, 3401 Aerojet Avenue, El Monte, CA 91731-2882 U.S.A. • Tel. (626) 571-2770 • Fax (626) 573-2057For Worldwide Sales and Service, visit our website: • Or call (in the U.S.): (800) 854-4090GEORGE FISCHER ‡ Piping Systems3-7002.090/(C-7/02) English© Signet Scientific Company 2002Printed in U.S.A. on recycled paper。

G-5The FV-200 Series meter utilizes vortex-shedding technology to provide a repeatable flowmeasurement accurate to 1% of full scale. The meter has nomoving parts, and any potential for fluid contamination is eliminated by the meter’s corrosion-resistant all plastic construction. The meter includes a compact 2-wire (4 to 20 mA) or 3-wire pulse transmitter (optional), contained within a conveniently replaceable plug-in electronics module. All electronics are housed in a corrosion-resistant enclosure. Unlike meters containing metal or moving parts, the FV-200 is perfect for aggressive or easily contaminated fluids. Applications range from ultra-pure water to highly corrosive chemicals and slurriesOperation of the FV-200 vortex flowmeter is based on the vortex shedding principle. As fluid moves around a body, vortices (eddies) are formed and move downstream. They form alternately, from one side to the other, causing pressure fluctuations. These are sensed by a piezoelectric crystal in the sensor tube, and are converted to a 4 to 20 mA, or pulse signal. The frequency of the vortices is directly proportional to the flow rate. This results in extremely accurate and repeatable measurements using no moving parts.Another advantage of utilizing aFV-200 vortex flowmeter is that there are no gaskets or elastomers in themeter. Therefore, one need only be concerned with the thermoplasticmaterial used in body construction.In a thermoplastic piping system, the material chosen for the flowmeter should match that of the pipe wherever possible.Many factors may affect the capability of a meter to measurethe flow of specific fluids accurately. Different solutions have varying ef-fects on meters. For instance, heavy particle suspension will wear down internal parts on some meters or cause sensing inaccuracies for non-obtrusive metering systems. For vortex flowmeters, high viscosities tend to dampen the formation of vortices and reduce the effective range. Particles and internal bubbles do not usually affect vortex meters. Slurries containing grit can wear down the bluff body over a period of time. Also, long fibers can catch and build up on the bluff,decreasing accuracy. Standard factory calibration is for tap water at32 SSU (1 CST) viscosity and ambient temperature. Viscosityabove 1 CST will raise the minimum readable flow rate, reducing SpecificationSMeasured: Liquidsconnection: 1⁄4 to 2 NPT threadWetted Material: PVC, CPVC or PVDF depending on model number turndown Ratio: 12.1 (except 1⁄4" meter size; 8.1)accuracy: ±1% of full scale, 4 to 20 mA or ±2% of full scale, frequency pulse (“-p” option)Repeatability: ±0.25% actual flow output Signal: 4 to 20 mA orfrequency pulse (source-sink driver; 1A source/ 1.5A sink; typical output resistance 10 Ω)power Supply: 13 to 30 Vdc enclosure: NEMA 4X (IP 66)Response time: 2 seconds minimum, step change in flowrangeability. The effect is linear toviscosity. No adjustments are required for specific gravities up to 2.0. Liquids with high specific gravities will adversely affect the permissible amount and duration of over range flow.Uno Moving parts U corrosion Resistant U 6 to 51 mm (1⁄4 to 2") Sizes UH igh temperature [95°c (203°f)] Models available U niSt certificatefV-211, shown smaller than actual size.ALL PLASTIC VorTex FLowMeTer For CorroSIVe LIquIdSfV-200 SeriesG-6GP O R D E R U S S E R P )r a b i l l i M (For units with a pulse output add a “-P” to the model number, no additional charge.*For high temperature CPVC or PVDF add suffix “-HT” to model number, for additional cost.Ordering Examples: FV-213, 3⁄4 NPT, PVC vortex flowmeter and DPi32, 1⁄32 DIN digital display. FV-226-P, 2 NPT, CPVC vortex with pulse output.FV-231-P-HT, 1⁄4 NPT, PVC vortex with pulse output and high temperature option.。
Fluid-Structure Interaction and Dynamics Fluid-structure interaction (FSI) and dynamics are critical aspects of engineering and physics that play a significant role in various fields such as aerospace, civil engineering, biomechanics, and more. The interaction betweenfluid flow and solid structures can lead to complex and often unpredictable behavior, making it a challenging yet fascinating area of study. One of the key problems in FSI and dynamics is the accurate prediction and analysis of the behavior of structures under the influence of fluid forces. This is particularly important in the design and operation of aircraft, ships, bridges, and other engineering systems where the interaction between the structure and the surrounding fluid can have a significant impact on performance and safety. Understanding the dynamic response of structures to fluid forces is crucial for ensuring structural integrity and stability under various operating conditions. From a fluid mechanics perspective, FSI and dynamics involve the study of howfluid flow affects the behavior of solid structures and vice versa. Theinteraction between the fluid and the structure can lead to phenomena such as vortex shedding, flow-induced vibrations, and aeroelastic instabilities, which can have detrimental effects on the performance and safety of engineering systems. Therefore, it is essential to develop accurate computational models and simulation techniques to predict and analyze these complex interactions. In the field of computational fluid dynamics (CFD) and structural analysis, researchers and engineers are constantly striving to improve the accuracy and efficiency of FSI simulations. High-fidelity simulations of FSI and dynamics require sophisticated numerical methods, such as finite element analysis (FEA), computational fluid dynamics (CFD), and coupled FSI solvers, to capture the intricate interactions between the fluid and the structure. These simulations can provide valuable insights into the behavior of complex engineering systems and help in optimizing their design and performance. Moreover, experimental testing and validation play a crucial role in advancing our understanding of FSI and dynamics. Physicaltesting of scaled models in wind tunnels, water tanks, and other experimental facilities can provide valuable data for validating computational models and gaining insights into the complex behavior of fluid-structure interactions.Experimental testing is also essential for understanding real-world phenomena such as flutter, buffeting, and vortex-induced vibrations, which can have significant implications for the design and operation of engineering systems. In conclusion, fluid-structure interaction and dynamics are multifaceted areas of study that require a multidisciplinary approach, combining expertise in fluid mechanics, structural analysis, computational modeling, and experimental testing. The accurate prediction and analysis of FSI phenomena are crucial for the design and operation of engineering systems, and ongoing research and development in this field are essential for advancing our understanding of complex fluid-structure interactions. As we continue to push the boundaries of engineering and physics, the study of FSI and dynamics will remain a captivating and challenging area of research with far-reaching implications for various industries and applications.。
Fluid-Structure Interaction Fluid-structure interaction (FSI) is a complex and fascinating phenomenon that occurs when fluid flow interacts with solid structures, resulting in mutual influence and dynamic behavior. This interdisciplinary field has significant implications in various engineering applications, including aerospace, civil engineering, biomechanics, and offshore structures. Understanding FSI is crucialfor optimizing the performance, safety, and reliability of these systems. In this response, we will explore the challenges, implications, and advancements in FSI, considering both the fluid dynamics and structural mechanics perspectives. From a fluid dynamics standpoint, FSI presents intricate challenges due to the nonlinear and coupled nature of fluid-structure interactions. The behavior of the fluid is influenced by the motion and deformation of the solid structure, while the solid structure experiences forces and pressures exerted by the surrounding fluid. This bidirectional interaction leads to complex phenomena such as vortex shedding,flow-induced vibrations, and instabilities, which can have detrimental effects on the structural integrity and performance of engineering systems. Furthermore, the inherent complexities of turbulence, compressibility, and multiphase flow add another layer of intricacy to FSI problems, necessitating advanced computational and experimental techniques for accurate analysis and prediction. On the other hand, from a structural mechanics perspective, FSI introduces challenges relatedto dynamic response, fatigue, and failure analysis of the solid components. The interaction with the surrounding fluid can induce dynamic loading, resonance, and fatigue cycles, leading to structural degradation and potential failure. Moreover, the fluid-induced forces can result in complex structural deformation and stresses, requiring comprehensive modeling and simulation approaches to assess thestructural response under varying operating conditions. In the context of offshore structures, for instance, FSI plays a critical role in the design and maintenance of platforms, considering the impact of waves, currents, and wind on thestructural integrity and stability. In recent years, significant advancements have been made in the computational modeling and simulation of FSI, leveraginghigh-fidelity numerical methods and advanced algorithms. Computational fluid dynamics (CFD) and finite element analysis (FEA) techniques have been integratedto simulate the coupled behavior of fluids and structures, enabling engineers to gain insights into the complex interactions and their implications. Furthermore, the development of multiphysics simulation platforms and software tools has provided a comprehensive framework for studying FSI problems across different engineering domains, facilitating the design optimization and performance assessment of various systems. In addition to computational approaches, experimental techniques such as wind tunnel testing, water flume experiments, and structural testing have been instrumental in validating FSI models and understanding the physical phenomena associated with fluid-structure interactions. These experimental investigations have provided valuable data for benchmarking simulations, validating theoretical models, and capturing real-world FSI effects that may not be fully captured through numerical analyses alone. From an emotional perspective, the challenges and advancements in FSI evoke a sense of awe and inspiration, as engineers and researchers strive to unravel the complexities of nature and develop innovative solutions to enhance the performance and safety of engineering systems. The interdisciplinary nature of FSI fosters collaboration and knowledge exchange across fluid dynamics, structural mechanics, and materials science, creating a vibrant community dedicated to pushing the boundaries of understanding and application in this field. In conclusion, fluid-structure interaction represents a captivating and multifaceted area of study with profound implications for engineering design, analysis, and optimization. The challenges and advancements in FSI underscore the intricate interplay between fluid dynamics and structural mechanics, driving the development of advanced computational and experimental techniques to unravel the complexities of this phenomenon. As we continue to explore and innovate in the realm of FSI, we are poised to unlock new possibilities for enhancing the performance, reliability, and safety of engineering systems across diverse applications.。
涡街模拟建议流体模拟1.我计算的是一个二维自维持振荡问题(好多文献都这样说),我采用层流算法也得到了类似的结果,k-e-rng也可以。
而别的模型都不行了,一般都是最后得到一个稳定的解(和文献上说的不同)。
因为雷诺数比较小,不能确定什么时候转变成紊流,所以想用一个能够计算过渡流动的模型。
不知道用k-e-rng模型是不是就可以说是准确,因为没有具体的试验数据,是不是可以根据它的计算流场和试验流场相似就确定计算的合理性和准确性呢?多谢多谢Hi-key:这种问题的要求比较高,类似的问题我只算过卡门涡阶的。
不过当时是用层流算得。
你这个例子里面如果跟湍流模型敏感,我建议你可以尝试以下方法:FzN/5[选用其他湍流模型,然后在进出口边界处的湍流相设置时,使用湍流强度和粘性比然后将这两个数值全部给0,再计算时使用绝对压力计算。
也许会有变化,也许没用,你可以试试,把结果告诉我。
谢谢,另外在所有的湍流模型中k-e-rng是最适合计算低雷诺数湍流模型的,当然你也可以尝试真正的低雷诺数湍流模型,需要在用户界面中输入命令行激活,至于怎么激活我忘了,哈哈,不好意思,等我查到了给你哈。
f.!Z流体中文网论坛-- 流体力学及相关领域学术问题交流论坛。
/. 另外判断结果是否正确只能靠实验或者查文献了,流态特征相似只能证明大体上没错,但是精度就不知道了。
我计算的是周期性边界条件,和绝对压力有关系吗?我刚才改变了初场的两个湍流变量(不知道是不是你所说的湍流强度和粘性比)计算了一下,发现对结果影响很大,都为零时,没有振荡现象;增大这两个值又会出现不同的流场。
绝对压力只是为了使计算更加准确,你也可以用表压计算。
Re\!3湍流的两个变量是入口处的脉动情况,都为0时跟层流接近但是跟层流不同。
你将湍流强度设为5%,粘性比设为0.01。
再试试看,有变化的话,换别的湍流模型再试下。
UH另外周期边界中你设定压降还是流量?流量的指定方式更加容易出现波动。
拖缆涡激振动计算及分析方开翔;刘炳霞;赵琦【摘要】细小结构的涡激振动自从Von.Karman提出Karman涡激之后就引起了人们的重视.文中采用计算流体力学和有限元相结合的方法计算拖缆结构模型在水下工作时,由流体引起的对拖缆的涡激振动作用力,从而计算拖缆的涡激振动响应.【期刊名称】《江苏科技大学学报(自然科学版)》【年(卷),期】2005(019)006【总页数】5页(P70-74)【关键词】旋涡;涡激振动;计算流体力学;有限元【作者】方开翔;刘炳霞;赵琦【作者单位】江苏科技大学机械与动力工程学院,江苏,镇江,212003;江苏科技大学机械与动力工程学院,江苏,镇江,212003;江苏科技大学机械与动力工程学院,江苏,镇江,212003【正文语种】中文【中图分类】O357.1;O3260 引言涡激振动是水弹性耦合振动的典型课题之一,是流体力学和结构力学相关的边缘学科。
国外对这方面的研究主要集中在圆柱形结构上[1-5],但是缆绳结构的涡激振动情况要比刚性圆柱体复杂得多。
由于实验条件的限制,现有的模型实验不能很好地模拟拖缆涡激振动这一水弹性耦合振动,而且相关的理论研究文献很少。
拖曳线列阵声纳的一个重要噪声源是拖曳系统在工作过程中的振动,拖缆的振动将会严重影响信号的发射和接收,从而大大降低拖曳系统的性能。
因此,为了保障拖曳系统的正常工作,进一步提高拖曳系统的工作性能,就必须深入研究拖缆振动的特点。
文中以涡激振动理论为基础,从旋涡引起振动的机理、计算涡激振动作用的数学模型和拖缆涡激振动方程的角度出发,采用计算流体力学和有限元相结合的方法计算拖缆结构模型在水下工作时,由流体引起的涡激振动响应,是涡激振动计算方法的一个新尝试。
1 计算方案根据Ramberg[6-7]对振动缆绳尾流中旋涡形成的实验研究,缆绳单元后的旋涡形成主要依赖于其局部振幅,而与邻近缆绳单元振动情况关系很弱,单元的尾流性质,如旋涡形成的长度、涡激速度等与振动的刚性柱体遵循相似的规律。