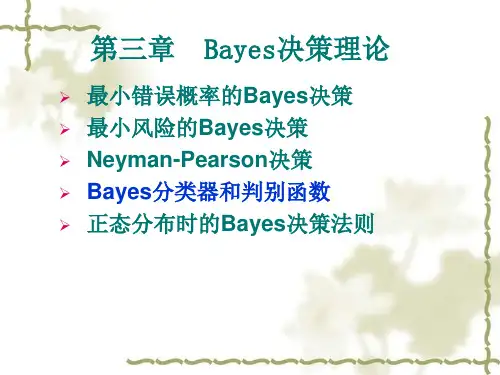
ch2_2.3.2正态分布下的Bayes判据的判别函数和决策面(线性、二次分类器)解读
- 格式:ppt
- 大小:649.00 KB
- 文档页数:1


bayes判别法Bayes判别法Bayes判别法是一种基于贝叶斯定理的分类方法,它通过计算样本在各个类别下的后验概率来进行分类。
Bayes判别法在模式识别、机器学习和统计学等领域中得到了广泛应用。
一、贝叶斯定理贝叶斯定理是概率论中的一个重要定理,它描述了在已知某些条件下,某个事件发生的概率。
假设A和B是两个事件,P(A)和P(B)分别表示它们各自发生的概率,则有:P(A|B)=P(B|A)×P(A)/P(B)其中,P(A|B)表示在事件B发生的条件下事件A发生的概率,称为后验概率;P(B|A)表示在事件A发生的条件下事件B发生的概率,称为似然函数;P(A)和P(B)分别表示事件A和事件B独立发生的概率。
二、Bayes判别法原理Bayes判别法是一种基于贝叶斯定理的分类方法。
假设有n个样本,每个样本可以被分为k类。
对于一个新样本x,我们需要将其归入其中一类。
Bayes判别法采用后验概率最大化准则进行分类,即将x归为后验概率最大的那一类。
具体地,对于一个新样本x,我们需要计算其在每个类别下的后验概率P(ci|x),然后将x归为后验概率最大的那一类。
其中,ci表示第i类。
根据贝叶斯定理,我们可以将P(ci|x)表示为:P(ci|x)=P(x|ci)×P(ci)/P(x)其中,P(x|ci)表示在第i类下样本x出现的概率,称为类条件概率;P(ci)表示第i类出现的概率,称为先验概率;P(x)表示样本x出现的概率。
由于对于一个新样本来说,其出现的概率是相同的,因此可以忽略分母部分。
因此,我们只需要比较每个类别下的P(x|ci)×P(ci),并选择最大值所对应的类别作为分类结果。
三、Bayes判别法实现Bayes判别法可以通过训练样本来估计先验概率和类条件概率。
具体地,在训练阶段中,我们需要统计每个类别下每个特征取值出现的次数,并计算相应的先验概率和类条件概率。
具体地:1. 先验概率先验概率指在没有任何信息或者证据的情况下,每个类别出现的概率。


正态分布形状参数在不同损失下Bayes估计正态分布形状参数在不同损失下的Bayes估计目录 1引言 5 1.1历史 5 2 经典统计学中的参数估计 6 2.1参数的矩估计 6 2.2 参数的最大似然估计 7 3不同损失函数下的贝叶斯估计 9 3.1 Linex损失函数下的贝叶斯估计10 3.2复合Linex对称损失函数的贝叶斯估计11 3.3 MLinex损失函数下的贝叶斯估计13 3.4复合MLinex损失函数下的贝叶斯估计 14 4实例分析与数据模拟 16 4.1 Linex损失函数下估计量的比较分析17 4.2 复合Linex损失函数下估计量的比较分析18 4.3 MLinex损失函数下估计量的比较分析18 4.4 复合MLinex损失函数下估计量的比较分析 19 结论 21 致谢 22 参考文献 23 正态分布形状参数在不同损失下的Bayes估计摘要所谓正态分布(Normal distribution)又被称作为高斯分布(Gaussian distribution),是一个在物理、数学及工程等相关领域都有着非常重要作用的概率分布,同时它在统计学的好多方面也有着颇为重要的影响力。
本篇论文在经典统计学的基础,首先对正态分布的参数进行了矩估计和最大似然估计;然后,在选取函数作为先验分布的条件下,研究了正态分布在、复合、和复合损失函数下的估计,最后,利用软件,产生了一组随机数,对在损失函数的情况下,比较了矩估计、最大似然估计和估计的三个估计的估计值;并且对不同损失函数下,不同参数值对正态分布矩估计和估计的估计值变化的影响进行了研究。
关键词正态分布估计损失函数软件Bayes Estimation of Shape Parameters of Normal Distribution under Different Losses AbstractNormal distribution, also known as Gauss distribution, is a very important probability distribution in the fields of mathematics, physics and engineering.It has great influence in many aspects of statistics.First, this paper in classical statistics, the parameters of the exponential distribution of momentestimation and maximum likelihood estimation;Then, under the condition of selecting the Gamma function as the prior distribution, exponential distribution is studied in Linex, composite Linex, MLinex and composite MLinexbayesian estimation under the loss function, and further to the parameters of the exponential distribution, the under composite Linex loss function and MLinex loss function of empirical bayes estimation and bayesian estimation research;Finally, using matlab software, a set of random Numbers is created, and the estimation values of the moment estimation, maximum likelihood estimation and bayesian estimation are compared in the case of Linex loss function.In addition, the moment estimation of the exponential distribution and the change of bayesian estimation are studied under different loss functions.Key words Loss function Bayesian estimation Experience bayesian estimation of Multilayer bayesian estimation Data simulation Matlab software 1 引言正态分布是自然科学和行为科学中一种方便的定量现象模型。
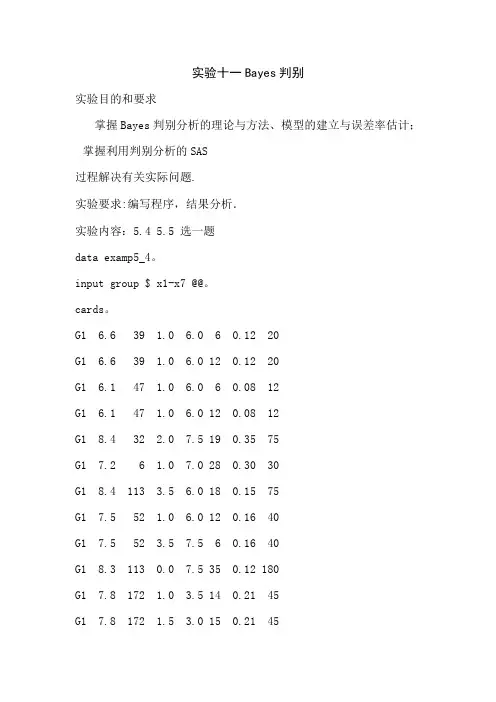
实验十一Bayes判别实验目的和要求掌握Bayes判别分析的理论与方法、模型的建立与误差率估计;掌握利用判别分析的SAS过程解决有关实际问题.实验要求:编写程序,结果分析.实验内容:5.4 5.5 选一题data examp5_4。
input group $ x1-x7 @@。
cards。
G1 6.6 39 1.0 6.0 6 0.12 20G1 6.6 39 1.0 6.0 12 0.12 20G1 6.1 47 1.0 6.0 6 0.08 12G1 6.1 47 1.0 6.0 12 0.08 12G1 8.4 32 2.0 7.5 19 0.35 75G1 7.2 6 1.0 7.0 28 0.30 30G1 8.4 113 3.5 6.0 18 0.15 75G1 7.5 52 1.0 6.0 12 0.16 40G1 7.5 52 3.5 7.5 6 0.16 40G1 8.3 113 0.0 7.5 35 0.12 180G1 7.8 172 1.0 3.5 14 0.21 45G1 7.8 172 1.5 3.0 15 0.21 45G2 8.4 32 2.0 9.0 10 0.35 75 G2 8.4 32 2.5 4.0 10 0.35 75 G2 6.3 11 4.5 7.5 3 0.20 15 G2 7.0 8 4.5 4.5 9 0.25 30 G2 7.0 8 6.0 7.5 4 0.25 30 G2 7.0 8 1.5 6.0 1 0.25 30 G2 8.3 161 1.5 4.0 4 0.08 70 G2 8.3 161 0.5 2.5 1 0.08 70 G2 7.2 6 3.5 4.0 12 0.30 30 G2 7.2 6 1.0 3.0 3 0.30 30 G2 7.2 6 1.0 6.0 5 0.30 30 G2 5.5 6 2.5 3.0 7 0.18 18 G2 8.4 113 3.5 4.5 6 0.15 75 G2 8.4 113 3.5 4.5 8 0.15 75 G2 7.5 52 1.0 6.0 6 0.16 40 G2 7.5 52 1.0 7.5 8 0.16 40 G2 8.3 97 0.0 6.0 5 0.15 180 G2 8.3 97 2.5 6.0 5 0.15 180 G2 8.3 89 0.0 6.0 10 0.16 180 G2 8.3 56 1.5 6.0 13 0.25 180 G2 7.8 172 1.0 3.5 6 0.21 45run。
§5.2Bayes 判别1. Bayes 判别的基本思想假设已知对象的先验概率和“先验条件概率”, 而后得到后验概率, 由后验概率作出判别.2. 两个总体的Bayes 判别 (1) 基本推导设概率密度为1()f x 和2()f x 的p 维总体12,G G 出现的先验概率为1122(),()p P G p P G ==(121p p +=)先验概率的取法: (i) 1212p p ==, (ii) 12121212,n n p p n n n n ==++,一个判别法 = 一个划分=12(,)R R =R1212,,p R R R R =⋃=⋂=∅R距离判别中112212{|(,)(,)}{|(,)(,)}R d G d G R d G d G =≤=>x x x x x x判别R 下的误判情况讨论21(2|1,)()d R P f =⎰R x x ,或12(1|2,)()d R P f =⎰R x x代价分别记为(2|1),(1|2),(1|1)0,(2|2)0c c c c ==, 在得新x 后, 后验概率为1111122()(|)()()p f P G p f p f =+x x x x2221122()(|)()()p f P G p f p f =+x x x x(i) 当(1|2)(2|1)c c c ==时, 最优划分是112212{:(|)(|)}{:(|)(|))}R P G P G R P G P G =≥⎧⎨=<⎩x x x x x x 两个总体的Bayes 的判别准则112212,(|)(|),(|)(|)G if P G P G G if P G P G ∈≥⎧⎨∈<⎩x x x x x x 此时, 有最小的误判概率*12(2|1,)(1|2,)p p P p P =+R R .因为21*1122()d ()d R R p p f p f =+⎰⎰x x x x111122(1()d )()d R R p f p f =-+⎰⎰x x x x()112211()()d R p p f p f =+-⎰x x x只有取12211{:()()}R p f p f =≤x x x 时, 才有最小. (ii) 当(1|2)(2|1)c c ≠时对1G 的误判平均损失: (1,)(2|1)(2|1,)l c P R =R , 对2G 的误判平均损失:(2,)(1|2)(1|2,)l c P R =R , 对整个误判的平均损失:12(1,)(2,)L p l p l =+R R12(2|1)(2|1,)(1|2)(1|2,)c p P R c p P R =⋅⋅+⋅⋅可证使L 最小的最优划分是1112221122{:(2|1)()(1|2)()}{:(2|1)()(1|2)()}R c p f c p f R c p f c p f =≥⎧⎨=<⎩x x x x x x 或112212{:(2|1)(|)(1|2)(|)}{:(2|1)(|)(1|2)(|))}R c P G c P G R c P G c P G =≥⎧⎨=<⎩x x x x x x 当12p p =时, 有112212{:(2|1)()(1|2)()}{:(2|1)()(1|2)()}R c f c f R c f c f =≥⎧⎨=<⎩x x x x x x 当12p p =, 且时(1|2)(2|1)c c c ==, 有 112212{:()()}{:()()}R f f R f f =≥⎧⎨=<⎩x x x x x x相当于经典统计学中的似然比准则判别. (2) 两个正态总体的Bayes 判别 1) 12==ΣΣΣ的判别112212,()(),()()G if W W G if W W ∈≥⎧⎨∈<⎩x x x x x x 其中111222(),()T TW b W b ++x a x x a x ,及 111111111,2ln TT T b p --+-a μΣμΣμ122122221,2ln T T T b p --+-a μΣμΣμ 实用中, 用样本均值和样本协方差阵代.替.当1212p p ==时, 与距离判别等价. 如用后验概率来判别(或其估计), 则有112212,(|)(|),(|)(|)G if P G P G G if P G P G ∈≥⎧⎨∈≥⎩x x x x x x .1) 12≠ΣΣ的判别与距离判别的区别为广义平方距离函数21111111()()()ln 2ln((2|1))T d c p -=--+-x x μΣx μΣ,21222222()()()ln 2ln((1|2))T d c p -=--+-x x μΣx μΣ推导过程略.当 “三同”时, 与距离判别一样.(3) 误判概率的计算在12==ΣΣΣ下, 作简要讨论. 用广义距离2221()()d d -x x 可导出划分12{:()}{:()}R W d R W d =≥⎧⎨=≥⎩x x x x (^_^) 其中112()()()T W -=--x μμΣx μ, 21(1|2)ln (2|1)c p d c p =, 两个总体1G 与2G 的马氏平方距离可记为11212()()T λ-=--μμΣμμ经导, 对(^_^)的划分, 其误判率为*121p p p ΦΦ⎛⎫=+- ⎪⎝⎭ 随λ大而小.实用中, 用(1)(2)1(1)(2)ˆ()()T λ-=--x x S x x 代λ.当121/2p p ==时, 有*2112211ˆ2n n p n n ⎛⎫=+ ⎪⎝⎭当12,p p 按容量比例选取时, 即12121212,n n p p n n n n ==++ 有 *122112ˆn n p n n +=+ 误判率的回代估计.例5.3 预报春旱. 两个预报因子的观察值12,X X , 假设误报损失相同, 先验概率按比例. 由下表数据进行两总体的Bayes 判别.解 16/140.4286p ==, 28/140.5714p ==. 调用proc discrim 得12ln || 1.8053,ln || 3.6783S S =-=- (1)(2)25.31622.025,2.416 1.187x x ⎡⎤⎡⎤==--⎢⎥⎢⎥⎣⎦⎣⎦ 122.2130.6570.2730.063,0.6570.2690.0630.106S S --⎡⎤⎡⎤==--⎢⎥⎢⎥⎣⎦⎣⎦ 广义平方距离为(1,2j =)2()1()()()()ln 2ln j T j j j j j d p -=--+-x x xS x x S 后验概率为222ˆˆ0.5()0.5()1ˆ(|)e e j k d d j k P G --==∑x x x ,(1,2j =).回代判别结果如下略,误判率=0;若用交叉确认法, 则应按下式计算2()1()()()()()()()()ln 2ln j j j T j j x x x x j d p -=--+-x x x S x x S 逐个剔除, 交叉判别.有一错(10号被判错), 交叉确认估计*ˆ1/140.0714c p ==3. 多个总体的Bayes 判别(1) 一般讨论设概率密度为1~()k f x 的p 维总体1~k G 出现的先验概率为1~1~()k k p P G =, (11kj j p ==∑)先验概率的取法:(i) 1~1k p k =, 或(ii) 1~1~12k k k n p n n n =++,一个判别法= 一个划分=12{(,,,)}k R R R =R 判别准则 1,,kp j i j j R R R i j ==⋃=⋂=∅≠R判别R 下的误判情况讨论(|,)()d ,j i R P j i f j i =≠⎰R x x ,(1~)j k = 代价记为一个损失矩阵()(|)k k c j i ⨯(约定(|)0,1~c i i i k ==)常取(|)1,c j i i j =≠. 来自i G 判为其他总体的概率是(|,)j iP j i ≠∑R 误判的概率*1(|,)ki i j i p p P j i =≠⎛⎫= ⎪⎝⎭∑∑R 使其最小, 得最优划分.当(|)c j i 不全相等时, 将来自i G 判为其他总体的平均损失率1(|,)(|)ki j l P j i c j i ==∑R误判的平均损失率111(|,)(|)kkk i i i i i j L p l p P j i c j i ===⎛⎫== ⎪⎝⎭∑∑∑R应使其最小的划分R .进一步的讨论1) 当(|)1,c j i i j =≠时,因1(|,)1kj P j i R ==∑, 故(|,)1(|,)j iP j i P i i ≠=-∑R R从而有()()*111(|,)1()d ik ki R i i p P i i f ===-=-∑∑⎰R x x11()d iki R i f ==-∑⎰x x当1{:()max ()},1~i i i j j j kp f p f i k ≤≤===R x x x 时,12(,,,)k R R R =R 是使*p 最小的最优划分.又由Bayes 公式, 当出现样品x 时, 总体i G 的后验概率1~()(|)()i i i j jj kp f P G p f ==∑x x x故最优划分为1{:(|)max (|)}i i j j kR P G P G ≤≤==x x x , (1~i k =)当有多个时, 任选一个.2) 当(|),c j i i j ≠不全相等时,111(|,)(|)kkk i i i i i j L p l p P j i c j i ===⎛⎫== ⎪⎝⎭∑∑∑R11(|)()d jkk i i j i p c j i f ==⎛⎫= ⎪⎝⎭∑∑⎰R x x11(|)()d jkki i j i p c j i f ==⎛⎫= ⎪⎝⎭∑∑⎰R x x11()(|)()()d jkj iiki j j h x p c j i f h ==⎛⎫ ⎪⎝⎭∑∑⎰R x x x 取划分为1{:()min ()},1~j j i i i kh p f j k ≤≤===R x x x可使L 达到最小. 若记1(|)(|)(|),1~kj i i H G c j i P G j k ===∑x x(当出现x 后,被判为来自j G 后验平均损失, 则有1{:(|)min (|)},1~j j i i kH G H G j k ≤≤===R x x x若有多个, 则任判一个. (2) 多个正态总体的Bayes 判别1) 对1,(|)0,i jc j i i j ≠⎧=⎨=⎩的情况(i) 当12k ====ΣΣΣΣ时,设~(,)j p j G N μΣ(1~)j k =线性判别函数为()T j j j W b +x a x ,其中111,2ln j T T T j j jj j b p --+-a μΣμΣμ 广义平方函数21()()()2ln T j j j j d p -=---x x μΣx μ,1~j k = 后验概率22ˆˆ0.5()0.5()1(|)ee jk kd d j k P G --==∑x x x这时最优划分1{:()max ()}j j i i kR W W ≤≤==x x x1{:(|)max (|)}j i i kP G P G ≤≤==x x x (1~j k =)实用中, 用样本均值和样本协方差阵代替.(ii) 1~k Σ不全相等时, 设~(,)j p j j G N μΣ(1~)j k = 则有21()()()ln 2ln T j j j j j j d p -=--+-x x μΣx μΣ后验概率22ˆˆ0.5()0.5()1(|)ee jk kd d j k P G --==∑x x x ,(1~)j k =这时最优划分1{:(|)max (|)}j j i i kR P G P G ≤≤==x x x (1~j k =)实用中, 用2ˆ()j d x ,ˆ(|)j P G x 代替. 2) 一般损失情况 计算(|),1~i P G j k =x 及1(|)(|)(|),1~kj i i H G c j i P G j k ===∑x x最优划分为1{:(|)min (|)},1~j j i i kH G H G j k ≤≤===R x x x例5.4 某学院招生时, 有两个参考指标1X : 平均学分指数; 2X 管理能力考试成绩;申请者分为3类: 1G 录取; 2G 不录取; 3G 待定. 近期有85位记录.(部分资料)假定1) 各总体~正态分布;2) 先验概率按比例;3) 误判损失相同讨论在(i) 协方差阵相同; (ii) 协方差不全相同时; Bayes判别分析, 并给出误判率的回判法和交叉确认法估计值.若有一新申请者的资料13.12x=和2497x=, 在两种情况下各被判入哪类?解(i) 调用proc discrim过程, 得(部分)和**ˆˆ7/850.0824,8/850.094r c p p ==== 关于新样本0(3.12,497)T x =的后验概率10(|)0.2401P G x =, 20(|)0.0004,P G x =30(|)0.7578P G x =,故应该待定.(ii) 协方差不全相等时, 有和**ˆˆ3/850.03534/850.0471r c p p ==== 关于新样本0(3.12,497)T x =的后验概率 10(|)0.5983P G x =, 20(|)0.0032,P G x =30(|)0.3985P G x =,G类(录取).当属1总结前述内容均利用了所给定的全部p个指标变量, 但并非指标变量越多, 判别效果就越好, 相反, 有时可能影响判别分析效果.因此,如回归分析一样,在判别分析中仍存在指标变量的选取问题,称为逐步判别法.限于本书特点,在此不再详述.有兴趣者可参见如[3]中第6章等.另外sA5系统的Proc stepdisc过程(参见[6])可用于逐步判别分析.。
统计学习理论中的Bayes算法Bayes算法在统计学习理论中的应用统计学习理论是一门研究如何从数据中学习模型和进行预测的学科。
在统计学习理论中,Bayes算法是一种重要的方法,它基于贝叶斯定理,通过对已知数据的分析和后验概率的计算来进行模型的学习和预测。
本文将详细介绍Bayes算法在统计学习理论中的原理和应用。
一、Bayes算法的原理Bayes算法是基于贝叶斯定理的一种统计学习方法。
贝叶斯定理是概率统计中的一个基本定理,用于计算在已知一些先验信息的情况下,根据新的观测数据来更新对事件发生概率的估计。
贝叶斯定理可以用公式表示如下:P(A|B) = (P(B|A) * P(A)) / P(B)其中,P(A|B)表示已知B发生的情况下A发生的概率,P(B|A)表示已知A发生的情况下B发生的概率,P(A)和P(B)分别表示A和B发生的概率。
Bayes算法通过贝叶斯定理来推导和计算模型参数的后验概率,并结合先验概率进行模型的学习和预测。
它的基本思想是将数据和先验知识进行结合,通过不断更新模型参数的估计值,提高模型的预测精度。
二、Bayes算法的应用1. 文本分类Bayes算法在文本分类中有广泛的应用。
通过统计分析已知文本的特征和类别的关系,计算出先验概率和条件概率,并利用贝叶斯定理来进行文本分类。
这种基于Bayes算法的文本分类方法被称为朴素贝叶斯分类器。
朴素贝叶斯分类器假设特征之间是条件独立的,通过计算每个特征在给定类别下的概率来进行分类。
这种方法简单高效,并且在一些文本分类任务中取得了较好的效果。
2. 垃圾邮件过滤Bayes算法在垃圾邮件过滤中也有应用。
通过对已知的垃圾邮件和正常邮件进行分析,计算出各个特征在给定类别下的概率,并利用贝叶斯定理来进行邮件的分类。
将概率高于某个阈值的邮件视为垃圾邮件,从而实现垃圾邮件的自动过滤。
这种基于Bayes算法的垃圾邮件过滤方法具有较高的准确率和召回率,并且能够自适应地更新模型参数,适应不断变化的垃圾邮件特征。
2.3 正态分布情况下的Bayesian 分类器与决策面 (Bayesian Classifier and Decision Surfaces for Normal Distributions)若一元变量x 在j 的类条件概率密度p (x /j )服从正态分布N(j , 2j σ),即)352(21exp 212-⎪⎪⎭⎫ ⎝⎛⎪⎪⎭⎫ ⎝⎛--=⎪⎭⎫ ⎝⎛σx σx p j j μπω记为()2j j j σμN p ,~⎪⎭⎫⎝⎛ωx 。
对二元变量x =(x 1, x 2)T ,若j 的类均值向量为j =(j 1,j 2)T,类协方差阵为⎪⎪⎭⎫ ⎝⎛=222221212211σσσσj Σ,记为()j j j N p Σμx ,~⎪⎭⎫ ⎝⎛ω。
一般地,有12=21,即j Σ为对称阵,它的逆矩阵为⎪⎪⎪⎭⎫ ⎝⎛-=-21121222122222121222221111σσ-σ-σσσσσj Σ 这时,x 属于j 的类条件概率密度为()()())362(21exp 2112-⎪⎭⎫ ⎝⎛---=⎪⎭⎫ ⎝⎛-j j T j jj p μx Σμx Σx πω 一般地,若x R m 为m 维随机变量,则x 属于j 的类条件概率密度为()()())372(21exp 2112-⎪⎭⎫ ⎝⎛---=⎪⎭⎫ ⎝⎛-j j T j jj mp μx Σμx Σx πω(2-36)或(2-37)成立的前提条件是0≠j Σ,或者说j Σ可逆。
我们知道,当依据后验概率进行决策时,两个类别ωj 与ωk 的分界面由0=⎪⎭⎫ ⎝⎛-⎪⎭⎫ ⎝⎛x x k j P P ωω所决定,即()-⎪⎭⎫ ⎝⎛j j p ωP ωx ()0=⎪⎭⎫ ⎝⎛k k p ωP ωx 。
结合(2-37),我们有 ()()()()()()()())382(021exp 2121exp 211122-=⎪⎭⎫ ⎝⎛----⎪⎭⎫ ⎝⎛-----k k T k kk j j T j jjmm P P μx Σμx Σμx Σμx Σπωπω或()()()()()()()())392(021exp 21ln 21exp 21ln 1122-=⎥⎥⎦⎤⎢⎢⎣⎡⎪⎭⎫ ⎝⎛----⎥⎥⎥⎦⎤⎢⎢⎢⎣⎡⎪⎭⎫ ⎝⎛-----k k T k k k j j T j j j m m P P μx Σμx Σμx Σμx Σπωπω于是,超维决策面方程为()()()())402(0:011-=+-------θπk k T k j jT j kj μx Σμx μx Σμx这里,分类阈值()()()[]k j k j P P ωωθln ln 2ln ln 0---=ΣΣ。
Bayes 判别分析及应用班级:计算B101姓名:孔维文 学号201009014119指导老师:谭立云教授【摘 要】判别分析是根据所研究个体的某些指标的观测值来推断该个体所属类型的一种统计方法,在社会生产和科学研究上应用十分广泛。
在判别分析之前,我们往往已对各总体有一定了解,样品的先验概率也对其预测起到一定作用,因此进行判别时应考虑到各个总体出现的先验概率;由于在实际问题中,样品错判后会造成一定损失,故判别时还要考虑到预报的先验概率及错判造成的损失,Bayes 判别就具有这些优点;然而当样品容量大时计算较复杂,故而常借助统计软件来实现。
本文着重于Bayes 判别分析的应用以及SPSS 的实现。
【关键词 】 判别分析 Bayes 判别 Spss 实现 判别函数 判别准则Class: calculation B101 name: KongWeiWen registration number 201009014119Teacher: TanLiYun professor.【Abstract 】Discriminant analysis is based on the study of certain indicators of individual observations to infer that the individual belongs as a type of statistical methods in social production and scientific research is widely used. In discriminant analysis, we often have a certain understanding of the overall sample of the a priori probability of its prediction play a role, it should be taken into account to determine the overall emergence of various prior probability; because of practical problems, samples will result in some loss of miscarriage of justice, so identification must be considered when the prior probability and wrongly predicted loss, Bayes discriminant to have these advantages; However, when the sample is large computing capacity of more complex, often using statistical software Guer to achieve. This article focuses on the application of Bayes discriminant analysis, and implementation of SPSS.【Key words 】 Discriminant analysis; Bayes discriminant; Spss achieve; Discriminantfunction; Criteria;1.1.1 判别分析的概念在科学研究中,经常会遇到这样的问题:某研究对象以某种方式(如先前的结果或经验)已划分成若干类型,而每一种类型都是用一些指标T p X X X X ),,(21 来表征的,即不同类型的X 的观测值在某种意义上有一定的差异。