Hydrothermal route to single crystalline a-MoO3
- 格式:pdf
- 大小:269.60 KB
- 文档页数:5
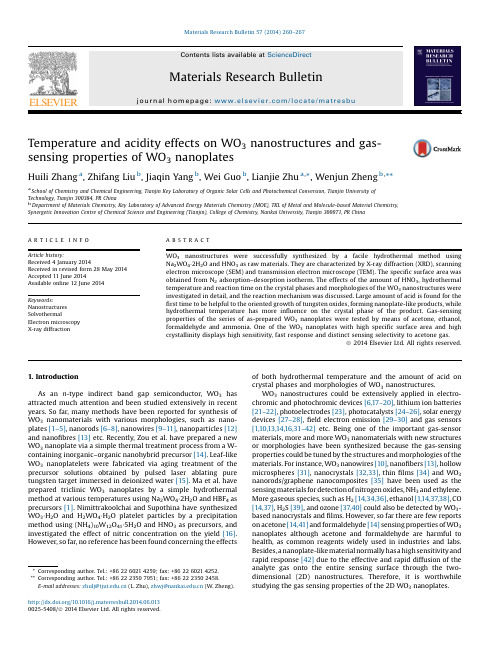
Temperature and acidity effects on WO 3nanostructures and gas-sensing properties of WO 3nanoplatesHuili Zhang a ,Zhifang Liu b ,Jiaqin Yang b ,Wei Guo b ,Lianjie Zhu a ,*,Wenjun Zheng b ,**aSchool of Chemistry and Chemical Engineering,Tianjin Key Laboratory of Organic Solar Cells and Photochemical Conversion,Tianjin University of Technology,Tianjin 300384,PR China bDepartment of Materials Chemistry,Key Laboratory of Advanced Energy Materials Chemistry (MOE),TKL of Metal and Molecule-based Material Chemistry,Synergetic Innovation Centre of Chemical Science and Engineering (Tianjin),College of Chemistry,Nankai University,Tianjin 300071,PR ChinaA R T I C L E I N F OArticle history:Received 4January 2014Received in revised form 28May 2014Accepted 11June 2014Available online 12June 2014Keywords:Nanostructures SolvothermalElectron microscopy X-ray diffractionA B S T R A C TWO 3nanostructures were successfully synthesized by a facile hydrothermal method using Na 2WO 4Á2H 2O and HNO 3as raw materials.They are characterized by X-ray diffraction (XRD),scanning electron microscope (SEM)and transmission electron microscope (TEM).The speci fic surface area was obtained from N 2adsorption –desorption isotherm.The effects of the amount of HNO 3,hydrothermal temperature and reaction time on the crystal phases and morphologies of the WO 3nanostructures were investigated in detail,and the reaction mechanism was rge amount of acid is found for the first time to be helpful to the oriented growth of tungsten oxides,forming nanoplate-like products,while hydrothermal temperature has more in fluence on the crystal phase of the product.Gas-sensing properties of the series of as-prepared WO 3nanoplates were tested by means of acetone,ethanol,formaldehyde and ammonia.One of the WO 3nanoplates with high speci fic surface area and high crystallinity displays high sensitivity,fast response and distinct sensing selectivity to acetone gas.ã2014Elsevier Ltd.All rights reserved.1.IntroductionAs an n -type indirect band gap semiconductor,WO 3has attracted much attention and been studied extensively in recent years.So far,many methods have been reported for synthesis of WO 3nanomaterials with various morphologies,such as nano-plates [1–5],nanorods [6–8],nanowires [9–11],nanoparticles [12]and nano fibres [13]etc .Recently,Zou et al.have prepared a new WO 3nanoplate via a simple thermal treatment process from a W-containing inorganic –organic nanohybrid precursor [14].Leaf-like WO 3nanoplatelets were fabricated via aging treatment of the precursor solutions obtained by pulsed laser ablating pure tungsten target immersed in deionized water [15].Ma et al.have prepared triclinic WO 3nanoplates by a simple hydrothermal method at various temperatures using Na 2WO 4Á2H 2O and HBF 4as precursors [1].Nimittrakoolchai and Supothina have synthesized WO 3ÁH 2O and H 2WO 4ÁH 2O platelet particles by a precipitation method using (NH 4)10W 12O 41Á5H 2O and HNO 3as precursors,and investigated the effect of nitric concentration on the yield [16].However,so far,no reference has been found concerning the effectsof both hydrothermal temperature and the amount of acid on crystal phases and morphologies of WO 3nanostructures.WO 3nanostructures could be extensively applied in electro-chromic and photochromic devices [6,17–20],lithium ion batteries [21–22],photoelectrodes [23],photocatalysts [24–26],solar energy devices [27–28],field electron emission [29–30]and gas sensors [1,10,13,14,16,31–42]etc.Being one of the important gas-sensor materials,more and more WO 3nanomaterials with new structures or morphologies have been synthesized because the gas-sensing properties could be tuned by the structures and morphologies of the materials.For instance,WO 3nanowires [10],nano fibers [13],hollow microspheres [31],nanocrystals [32,33],thin films [34]and WO 3nanorods/graphene nanocomposites [35]have been used as the sensing materials for detection of nitrogen oxides,NH 3and ethylene.More gaseous species,such as H 2[14,34,36],ethanol [1,14,37,38],CO [14,37],H 2S [39],and ozone [37,40]could also be detected by WO 3-based nanocrystals and films.However,so far there are few reports on acetone [14,41]and formaldehyde [14]sensing properties of WO 3nanoplates although acetone and formaldehyde are harmful to health,as common reagents widely used in industries and labs.Besides,a nanoplate-like material normally has a high sensitivityand rapid response [42]due to the effective and rapid diffusion of the analyte gas onto the entire sensing surface through the two-dimensional (2D)nanostructures.Therefore,it is worthwhile studying the gas sensing properties of the 2D WO 3nanoplates.*Corresponding author.Tel.:+862260214259;fax:+862260214252.**Corresponding author.Tel.:+862223507951;fax:+862223502458.E-mail addresses:zhulj@ (L.Zhu),zhwj@ (W.Zheng)./10.1016/j.materresbull.2014.06.0130025-5408/ã2014Elsevier Ltd.All rights reserved.Materials Research Bulletin 57(2014)260–267Contents lists available at ScienceDirectMaterials Research Bulletinj o u r n a l h o m e p a g e :w w w.e l s e v i e r.c o m /l o c a t e /m a t r e s buHerein,a facile hydrothermal route was adopted for syntheses of series of WO3nanostructures.The effects of the amount of HNO3,hydrothermal temperature and reaction time on crystal phases and morphologies of WO3products were investigated and discussed.The formation mechanism of the WO3nanoplates was studied on the basis of control experiments.The gas-sensing properties of the as-prepared WO3on acetone,ethanol,formalde-hyde and ammonia were evaluated,and a nanoplate-like WO3 shows a high sensitivity,rapid response and distinct selectivity to acetone gas.2.Experimental2.1.Synthesis of WO3nanostructuresIn a typical procedure,0.3299g of Na2WO4Á2H2O(1mmol)was added into certain volume of distilled water and dissolved thoroughly under stirring.Then,certain amount of HNO3(w, 65%)was dropped into the solution and kept stirring for10min. The total volume of the solution was always kept to be25.0mL.The above mixture was transferred into a33.0mL of Teflon-lined stainless steel autoclave,sealed and kept in an electric oven at certain temperature for12h.The autoclave was then taken out and allowed to cool naturally to room temperature.The obtained precipitate was separated by centrifugation,washed by distilled water and absolute ethanol for three times,respectively,and dried at50 C.2.2.CharacterizationsThe XRD measurements were performed on a Rigaku D/max-2500diffractometer with Cu K a radiation(l=0.154056nm)at 40kV and100mA.The SEM images were taken with a JEOL JSM-6700F scanning electron microscope.The TEM and high resolution TEM(HRTEM)images of the WO3nanoplates were obtained on a JEOL JEM-2100F microscope operating at200kV.The N2adsorp-tion–desorption isotherm measurements were operated on a V-Sorb2800P surface area and pore size analyzer.2.3.Fabrication and test of WO3gas sensorsThe schematic illustration of the gas-sensing measurement and working principle of HW-30A system can be found in the references[1,43].The WO3nanoplates were slightly grinded with several drops of terpineol in an agate mortar.The formed slurry was coated onto an alumina tube with a diameter of1mm and length of4mm,positioned with a pair of Au electrodes and four Pt wires on both ends of the tube.After calcination at400 C for1h, the alumina tube was jointed with the measuring electric circuit.In order to improve the stability and repeatability,the gas-sensing element was aged at340 C for two weeks before the measure-ment.Acetone,ethanol,formaldehyde and ammonia with various concentrations were chosen to evaluate the gas-sensing properties of the as-prepared WO3.The sensor response is defined as S=R a/R g, where R a and R g are the electrical resistance of the sensor in air and in test gas,respectively.The response and recovery time is defined as the time for the sensor to reach90%of its maximum response and fall to10%of its maximum response,respectively.3.Results and discussion3.1.Effects of hydrothermal temperature and the amount of HNO3on the crystal phases and morphologies of the productsFig.1shows the crystal phase evolution of the products obtained at120 C using various amount of HNO3.When0.5mL of HNO3is used,the main product is orthorhombic WO3ÁH2O(JCPDS 43-0679)with a little impurity(Fig.1a).Increasing the amount of HNO3to1.5mL leads to the formation of a pure orthorhombic WO3ÁH2O(Fig.1b).The monoclinic phase of unhydrous WO3 (JCPDS43-1035)appears when2.5mL of HNO3is used and the relative peak intensity of this phase increases gradually by increasing the volume of HNO3until12.0mL(Fig.1c–f).When the amount of HNO3is further increased,however,no pure phase of monoclinic WO3is produced(Fig.1g and h).On the contrary,the relative intensity of the diffraction peaks of the monoclinic WO3 becomes lower,but that of the WO3ÁH2O phase becomes higher again.When the volume of HNO3reaches20.0mL,the diffraction peaks of the monoclinic WO3phase become even faint.The morphology evolution of the products prepared at120 C using various amount of HNO3is demonstrated in Fig.2.It was observed that the product’s morphology changes greatly in the low volume region of HNO3.A nanoparticle and nanorod mixture was collected when0.5mL of HNO3was used in the reaction system. Slightly increasing the volume of HNO3to1.5mL would lead to the formation of a bigflower-like hierarchical structure which is composed of many crossed and lapped quasi-round nanoplates with rough surfaces.The accumulated quasi-round nanoplates start dispersal and the surfaces become smooth when the volume of HNO3is increased to2.5mL.Most of the nanoplates are about 600nm in diameter and25nm in thickness.If5.0mL of HNO3is used,square-like nanoplates with a side length of around200nm and thickness of30–40nm are obtained.The surfaces of these nanoplates are rather smooth.When the volume of HNO3is in the range of 5.0–12.0mL,the products’morphologies are similar, unless the size of the nanoplate gradually becomes smaller with increasing the acid quantity.Some square-like nanoplates become a bit irregular and their surface roughness also increases if the amount of HNO3reaches15.0mL.Further increasing the amount of HNO3to20.0mL,irregularly shaped nanoplates with rather rough surfaces were obtained.This morphology is similar to that of the product in Fig.2c,unless the size is much smaller.One may notice that the phase composition of these two products(Fig.1c and h)is also similar.The other series of products were obtained at180 C,a higher hydrothermal temperature.The corresponding XRD patterns are shown in Fig.3.Orthorhombic WO3ÁH2O(JCPDS43–0679)was produced using0.5mL of HNO3.Increasing the amount of HNO3to 1.5mL leads to the formation of a mixture with most orthorhombic WO3ÁH2O and a little monoclinic WO3(JCPDS43–1035).The phase compositions of the products change dramatically withslightlyFig. 1.XRD patterns of the products prepared by hydrothermal method at120 C using various amount of HNO3:(a)0.5mL,(b)1.5mL,(c)2.5mL,(d)5.0mL,(e) 10.0mL,(f)12.0mL,(g)15.0mL and(h)20.0mL.H.Zhang et al./Materials Research Bulletin57(2014)260–267261increasing the volume of HNO 3from 1.5mL to 2.0mL.Pure monoclinic WO 3is obtained in the presence of 2.0mL of HNO 3.With further increasing the amount of HNO 3,the crystal phases of the products do not change any more.But the intensity of the diffraction peaks increases firstly and then declines slightly.The peak intensity reaches maximum using 10mL of HNO 3,which indicates the highest crystallinity of the WO 3product obtained at this condition.Thus,10mL of HNO 3is a suitable amount to obtain a pure monoclinic WO 3with a high crystallinity.The morphology evolution of the products prepared at 180 C using various amount of HNO 3is demonstrated in Fig.4.When 0.5mL of HNO 3is used,a nanoparticle –nanorod mixture (Fig.4a)is obtained,similar to the morphology of the product prepared at 120 C (Fig.2a).However,in the case of 1.5mL HNO 3,the two products prepared at these two hydrothermal temperatures have completely different morphologies.As shown in Fig.4b,the product comprises many non-uniform big rectangular blocks andplates.Slightly increasing the HNO 3–2.0mL leads to formation of WO 3nanoplates with different size,and some nanoplates accumulate with their large surfaces.When 10.0mL or 15.0mL of HNO 3is used,the product is well-dispersed nanoplates with the large surfaces exposed (Fig.4d and e).The side length and thickness of an individual nanoplate are approximately 100nm and 40nm,respectively.Changing the amount of HNO 3in the range of 10–15mL does not in fluence the morphology of the products.But in case of 20.0mL HNO 3,the uniformity of the product decreases and the size of the nanoplate increases to certain extent,although its crystal phase is kept unchanged.Because both the uniformity and crystallinity of the sample prepared at 180 C using 10.0mL of HNO 3are high,its TEM and HRTEM images were taken.As shown in Fig.5a,the side length and thickness of the most WO 3nanoplates are around 100nm and 30–40nm,respectively,which is consistent with the SEM result.The clear 2D crystal lattice (Fig.5b)shows that theinterplanarFig. 2.SEM images of the products prepared by hydrothermal method at 120 C using various amount of HNO 3:(a)0.5mL,(b)1.5mL,(c)2.5mL,(d)5.0mL,(e)10.0mL,(f)12.0mL,(g)15.0mL and (h)20.0mL.262H.Zhang et al./Materials Research Bulletin 57(2014)260–267distances are 0.37and 0.38nm,corresponding to (020)and (002)crystal planes,respectively.The fast Fourier transform pattern (the inset)indicates its single crystalline nature.On the basis of above results we conclude that both hydrothermal temperature and the amount of HNO 3in fluence the crystal phase and morphology of the product.Fig.6shows a summary of these two effects.Similar to the result in our previous work [1],low temperature favours the formation of WO 3ÁH 2O andhigh temperature is propitious to production of anhydrous WO 3.Increasing temperature results in dehydration of WO 3ÁH 2O,forming pure WO 3phase,even using a small volume of HNO 3(for example,2.0mL HNO 3).However,at the low hydrothermal temperature,120 C,no pure phase of WO 3was obtained even if a large volume of HNO 3was used.In the region of small volume of HNO 3,the crystal phases and morphologies of the products are found more sensitive to the change in acid quantity and reaction temperature.For instance,when 1.5mL of HNO 3was used,a hierarchical flower-like hydrous WO 3was formed at 120 C,but a non-uniform rectangular block and plate-like hydrous and anhydrous WO 3mixture is the main product at 180 C.This may be attributed to different nucleation rate,diffusion rate of nanoparticles and dehydration rate at different temperatures.At high temperature,the formation rate of tungsten oxide nucleus is fast and the hydrous WO 3loses water quickly once beyond its decomposition temperature,which partially counteracts the in fluence of larger amount of water on the crystal phase of the product when small volume of HNO 3is used.Moreover,the diffusion rate of nanoparticles is low at low temperature,which contributes to the formation of a big architecture.But a high diffusion rate at high temperature helps to epitaxy along certain crystal face [44].Therefore,different morphological products were produced at two hydrothermal temperatures using 1.5mL of HNO 3.When large amount of HNO 3(for instance,10mL HNO 3)is used,however,it is different from the above case.The similar morphology of the two products obtained at the twotemperaturesFig. 3.XRD patterns of the products prepared by hydrothermal method at 180 C using various amount of HNO 3:(a)0.5mL,(b)1.5mL,(c)2.0mL,(d)10.0mL,(e)15.0mL and (f)20.0mL.Fig.4.SEM images of the products prepared by hydrothermal method at 180 C using various amount of HNO 3:(a)0.5mL,(b)1.5mL,(c)2.0mL,(d)10.0mL,(e)15.0mL and (f)20.0mL.H.Zhang et al./Materials Research Bulletin 57(2014)260–267263clearly shows that large amount of acid is bene ficial to the oriented growth of the tungsten oxides,forming nanoplates.This,on the one hand,may be related to the high degree of supersaturation of the solution,which will increase the nucleation rate and dehydration rate of H 2WO 4,and ultimately increase the reaction rate.On the other hand,the acidity of a reaction system in fluences surface energies of certain crystal facets [45],which may signi ficantly in fluence the oriented growth of a crystal,and consequently in fluence the morphology of the product.Thus,suitable amount of acid is a dominant factor to the formation of nanoplate-like morphology.However,the acidity effect on the crystal phase of the product is found weaker than that of temperature.The low nucleation rate at 120 C results in the larger size of the nanoplates (compared to the product prepared at 180 C),which accords with the crystallization principle.The low dehydration rate at the lower temperature leads to incomplete dehydration of the product,forming a mixed phase of product.Thus,a larger size of mixed phase of nanoplate was obtained at 120 C using 10mL of HNO 3.3.2.Formation mechanismBecause the product prepared at 180 C using 15.0mL of HNO 3shows the better gas-sensing property,its time-dependent crystal phase and morphology evolutions were investigated.It represents the effect of hydrothermal time on the crystal phase and morphology of a WO 3nanostructure.As shown in Fig.S1and S2in the supporting information (ESI),pure uniform orthorhombic WO 3ÁH 2O (JCPDS 43–0679)nanoplates were obtained at 1h,which were quickly transformed to WO 3nanoplates.A mixture of WO 3ÁH 2O and WO 3was collected at 1.5h and pure monoclinic WO 3(JCPDS 43-1035)nanoplates were produced at 2h.These results con firm that a hydrous WO 3was formed at the early stage of the reaction and prolonging hydrothermal time results in a quick dehydration of WO 3ÁH 2O.The corresponding chemical reactions contain:WO 2À4þ2H þ!WO 3ÁH 2O(1)WO 3ÁH 2O !WO 3þH 2O(2)This reaction process is similar to the work by Lee et al.[46,46],where the high concentrations of HNO 3(0.29–11.5mol L À1)were replaced by low concentrations of HCl (pH 2–6)and NaCl was used as a capping agent.However,WO 3nanorods were obtained in their work although a similar procedure was applied.Lee et al.believed that NaCl selectively adsorbed onto the crystal planes parallel to the c -axes of WO 3crystal nucleus to accelerate the preferential growth,resulting in the formation of 1D structure.In our case,no capping agent or directing agent was used.Besides,as shown in Fig.6,a large amount of acid is bene ficial to the oriented growth of nanoplate-like tungsten oxides.Except the external factors,the intrinsic crystal structure is also an essential factor for morphology control of the product.The orthorhombic H 2WO 4consists of layers of [WO 6]octahedra,which share their four equatorial oxygen atoms.Water molecules and oxygen atoms in the axial positions of the [WO 6]octahedra form hydrogen bonds with the neighboring layers [3],as shown in Fig.S3a in the ESI.The monoclinic WO 3possesses a distorted ReO 3structure,see Fig.S3b.The layers of [WO 6]octahedra in the orthorhombic H 2WO 4and the monoclinic WO 3are similar.The shared four equatorial oxygen atoms extend forming a 2D plane structure.At high temperature,the hydrogen bonds in the layers of [WO 5(OH 2)]octahedra of the H 2WO 4were replaced by W ÀÀO ÀÀW bonds forming a three-dimensional W ÀÀO ÀÀW lattice-work and losing the crystal waters.The similarity of the WO 6octahedral sheets in H 2WO 4and WO 3results in the formation of the nanoplate-like WO 3.3.3.Gas-sensing properties and mechanismAll gas-sensing measurements were operated at 300 C.Therefore,the samples were calcined at 450 C for 2h before the gas-sensing measurements to ensure their thermal stability.The XRD patterns of the calcined WO 3samples are shown in Fig.S4in the ESI.All diffraction peaks for all the samples can be indexedtoFig. 5.(a)TEM and (b)HRTEM images of the sample prepared at 180 C using 10.0mL of HNO 3(the inset is the fast Fourier transformpattern).Fig.6.Schematic representation of the formation of the WO 3nanostructures with various morphologies and crystal phases:(a)orthorhombic WO 3ÁH 2O,(b)a mixture of orthorhombic WO 3ÁH 2O and monoclinic WO 3and (c)monoclinic WO 3,prepared at two hydrothermal temperatures using various amount of HNO 3.264H.Zhang et al./Materials Research Bulletin 57(2014)260–267monoclinic WO3(JCPDS43-1035),which indicates that pureanhydrous WO3products were obtained after the heat treatment.The SEM images of the calcined WO3samples,Fig.S5in the ESI,demonstrate that the product morphologies before and after theheat treatment are similar,which verifies again that thecondensation from WO3ÁH2O to WO3is a topotactic conversion process.The synthetic conditions of the precursors,the morphol-ogies and Brunauer–Emmett–Teller(BET)surface areas of thecalcined WO3products are summarized in Table1.The gas-sensing properties of the series of WO3nanomaterialsarefirst evaluated by means of200ppm acetone gas(Fig.7a).Theresults show that the sensor based on the S3sample is moresensitive than the others.The response of the S2sensor is slightlylower than that of the S3sensor.The third sensitive sensor is basedon the P3sample.The high responses of the S2,S3and P3sensorsmay be attributed to their high BET surface areas,highcrystallinities and plate-like morphologies[38].The most sensitive three sensors based on the samples S2,S3and P3were then chosen to investigate the sensitivities in thepresence of various concentrations of acetone gases,from10ppmto400ppm.As shown in Fig.7b,the S3sensor always has thehigher response than the other two sensors to any concentration ofacetone gas.The responses for all the three sensors increasesignificantly with increasing the concentration of acetone gas.Forinstance,the response for the S3sensor increases from4.1to15.8with increasing the concentration of acetone from10ppm to400ppm.Fig.8a represents the dynamic responses of the S2,S3and P3sensors to acetone gases with various concentrations from10ppmto400ppm.Sharp rises and drops in voltage values were observedfor all concentrations of acetone gases when they were injectedand discharged,respectively.This indicates that the WO3nano-plate sensors have a wide range of acetone-detecting abilities andare of fast response and recovery speeds to acetone gases.Forexample,the response and recovery time of the S3sensor are7sand23s,respectively,for100ppm acetone gas(Fig.8b).The resultsalso show that the response increases with increasing theconcentration of acetone gas at the same operating conditions.The sensing selectivity of the S3sensor was explored bycomparing the responses of the S3sensor to acetone,ethanol,formaldehyde and ammonia gases with various concentrations.Asshown in Fig.9,the responses of the S3sensor to all the four gasesincrease gradually with increasing the concentrations of the gases.However,the order of magnitude of the responses to differentgases is quite different.It is less sensitive to ethanol and almostinsensitive to formaldehyde and ammonia,compared to acetone.Thus,the as-prepared WO3nanoplate(S3)displays a distinctsensing selectivity to acetone gas,which could be explained byconsidering its sensing mechanism.As an n-type semiconductor,the sensing mechanism of theWO3nanoplate could be explained using the classical electrondepletion theory[41,47,48].Oxygen molecules in airfirst physically adsorb on the surface of WO3semiconductor.The O2(ads)capturesan electron from WO3forming OÀ2(ads).At an elevated tempera-ture,the chemically adsorbed O2(ads)molecules can obtainenough energy to capture two electrons or OÀ2(ads)to capture one more electron forming OÀ(ads).Because the oxygen ionosorption depletes electrons in the conduction band,conductance of the WO3 sensor is decreased.When the WO3nanoplate sensor is exposed to the reducing gases,acetone,ethanol,formaldehyde and ammonia, the gases react with the OÀ(ads)on the surface of WO3.Referring to the references[49,50],the reactions could be expressed by the following Eqs.(3)–(6).CH2Oþ2OÀðadsÞ!CO2þH2Oþ2eÀ(3) C2H5OHþ6OÀðadsÞ!2CO2þ3H2Oþ6eÀ(4) CH3COCH3þ8OÀðadsÞ!3CO2þ3H2Oþ8eÀ(5) NH3þ5=2OÀðadsÞ!NOþ3=2H2Oþ5=2eÀ(6) The gas removes chemisorbed oxygen anions and releases electrons to the conduction band.This will decrease the amount of the surface OÀ(ads)and increase the concentration of electrons in the conduction band,which eventually increases the conductance of the WO3sensor.According to the Eqs.(3)–(5),more electrons are released with increasing carbon chain.Consequently,the response increases because of the increased conductance of the sensor. Therefore,the gas response of acetone is higher than those of ethanol and formaldehyde gases at the equivalent concentration.As it is known that WO3is an acid oxide and generally it shows relatively high response to ammonia[13,41,51,52],but this is not always the case.For instance,Yu et al.reported that the gas responses of the WO3nanorods are7.6,18and27.5for1mL of ammonia,ethanol and acetone,respectively[35].A similar result was also found by Li and his co-workers[53],where the gas responses of the WO3hollow-spheres are2.89,6.14and13.50for 500ppm of ammonia,ethanol and acetone gases,respectively. These works show that the responses of the WO3nanostructures to ammonia gases are low and much lower than those of ethanol and acetone gases at the equivalent condition,which is similar to our result.Wefind that the response of the as-prepared WO3nanoplate to the alkaline gas,NH3,is lower than those of ethanol and acetone gases although it is slightly higher than that of formaldehyde.One may notice that the four gas responses(Fig.9)of the WO3 nanoplate increase with increasing the quantity of the released electrons(Eqs.3–6).This further confirms the proposed sensing mechanism above.From this point of view,it is reasonable that the as-prepared WO3nanoplate shows a distinct sensing selectivity to acetone gas.The sensing performance of a material can be strongly affected by a few factors.The higher the BET surface area is,the higher the oxygen-adsorption quantity is,and the higher sensitivity the WO3 sensor has[54].High crystallinity is also beneficial to highTable1The synthetic conditions of the precursors and properties of the WO3products after calcination at450 C for2h.Samples T( C)HNO3(mL)[H+](mol LÀ1)Morphologies Surface areas(m2gÀ1)P1120 5.0 2.9Nanoplate17.6P212010.0 5.8Nanoplate24.2P312012.0 6.9Nanoplate28.7P412015.08.6Nanoplate25.3S1180 2.0 1.2Big block and plate12.2S218010.0 5.8Nanoplate23.9S318015.08.6Nanoplate40.1S418020.011.5Nanoplate19.4H.Zhang et al./Materials Research Bulletin57(2014)260–267265sensitivity of a WO 3sensor [38].Therefore,the S3sensor has the highest value of acetone response due to the largest BET surface area exposed to gas and good crystallinity.Besides,the plate-like morphology of the WO 3allows for rapid diffusion of acetone molecules,which results in a fast gas-sensing response.In a word,the WO 3nanoplate (S3)is very promising for fabrication of an acetone gas sensor because of its high sensitivity,distinct selectivity and fast response to acetone gas.4.ConclusionsSeries of tungsten oxide nanostructures with different crystal phases and morphologies have been synthesized at two temper-atures by a facile hydrothermal method using various amount of HNO 3,and the formation mechanism of the WO 3nanoplate was explored based on series of time-dependant control experiments.The results show that the tungstate first reacts with hydrion forming hydrous WO 3,followed by a dehydration rge amount of acid,high temperature and long reaction time are found generally bene ficial to the formation of anhydrous WO 3nano-plates.It is worth mentioning that large amount of acid is found helpful to the oriented growth of the tungsten oxides,forming a nanoplate-like product.But the effect of acid quantity on the crystal phase of a product is weaker than that of temperature.The low dehydration rate at the low temperature (120 C)leads to incompletely dehydration of the product,forming a WO 3ÁH 2O and WO 3mixed phase of nanoplate,even if a large amount of acid (10mL)is used.At the high hydrothermal temperature (180 C)the nucleation rate,diffusion rate of nanoparticles and dehydration rate are increased signi ficantly,resulting in the formation of pure monoclinic WO 3nanoplates,even if a small amount of acid (2mL)is used.The gas-sensing measurements show that the sensitivities of the sensors based on the S3,S2and P3samples are the top three in the presence of 200ppm acetone gas.The S3sensor shows a distinct selectivity and fast response to acetone gas,which implies that the WO 3nanoplate (S3)is a promising material for fabrication of an acetone gassensor.Fig.7.Response comparison of the sensors based on the samples (a)P1-P4and S1-S4in the presence of 200ppm acetone gas and (b)P3,S2and S3in the presence of various concentrations of acetonegases.Fig.8.(a)Dynamic response –recovery curves of the P3,S2and S3sensors for acetone gas detection and (b)response transients of the S3sensor to 100ppm acetone gas.R e s p o n s eConce ntration /pp mFig.9.Sensing selectivity of the S3sensor to four gases with variousconcentrations.266H.Zhang et al./Materials Research Bulletin 57(2014)260–267。

Template-free synthesis of mesoporous single-crystal CuO particleswith dumbbell-shaped morphologySourav Ghosh,Mouni Roy,Milan Kanti Naskar nSol-Gel Division,CSIR-Central Glass and Ceramic Research Institute,Kolkata700032,Indiaa r t i c l e i n f oArticle history:Received18September2013Accepted9June2014Available online16June2014Keywords:Mesoporous CuOSelf-assemblyHydrothermalCrystallizationPorous materialMicrostructurea b s t r a c tDumbbell-shaped CuO particles were synthesized by a rapid hydrothermal process at1501C/2h viatemplate-free route.Powder X-ray diffraction(PXRD)showed the crystallization of Cu2(OH)2CO3in theas-prepared samples,and monoclinic CuO phase for3001C-treated samples.The BET surface area,totalpore volume and average pore diameter of the samples were found to be67.4m2gÀ1,0.39cm3gÀ1,and23nm,respectively.Microstructural analysis indicated dumbbell-shaped morphology comprising of self-assembled microrod-like particles(length2–10μm,dia200–300nm).Single-crystalline nature of theparticles was confirmed by selected area electron diffraction(SAED)and high resolution transmissionelectron microscopy(HRTEM)images.A tentative formation mechanism was illustrated.&2014Elsevier B.V.All rights reserved.1.IntroductionSynthesis of hierarchical micro-and/or nanomaterials,self-assembled building blocks,has attracted much attention due totheir novel properties and potential applications in optoelectro-nics,magnetics and biology[1].Morphology,shape and size of theparticles play a significant role in determining physico-chemicalproperties of metal oxides[2].Mesoporous transition metal oxidesbecause of their large surface-to-volume ratio,abundant porousstructures,and certain degree of size and shape selectivity areadvantageous for many important applications[3].Copper oxides,in particular are important functional materials to be used ascatalyst,gas sensors,superconductors,lithium-ion-batteries,supercapacitors etc.[4,5].Self-assembly of CuO nanostructureswith controlled organization of primary building units into differ-ent morphologies like ellipsoids,microflowers dandelions,micro-worms,microurchins,and hollow microstructures have demandedin new technological applications[6].Xu et al.[7]synthesized2DCuO nanoleaves from1D Cu(OH)2nanowires via hierarchical-oriented attachment.Recently,we have synthesized polycrystal-line hierarchical hollow CuO microspheres[8]by the hydrother-mal method.Single-crystalline nanostructured CuO was preparedby different methods,like the thermal oxidation process[9],oxidation of Cu metal in the presence of formamide[10]andsolution-based synthesis using sodium dodecyl benzenesulfonateas templating agent[11].Synthesis of mesoporous dumbbell-shaped CuO is importantdue to their fundamental shape-dependent properties and surfacereactivity toward many applications.Singh et al.[12]reported thatdumbbell shaped nickel nanoparticles are more advantageousthan conventional nanoparticles or core–shell structures in termsof better magnetic properties.They suggested that dumbbellshaped particles comprised of two different surfaces providingdifferent surface chemistry in one particle.Zhong et al.[13]proposed orientation aggregation mechanism for the synthesis ofdumbbell-shaped manganese oxide via pyrolysis of manganeseformate in trioctylamine/oleic acid medium.Dumbbell-shapedCuO was synthesized in the presence of organic surfactant(sodium dodecyl sulfate,SDS)and copper dodecyl sulfate(CU(DS)2)via their hydrophobic interactions[14].Keeping the above views in mind,the objective of the presentwork was to design a simple synthesis approach to preparemorphologically controlled CuO particles with hierarchical struc-ture and mesoporosity.In this work,to the best of our knowledge,we report for thefirst time the synthesis of dumbbell-shapedmesoporous single-crystal CuO by a rapid hydrothermal processvia a facile template-free route in the presence of aqueous-basedprecursors.2.ExperimentalIn a typical synthesis,5mmol Cu(NO3)2and25mmol ureawere dissolved into50mL deionized(DI)water under stirring.Themix solution was transferred into a100mL Teflon-lined autoclave,followed by a hydrothermal treatment at1501C for2h.After theContents lists available at ScienceDirectjournal homepage:/locate/matletMaterials Letters/10.1016/j.matlet.2014.06.0450167-577X/&2014Elsevier B.V.All rightsreserved.n Corresponding author:Tel.:þ913324733496x3516;fax:þ913324730957.E-mail address:milan@cgcri.res.in(M.K.Naskar).Materials Letters132(2014)98–101reaction,the particles were collected by centrifugation and wash-ing with DI water,and dried at 601C for 4h.The dried as-prepared powders were calcined at 3001C with a heating rate of 11C min À1and dwell time of 2h.X-ray diffraction (XRD)studies of the calcined powders were performed by Philips X'Pert Pro PW 3050/60powder diffract-ometer using Ni-filtered Cu-K αradiation (λ¼0.15418nm)oper-ated at 40kV and 30mA.The crystallite size (d )of CuO was determined by XRD peak analysis based on Scherrer's Equation:d ¼0.9λ/B cos θ,where,λis the wavelength of Cu-K α,B is the full width at half maximum intensity peak (FWHM)in radian and θis the angle of the largest peak.Nitrogen adsorption –desorption measurements were conducted at 77K with a Quantachrome (ASIQ MP,USA)instrument.The powders were outgassed in vacuum at 2501C for 4h prior to the measurement.The surface area was obtained using the Brunauer –Emmet –Teller (BET)method within the relative pressure (P/P o )range of 0.05–0.20and the pore size distribution was calculated by the Barret –Joyner –Halenda (BJH)method.The nitrogen adsorption volume at the relative pressure (P/P o )of 0.99was used to determine the pore volume.The morphology of the powders was examined by field emission scanning electron microscopy,FESEM with Zeiss,0.00.20.40.60.8 1.050100150200250300p/po10203040506070Fig.1.(a)XRD patterns of the particles (i)as-prepared and (ii)calcined (3001C),and (b)N 2adsorption and desorption isotherms of mesoporous CuO.Inset shows pore size distributions evaluated from the adsorption isotherm.Fig.2.FESEM images of dumbbell-shaped particles:(a and b)as-prepared and (c and d)calcined at 3001C.S.Ghosh et al./Materials Letters 132(2014)98–10199Supra TM35VP instrument operating with an accelerating voltage of10kV,and transmission electron microscopy,TEM using a Tecnai G230ST(FEI)instrument operating at300kV.For TEM study Mo grid was used.3.Results and discussionThe XRD pattern(Fig.1a)shows the characteristic peaks of(i)as-prepared and(ii)calcined(3001C)samples.In the as-prepared sample,Cu2(OH)2CO3crystalline phase(JCPDS76-0660)was observed while monoclinic CuO phase(JCPDS05-0661)was identi-fied for3001C-treated sample.Fig.1b shows the nitrogen adsorp-tion–desorption isotherms of the CuO particles.It displays type IV isotherm according to IUPAC classification,which indicated meso-porous characteristic of the sample.The appearance of type H-3 hysteresis loop at high relative pressures indicated the formation of mesopores between platelike particles.It is to be noted that the uptake of nitrogen increased steeply above the relative pressure of about0.75.The BJH pore size distribution(PSD)derived from adsorption data of the isotherms is shown in the inset of Fig.1b. The broader PSD was due to the formation of interparticle void spaces[15]of CuO nanoparticles as well as the absence of regular shape and size of the pores in the samples.The BET surface area, total pore volume and average pore diameter of the particles were found to be67.4m2gÀ1,0.39cm3gÀ1and23nm,respectively.Fig.2shows the FESEM microstructures of(a and b) as-prepared,and(c and d)3001C-treated sample.It is clear that dumbbell-like morphology remained unchanged upon calcination at3001C.Interestingly,it was noticed that self-assembly of rod-shaped(length2–10μm,diameter200–300nm)particles rendered dumbbell-shaped(5–20μm)structure.The higher mag-nification image of the dumbbell(Fig.2d)indicates that some plate-like particles were grown in a patterned form at both ends of the dumbbell.The TEM image(Fig.3a)also confirms the rod-like particles of CuO.It indicates that nanometer sized primary particles(10–20nm)self-assembled together forming rod-shaped particles(inset in Fig.3a).The interparticle voids were generated between the component subunits.The primary particle size measured by Scherrer's equation was found to be13nm which was in good agreement with the TEM observation.The microstructures were further studied by selected area electron diffraction(SAED)and high resolution TEM(HRTEM).The appear-ance of slightly elongated diffraction spots in the SAED pattern (Fig.3b)of CuO micro-rods indicates single crystals,which can be indexed to the phase pure monoclinic CuO[10].The elongated diffraction spots in the micro-rod indicated the presence of multi-ple nanodomains with a small misorientation.It caused a random alignment among nanocrystallites in the microrods.The lattice image in HRTEM(Fig.3c)also confirms the single-crystal nature of CuO micro-rod with a lattice spacing of0.252nm for the(002) plane[11].The TEM-EDS analysis(Fig.3d)reveals theuniform Fig.3.(a)TEM of rod-like CuO derived from dumbbell shaped structure(b)SAED pattern,(c)HRTEM image,and(d)EDX pattern.S.Ghosh et al./Materials Letters132(2014)98–101100distribution of copper and oxygen in the particles with their atomic concentration ratio of about 1.Fig.4shows a tentative formation mechanism.Under hydro-thermal reaction condition at 1501C,urea decomposed slowly with the formation of NH 3and CO 2.In aqueous medium,copper nitrate interacted with CO 2forming Cu 2(OH)2CO 3.The Cu 2(OH)2CO 3under heat treatment at 3001C was converted to CuO.The following probable reactions are described:CO(NH 2)2þxH 2O -2NH 3þCO 2þ(x À1)H 2O (1)2Cu(NO 3)2þCO 2þ3H 2O -Cu 2(OH)2CO 3þ4HNO 3(2)Cu 2(OH)2CO 3-2CuO þCO 2þH 2O(3)It is mentioned worthy that the nuclei of Cu 2(OH)2CO 3were formed first in the presence of decomposable urea.With the progress of reaction time,these nuclei oriented into rod shaped particles following “oriented attachment ”mechanism [16].In this growth mechanism,spontaneous self-organization of the smaller particles took place with a common crystallographic orientation.The rod-like particles further self-assembled into dumbbell-shaped morphology through stepwise orientation and aggregation of a large number of nanoparticles into single-crystalline archi-tectures in three dimensions.4.ConclusionsMesoporous single-crystal CuO with dumbbell-shaped morphol-ogy was obtained by a simple and rapid hydrothermal process at 1501C/2h without using any organic templates.The hierarchical architecture of the synthesized particles could have signi ficant affect on their catalytic,electronic and magnetic properties.It could find potential applications in the field of catalysis,magnetic storage media,field emission (FE)emitter,solar cell etc.The present methodhas technological impact in terms of morphologically controlled synthesis by a simple process.AcknowledgmentThe authors would like to thank the Director of this Institute for his kind permission to publish this paper.They also acknowledge the help rendered by Material Characterization division for mate-rial characterizations.The authors (S.Ghosh and M.Roy)are thankful to CSIR for their fellowship.The work was funded by DST-SERB Project,Government of India (No.GAP 0616).References[1]Dinsmore AD,Hsu MF,Nikolaides MG,Marquez M,Bausch AR,Weitz DA.Science 2002;298:1006–9.[2]Sun S,Sun Y,Zhang X,Zhang H,Song X,Yang Z.CrystEngComm2013;15:5275–82.[3]Bach U,Lupo D,Comte P,Moser JE,Weissortel F,Salbeck J,et al.Nature1998;395:583–5.[4]Qiu G,Dharmarathna S,Zhang Y,Opembe N,Huang H,Suib SL.J Phys Chem C2012;116:468–77.[5]Yuan YF,Pei YB,Fang J,Zhu HL,Yang JL,Guo SY.Mater Lett 2013;91:279–82.[6]Liu B,Zeng HC.J Am Chem Soc 2004;126:8124–5.[7]Xu H,Wang W,Zhu W,Zhou L,Ruan M.Cryst Growth Des 2007;7:2720–4.[8]Ghosh S,Naskar MK.RSC Adv 2013;3:13728–33.[9]Cheng S-L,Chen M-F.Nanoscale Res Lett 2012;7:119–25.[10]Zhang Z,Sun H,Shao X,Li D,Yu H,Han M.Adv Mater 2005;17:42–7.[11]Wang X,Xi G,Xiong S,Liu Y,Xi B,Yu W,et al.Cryst Growth Des2007;7:930–4.[12]Singh MK,Agarwal A,Gopal R,Swarnkar RK,Kotnala RK.J Mater Chem2011;21:11074–9.[13]Zhong X,Xie R,Sun L,Lieberwirth I,Knoll W.J Phys Chem B 2006;110:2–4.[14]Wang H,Shen Q,Li X,Liu ngmuir 2009;25:3152–8.[15]Yu J,Wang J,Li Z,Li L,Liu Q,Zhang M,et al.Cryst Growth Des2012;12:2872–6.[16]Penn RL,Ban field JF.Science 1998;281:969–71.Fig.4.Schematic representation of the proposed formation mechanism for dumbbell shaped morphology of CuO.S.Ghosh et al./Materials Letters 132(2014)98–101101。

2017年第36卷第11期 CHEMICAL INDUSTRY AND ENGINEERING PROGRESS·4057·化 工 进展蒽醌法生产过氧化氢加氢催化剂的研究进展王松林1,程义1,张晓昕2,宗保宁2(1浙江巴陵恒逸己内酰胺有限责任公司,浙江 杭州 311228;2中国石化石油化工科学研究院,北京 100083) 摘要:加氢催化剂是蒽醌法生产过氧化氢(H 2O 2)的核心,很大程度上决定了装置的生产能力和成本,因而一直是蒽醌法工艺中的研究热点和需要重点突破的课题之一。
高活性、高选择性和高稳定性的加氢催化剂不仅能显著提高生产效率,还可明显减少蒽醌降解物的生成,从而降低生产成本。
本文简述了用于蒽醌加氢的镍基和钯基催化剂研究进展,特别重点介绍了Al 2O 3负载的钯基催化剂。
总结了Al 2O 3载体的物理性质、表面酸性和修饰等因素对钯基加氢催化剂性能的影响,还介绍了近年来发展的新型钯基加氢催化剂。
在此基础上,指出比表面积和孔径均较大、酸性和钯层厚度均适中、并且加入适当修饰剂的蛋壳型载钯催化剂是理想的蒽醌加氢催 化剂。
关键词:过氧化氢;蒽醌法;加氢;镍催化剂;钯催化剂;氧化铝中图分类号:TQ426.94 文献标志码:A 文章编号:1000–6613(2017)11–4057–07 DOI :10.16085/j.issn.1000-6613.2017-0214Advances in hydrogenation catalyst for the production of hydrogenperoxide through the anthroquinone routeWANG Songlin 1,CHENG Yi 1,ZHANG Xiaoxin 2,ZONG Baoning 2(1Zhejiang Baling Hengyi Caprolactam Co.,Ltd.,Hangzhou 311228,Zhejiang ,China ;2Research Institute of PetroleumProcessing ,SINOPEC ,Beijing 100083,China )Abstract :Hydrogenation catalyst is the core for the production of hydrogen peroxide (H 2O 2)through theanthraquinone route ,which determines the production capacity and cost to a large extent ,and thus it has always been the research spot and one of the key topics that needs to be studied. A hydrogenation catalyst with high activity ,selectivity ,and stability not only enhances the production efficiency ,but also significantly decreases the formation of the degradation products derived from anthraquinone ,and thus reduces the production cost. Herein ,advances in the nickel and palladium-based catalysts for the hydrogenation of anthraquinone are reviewed ,with special emphasis on the Al 2O 3-supported palladium-based catalysts. The effects of physical properties ,surface acidity ,and modification of the Al 2O 3 support on the catalytic performance of palladium-based catalysts are reviewed. In addition ,the recently developed novel palladium-based hydrogenation catalysts are also introduced. Finally ,it is concluded that egg-shell palladium catalyst with large surface area and pore size ,medium acidity and palladium penetration depth ,and modified by proper additive(s),is the ideal catalyst for anthraquinone hydrogenation.Key words :hydrogen peroxide ;anthraquinone route ;hydrogenation ;nickel catalyst ;palladium catalyst ;alumina生产及管理工作。
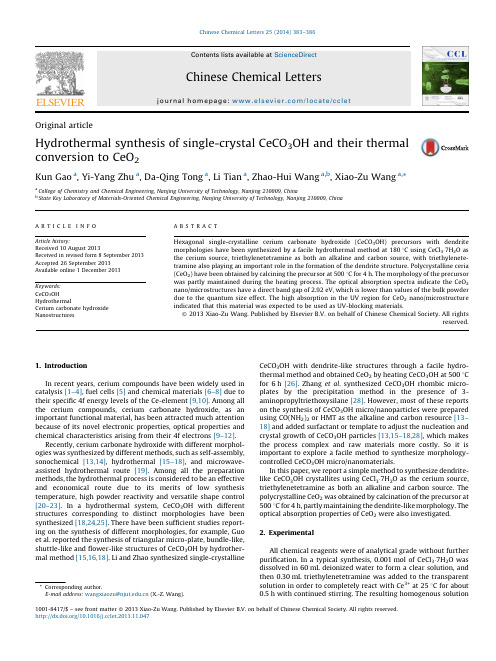
OriginalarticleHydrothermal synthesis of single-crystal CeCO3OH and their thermal conversion to CeO2Kun Gao a,Yi-Yang Zhu a,Da-Qing Tong a,Li Tian a,Zhao-Hui Wang a,b,Xiao-Zu Wang a,*a College of Chemistry and Chemical Engineering,Nanjing University of Technology,Nanjing210009,Chinab State Key Laboratory of Materials-Oriented Chemical Engineering,Nanjing University of Technology,Nanjing210009,China1.IntroductionIn recent years,cerium compounds have been widely used incatalysis[1–4],fuel cells[5]and chemical materials[6–8]due totheir specific4f energy levels of the Ce-element[9,10].Among allthe cerium compounds,cerium carbonate hydroxide,as animportant functional material,has been attracted much attentionbecause of its novel electronic properties,optical properties andchemical characteristics arising from their4f electrons[9–12].Recently,cerium carbonate hydroxide with different morphol-ogies was synthesized by different methods,such as self-assembly,sonochemical[13,14],hydrothermal[15–18],and microwave-assisted hydrothermal route[19].Among all the preparationmethods,the hydrothermal process is considered to be an effectiveand economical route due to its merits of low synthesistemperature,high powder reactivity and versatile shape control[20–23].In a hydrothermal system,CeCO3OH with differentstructures corresponding to distinct morphologies have beensynthesized[18,24,25].There have been sufficient studies report-ing on the synthesis of different morphologies,for example,Guoet al.reported the synthesis of triangular micro-plate,bundle-like,shuttle-like andflower-like structures of CeCO3OH by hydrother-mal method[15,16,18].Li and Zhao synthesized single-crystallineCeCO3OH with dendrite-like structures through a facile hydro-thermal method and obtained CeO2by heating CeCO3OH at5008Cfor6h[26].Zhang et al.synthesized CeCO3OH rhombic micro-plates by the precipitation method in the presence of3-aminopropyltriethoxysilane[28].However,most of these reportson the synthesis of CeCO3OH micro/nanoparticles were preparedusing CO(NH2)2or HMT as the alkaline and carbon resource[13–18]and added surfactant or template to adjust the nucleation andcrystal growth of CeCO3OH particles[13,15–18,28],which makesthe process complex and raw materials more costly.So it isimportant to explore a facile method to synthesize morphology-controlled CeCO3OH micro/nanomaterials.In this paper,we report a simple method to synthesize dendrite-like CeCO3OH crystallites using CeCl3Á7H2O as the cerium source,triethylenetetramine as both an alkaline and carbon source.Thepolycrystalline CeO2was obtained by calcination of the precursor at5008C for4h,partly maintaining the dendrite-like morphology.Theoptical absorption properties of CeO2were also investigated.2.ExperimentalAll chemical reagents were of analytical grade without furtherpurification.In a typical synthesis,0.001mol of CeCl3Á7H2O wasdissolved in60mL deionized water to form a clear solution,andthen0.30mL triethylenetetramine was added to the transparentsolution in order to completely react with Ce3+at258C for about0.5h with continued stirring.The resulting homogenous solutionChinese Chemical Letters25(2014)383–386A R T I C L E I N F OArticle history:Received10August2013Received in revised form8September2013Accepted26September2013Available online1December2013Keywords:CeCO3OHHydrothermalCerium carbonate hydroxideNanostructuresA B S T R A C THexagonal single-crystalline cerium carbonate hydroxide(CeCO3OH)precursors with dendritemorphologies have been synthesized by a facile hydrothermal method at1808C using CeCl3Á7H2O asthe cerium source,triethylenetetramine as both an alkaline and carbon source,with triethylenete-tramine also playing an important role in the formation of the dendrite structure.Polycrystalline ceria(CeO2)have been obtained by calcining the precursor at5008C for4h.The morphology of the precursorwas partly maintained during the heating process.The optical absorption spectra indicate the CeO2nano/microstructures have a direct band gap of2.92eV,which is lower than values of the bulk powderdue to the quantum size effect.The high absorption in the UV region for CeO2nano/microstructureindicated that this material was expected to be used as UV-blocking materials.ß2013Xiao-Zu Wang.Published by Elsevier B.V.on behalf of Chinese Chemical Society.All rightsreserved.*Corresponding author.E-mail address:wangxiaozu@(X.-Z.Wang).Contents lists available at ScienceDirectChinese Chemical Lettersj o u rn a l h om e p a g e:w w w.e l s e v i e r.c o m/l o c a t e/c c l e t1001-8417/$–see front matterß2013Xiao-Zu Wang.Published by Elsevier B.V.on behalf of Chinese Chemical Society.All rights reserved./10.1016/let.2013.11.047was transferred to a 100mL Teflon-line stainless steel autoclave,which was sealed and maintained at 1808C for 24h,and cooled to room temperature naturally.The white precipitate was collected by centrifugation,washed several times with distilled water and ethanol,and dried at 708C for 6h.The as-synthesized CeCO 3OH was calcined to produce straw-yellow CeO 2in air at 5008C for 4h.The XRD measurements were performed on a Bruker-D8Advanced X-ray diffractometer,equipped with graphite-monochromatizedhigh-intensity Cu K a radiation (l =1.5418A˚).The morphologies and sizes of the resulting products were examined by field-emission scanning electron microscopy (FESEM,Hitachi S-4800)and transmission electron microscopy (TEM,JEM2000EX),respec-tively.The thermal behavior of the resulting products was carried out by differential scanning calorimetric analysis (DSC)and thermogravimetric analysis (TG)with a Netzsch-449C simulta-neous TG/DSC apparatus heating from room temperature to 6008C (108C/min)in flowing air.UV/vis absorption spectra were acquired on a spectrophotometer (Shimadzu)and the analyzed range was 200–800nm.3.Results and discussionFig.1presents the typical XRD pattern of the as-synthesized CeCO 3OH products.All of the diffraction peaks in Fig.1can be exactly indexed to the pure hexagonal crystalline phase ofCeCO 3OH with lattice constants a =7.2382A˚,c =9.9596A ˚,which are in good agreements with the literature values (JCPDS 32-0189).No impurity peaks are detected,indicating the high purity of the final product.The strong and sharp diffraction peaks suggest that the products are highly crystallined.Fig.2shows a typical SEM image of the CeCO 3OH dendrite structure synthesized at 1808C for 24h.As shown in Fig.2,it reveals most of the as-prepared CeCO 3OH products display twofold-symmetric structures with a length of 1–2m m along the trunk.The detailed morphology of the structures of CeCO 3OH dendrites is further studied using TEM and SAED (Select-area electron diffraction).A typical high magnification TEM image of the structure of CeCO 3OH dendrites is shown in Fig.3.It reveals that the product is composed of a long central trunk with secondary and tertiary sharp branches,which are parallel to each other and emerge at 608angles with respect to the central trunk.The SAED pattern in the inset of Fig.3taken from an individual dendrite-like nanostructure is indexed to hexagonal CeCO 3OH,indicating that the individual is a single crystal.The diffraction pattern indicates the individual dendrite-like CeCO 3OH is well crystallized.The typical TG pattern of the as-prepared CeCO 3OH dendrite structure is shown in Fig.4a.The TG curve shows that CeCO 3OH begins to decompose at about 2808C and finishes at 6008C.Thetotal weight loss between 2808C and 6008C is measured at about 21.70%,which is close to the results in the theoretical value calculated from following reaction:4CeCO 3OH þO 2!4CeO 2þ2H 2O þ4CO 2(1)The DSC curve (Fig.4b)shows one endothermic peak with a maximum at 300.08C.The temperature range of the endothermic peak in the DSC curve agrees well with the weight loss in the TG curve,corresponding to endothermic behavior during the thermal decomposition/oxidation of CeCO 3OH to CeO 2.Fig.5shows the XRD pattern of CeO 2obtained by calcinations of as-prepared CeCO 3OH.All of the peaks are well assigned to pure face-centered cubic (fcc)structure of CeO 2with lattice constantsa =5.412A˚,which is in good agreement with the JCPDS card (No.43-1002).No obvious peaks for other elements or impurities were observed.The strong and sharp reflection peaks suggest that the as-prepared products are well crystallized.After the CeCO 3OH dendrites are calcined in air at 5008C for 4h,CeO 2dendrites are formed.As shown in Fig.6a,SEM image of CeO 2reveals that the dendrite morphology was partly sustained after thermal decomposition/oxidation to CeO 2.Fig.6b presents a typical TEM image of CeO 2dendrite and its corresponding ED pattern (Fig.6b inset).The discontinuous rings in ED pattern indicate that it could consist of CeO 2polycrystals with an oriented crystallographic axis.In our experiment,since triethylenetetramine was not used,noting products were obtained.Fig.7shows the SEM image of raw material (CeCl 3Á7H 2O),only erose particles were observed,indicating the triethylenetetramine plays an important role in the formation of CeCO 3OH dendrite structures.As is well known,triethylenetetramine at the room tempera-ture will release OH Àin the aqueous solution.Meanwhile,triethylenetetramine has large average capacities for the absorp-tion CO 2[27].So the CO 32Àanions in the solution may result from1020304050602θ (° )(002)(110)(112)(004)(300)(114)(302)(220)(222)(304)Fig.1.XRD patternof the CeCO 3OH dendrite-like nanostructure.Fig.2.SEM image of the as-synthesized CeCO 3OH.Fig.3.TEM image of the as-synthesized CeCO 3OH.K.Gao et al./Chinese Chemical Letters 25(2014)383–386384the possible oxidation of triethylenetetramine,the absorption andslight dissolution of CO 2from air.In the hydrothermal process,the C—N bond in triethylenete-tramine is the easiest bond to break,so upon heating to a certain temperature,triethylenetetramine hydrolyzes to form NH 4+and CO 32À.The cerium ions can exist in the form of [Ce(H 2O)n ]3+in aqueous solution,and then [Ce(H 2O)n ]3+is changed into [Ce(OH)(H 2O)n +]2+,and finally CeCO 3OH is obtained by the reaction between [Ce(OH)(H 2O)n À1]2+and CO 32À.It is proposed that dendrite structures are obtained through a seed-mediated growth in the presence of micelles of triethylenetetramine.The CeCO 3OH nuclei were created and used as seed center,these random moving nuclei in the environment can aggregate with each other to form anisotropic morphology.In our experiment,we consider that triethylenetetramine used as the alkaline and surfactant in the hydrothermal process.Therefore,existing triethylenetetramine,as a capping agent in the reaction system,is absorbed selectively on the different planes of CeCO 3OH seeds,helps to lower the surface energy and results in the different growth rate of different planes to form the dendrite structures.The real formation mechanism of CeCO 3OH dendrite structure needs further investigation.Fig.8shows the UV/vis diffuse absorption spectra of CeCO 3OH and CeO 2.Fig.8a shows the UV/vis absorption spectra for CeCO 3OH.The spectra displayed a strong absorption band below 400nm in the spectra.As seen in Fig.8b and 8c,when the synthesized particles were calcined to produce straw yellow CeO 2by heating at 5008C for 4h,the CeO 2has a stronger absorption band below 480nm in the spectra,which is originated from change-transfer transition between O 2p and Ce 4f bonds [28–30].The optional band gap E g can be determined based on the absorbance spectrum of the powders by the following equation:E g =1240/l AE ,where l AE is the edge wavelength of absorbance.The onset of absorption for CeO 2is at 425.3nm,which corresponds to the band gap energy (E g )of 2.92eV,lower than the values of bulk100200300400500600700800024681012←b. DSC cur veH e a t f l o w (m W /m g )Temerature (oC)← a . TG curve80859095100W e i g h t l o s s(%)Fig.4.TG-DSC pattern of the as-synthesized CeCO 3OH.10203040506070802θ (° )(111)(200)(220)(311)(222)(400)(311)(420)Fig.5.XRD pattern of the CeO 2sample.Fig.6.The typical SEM and TEM images of CeO 2obtained from thermal decomposition/oxidation of CeCO 3OH dendrite structure.Fig.7.SEM image of CeCl 3Á7H 2O powders.800700600500400300200b A b s o r b a n c e (a .u )Wavelength (nm)a800700600500400300200A b s o r b a n c e (a .u )Wavelength (nm)cFig.8.UV/vis absorption spectra of CeCO 3OH (a)and CeO 2(b),(c).K.Gao et al./Chinese Chemical Letters 25(2014)383–386385powders(3.19eV).In general,reduction in crystal size would increase the band gap width because of the quantum size effect [31].Hence,the high absorption in the UV region for CeO2show that the materials can be used as UV-blocking,shielding materials to avoid damage from ultraviolet rays and optical devices.4.ConclusionIn summary,we have successfully synthesized CeCO3OH dendrite structures by a facile hydrothermal method in the presence of triethylenetetramine.After annealing the CeCO3OH precursor powders at5008C for4h,CeO2nano/microstructures with dendrite morphology could be obtained with the morphology partly kept.It is believed that triethylenetetramine plays an important role in the growth of CeCO3OH dendrite structures.The optical absorption spectra indicate that the CeO2nano/microstruc-ture have a direct band gap of2.92eV,which is lower than the values of bulk powders.It is expected that these materials canfind potential application in catalysis and UV-blocking material. AcknowledgmentsThis work was supportedfinancially by the Program for Innovative Research Team in Jiangsu Province(No.SZK[2011]87), Creative and Innovative Talents Introduction Plan(No.SZT[2011]43) and Special Research Foundation of Young teachers of Nanjing University of Technology(No.39701007).References[1]D.Andreeva,I.Ivanov,L.Ilieva,et al.,Nanosized gold catalysts supported on ceriaand ceria–alumina for WGS reaction:influence of the preparation method, Powder Technol.333(2007)153–160.[2]rese,M.L.Granados,F.C.Galisteo,et al.,TWC deactivation by lead:a study ofthe Rh/CeO2system,Appl.Catal.B62(2006)132–143.[3]Y.Dai,B.D.Li,H.D.Quan,et al.,CeCl3Á7H2O as an efficient catalyst for one-potsynthesis of b-amino ketones by three-component Mannich reaction,Chin.Chem.Lett.21(2010)31–34.[4]M.Hajjami,A.G.Choghamarani,M.A.Zolfigol,et al.,An efficient and versatilesynthesis of aromatic nitriles from aldehydes,Chin.Chem.Lett.23(2012) 1323–1326.[5]G.Jacobs,L.Williams,U.Graham,et al.,Low-temperature water–gas shift:in-situDRIFTS reaction study of a Pt/CeO2catalyst for fuel cell reformer applications,J.Phys.Chem.B107(2003)10398–10404.[6]M.S.Tsai,Powder synthesis of nano grade cerium oxide via homogenous precipi-tation and its polishing performance,Mater.Sci.Eng.B110(2004)132–134. [7]D.S.Lim,J.W.Ahn,H.S.Park,et al.,The effect of CeO2abrasive size on dishing andstep height reduction of silicon oxidefilm in STI–CMP,Surf.Coat.Technol.200 (2005)1751–1754.[8]Y.H.Kim,S.K.Kimb,N.Kimb,et al.,Crystalline structure of ceria particlescontrolled by the oxygen partial pressure and STI CMP performances,Ultramicro-scopy108(2008)1292–1296.[9]A.W.Xu,Y.Gao,H.Q.Liu,The preparation,characterization,and their photo-catalytic activities of rare-earth-doped TiO2nanoparticles,J.Catal.207(2002) 151–157.[10]D.C.Koskenmaki,K.A.Gschneidner Jr.,Handbook on the Physics and Chemistry ofRare Earths,vol.1,North-Holland,Amsterdam,1978,pp.338–340.[11]Y.G.Sun,B.Mayers,Y.N.Xia,Template engaged replacement reaction:a one stepapproach to the large scale synthesis of metal nanostructures with hollow interiors,Nano Lett.3(2003)675–679.[12]A.P.Alivisatos,Semiconductor clusters,nanocrystals,and quantum dots,Science271(1996)933–937.[13]K.Li,P.S.Zhao,Synthesis and characterization of CeCO3OH one-dimensionalquadrangular prisms by a simple method,Mater.Lett.63(2009)2013–2015.[14]Z.Y.Guo,F.F.Jian,F.L.Du,Sonochemical synthesis of luminescent CeCO3OH one-dimensional quadrangular prisms,Mater.Res.Bull.207(2011)35–41.[15]Z.Y.Guo, F.L.Du,G.C.Li,et al.,Synthesis and characterization of single-crystal Ce(OH)CO3and CeO2triangular microplates,Inorg.Chem.45(2006) 4167–4169.[16]Z.Y.Guo,F.L.Du,G.C.Li,et al.,Synthesis and Characterization of bundle-likestructures consisting of single crystal Ce(OH)CO3nanorods,Mater.Lett.61(2007) 694–696.[17]M.Y.Cui,J.X.He,N.P.Lu,et al.,Morphology and size control of cerium carbonatehydroxide and ceria micro/nanostructures by hydrothermal technology,Mater.Chem.Phys.121(2010)314–319.[18]Z.Y.Guo,F.L.Du,G.C.Li,et al.,Hydrothermal synthesis of single-crystallineCeCO3OHflower-like nanostructures and their thermal conversion to CeO2, Mater.Chem.Phys.113(2009)53–56.[19]E.L.Qi,L.Y.Man,S.H.Wang,et al.,Microwave homogeneous synthesis andphotocatalytic property of CeO2nanorods,Chin.J.Mater.Res.25(2011)221–224.[20]L.Yan,R.B.Yu,J.Chen,et al.,Template-free hydrothermal synthesis of CeO2nano-octahedrons and nanorods:investigation of the morphology evolution,Cryst.Growth Des.8(2008)1474–1477.[21]X.J.Yang,X.P.Li,X.T.Bai,et al.,Facile synthesis and characterization of uniformCdS colloidal spheres,Chin.Chem.Lett.23(2012)1091–1094.[22]W.T.Yao,S.H.Yu,Recent advances in hydrothermal syntheses of low dimensionalnanoarchitectures,Int.J.Nanotechnol.4(2007)129–162.[23]D.Zhao,J.S.Tan,Q.Q.Ji,et al.,Mn2O3nanomaterials:facile synthesis andelectrochemical properties,Chin.J.Inorg.Chem.26(2010)832–838.[24]Z.H.Han,N.Guo,K.B.Tang,et al.,Hydrothermal crystal growth and characteri-zation of cerium hydroxycarbonates,J.Cryst.Growth219(2000)315–318. [25]C.H.Lu,H.C.Wang,Formation and microstructural variation of cerium carbonatehydroxide prepared by the hydrothermal process,Mater.Sci.Eng.B90(2002) 138–141.[26]K.Li,P.S.Zhao,Synthesis of single-crystalline Ce(CO3)(OH)with novel dendritemorphology and their thermal conversion to CeO2,Mater.Res.Bull.45(2010) 243–246.[27]Z.Wang,M.X.Fang,Y.L.Pan,et al.,Amine-based absorbents selection for CO2membrane vacuum regeneration technology by combined absorption–desorp-tion analysis,Chem.Eng.Sci.93(2013)238–249.[28]Y.W.Zhang,R.Si,C.S.Liao,et al.,Facile alcohothermal synthesis,size-dependentultraviolet absorption,and enhanced CO conversion activity of ceria nanocrystals, J.Phys.Chem.B107(2003)10159–10167.[29]N.Imanaka,T.Masui,H.Hirai,et al.,Amorphous cerium–titanium solid solutionphosphate as a novel family of band gap tunable sunscreen materials,Chem.Mater.15(2003)2289–2291.[30]S.Tsunekawa,T.Fukuda,A.Kasuya,Blue shift in ultraviolet absorption spectra ofmonodisperse CeO2Àx nanoparticles,J.Appl.Phys.87(1999)1318–1321. [31]Y.B.Yin,X.Shao,L.M.Zhao,et al.,Synthesis and characterization of CePO4nanowires via microemulsion method at room temperature,Chin.Chem.Lett.20(2009)857–860.K.Gao et al./Chinese Chemical Letters25(2014)383–386 386。

Manganese Oxides with Rod-,Wire-,Tube-,and Flower-LikeMorphologies:Highly Effective Catalysts for the Removal of TolueneFang Wang,Hongxing Dai,*Jiguang Deng,Guangmei Bai,Kemeng Ji,and Yuxi LiuLaboratory of Catalysis Chemistry and Nanoscience,Department of Chemistry and Chemical Engineering,College of Environmental and Energy Engineering,Beijing University of Technology,Beijing 100124,China*Supporting Informationconcentration and low-temperature reducibility decreased in the wire-like α-MnO 2,in good agreement with the sequence of rod-like α-MnO 2catalyst could effectively catalyze the total 90%=225°C at space velocity =20000mL/(g h)).It is nanorods might be associated with the high oxygen adspecies sure that such one-dimensional well-defined morphological elimination of air pollutants.INTRODUCTIONMost volatile organic compounds (VOCs),such as form-aldehyde,methanol,benzene,and toluene,are harmful to the atmosphere and human health.It is highly desired to control the emissions of VOCs.Up to now,a number of methods (e.g.,adsorption)have been developed for the removal of hazardous materials.1−6Among the strategies for VOCs elimination,catalytic oxidation is believed to be one of the most effective pathways because it can operate at low temperatures and no secondary pollution products are generated.7−11The key issue of such a technology is the availability of high-performance catalysts.Although supported precious metal catalysts show excellent activities for the total oxidation of toluene at low temperatures,12−14the high cost and some involved problems (e.g.,sintering and volatility)prohibit their wide applications.Cheap transition-metal oxides,such as manganese oxides,cobalt oxides,and chromia,are active at high temperatures,7,8,15but they are inferior to precious metals in catalyzing the combustion of toluene at low temperatures.Hence,it is of significance to develop a catalyst that is cheap and effective for the removal of toluene at low temperatures.In the past years,a large number of works have been focused on the controlled preparation of manganese oxides with various morphologies.Up to now,manganese oxides with rod-like,wire-like,tubular,and spherical shapes have been gener-ated.16−19For example,Zhu and co-workers prepared one-dimensional (1D)α-,β-,γ-,and δ-MnO 2nanorods using a hydrothermal method and observed good catalytic activities for CO oxidation.16Gao et al.obtained 1D α-MnO 2nanowires by hydrothermally treating the mixture of KMnO 4and NH 4Cl at 140°C for 24h.17Zheng et al.generated single-crystalline 1D β-MnO 2nanotubes (diameter 200−500nm and length several micrometers)via a poly(vinyl pyrrolidone)-assisted hydro-thermal route with MnSO 4with NaClO 3as precursor.18Without the use of a template but with CCl 4and water as medium,Yuan et al.synthesized flower-like α-and γ-MnO 2(surface area 239m 2/g),which showed a good electrochemical capacitive behavior.19It was reported that manganese oxides were catalytically active for the complete oxidation of VOCs,such as propane,n -hexane,benzene,and toluene.20−23For instance,Finocchio and Busca investigated the surface and redox properties of Mn 3O 4,Mn 2O 3,and MnO 2,and claimed that the bulk oxygen diffusion rate had an effect on the catalytic oxidation rate in the oxidation of propane.20Delmon and co-workers observed that the γ-MnO 2catalyst outperformed the 0.3wt %Pt/TiO 2catalyst in the oxidation of n -hexane.23After studying the oxidation of benzene over manganese oxideReceived:November 11,2011Revised:January 20,2012Accepted:March 11,2012octahedral molecular sieve(OMS-2)catalyst,Luo et al. believed that the excellent activity and stability of OMS-2at low temperatures were due to the hydrophobic property and the facile evolution of lattice oxygen.21Aguero et al.observed good catalytic performance over Al2O3-supproted MnO x catalyst for the combustion of ethanol and toluene,which was attributed to the high capacity for adsorbing oxygen,the existence of surface defects,and the good reducibility of the catalyst.22It has been generally accepted that catalytic activity is related to the surface area,defective structure,reducibility,and morphology of a catalyst.The particle morphology has an important impact on catalytic oxidation performance of transition metal oxides(e.g.,Co3O4).24However,up to now, rarely has work been done on the comparative investigation of manganese oxides with various well-defined morphologies. Previously,our group prepared a series of three-dimension-ally(3D)ordered or wormhole-like mesoporous transition-metal oxides(e.g.,chromia,25,26iron oxide,27manganese oxide,28and cobalt oxide28,29)by using the3D ordered mesoporous silica KIT-6-or SBA-16-nanocasting method,and investigated their physicochemical properties.We found that these3D mesoporous transition-metal oxides performed well in catalyzing the combustion of formaldehyde,acetone,methanol, and toluene.Recently,we adopted the hydrothermal method to generate a number of transition-metal oxides with well-defined morphologies.In this paper,we report the controlled preparation and catalytic properties of rod-like,wire-like,and tubular MnO2as well as flower-like Mn2O3for the combustionof toluene.■EXPERIMENTAL SECTIONCatalyst Preparation.The manganese oxide catalysts were prepared according to the hydrothermal16,30or solution method.19The detailed procedures are described in the Supporting Information.The as-prepared samples are referred to as rod-like MnO2,wire-like MnO2,tube-like MnO2,and flower-like Mn2O3.Catalyst Characterization.All of the as-prepared samples were characterized by techniques such as X-ray diffraction (XRD),N2adsorption−desorption(BET),scanning electron microscopy(SEM),transmission electron microscopy(TEM), selected-area electron diffraction(SAED),X-ray photoelectron spectroscopy(XPS),and H2temperature-programmed reduc-tion(H2-TPR).The detailed methods are stated in the Supporting Information.Catalytic Evaluation.Catalytic activity of the samples was evaluated in a continuous-flow fixed-bed quartz microreactor(i.d.4mm).To minimize the effect of hot spots,the catalyst(0.1g,40−60mesh)was diluted with0.3g of quartz sands (40−60mesh).The reactant feed(flow rate33.3mL/min)was 1000ppm toluene+O2+N2(balance),with the toluene/O2 molar ratio and space velocity(SV)being1/400and20000 mL/(g h),respectively.For the change of SV,we altered the total flow rate of the reactant feed by the mass flow controller (D0719CM,Beijing Sevenstar Electronics Co.).The outlet gases were analyzed online by a gas chromatograph(Shimadzu GC-2010)equipped with a flame ionization detector(FID)and a thermal conductivity detector(TCD),using a1/8-in. Chromosorb101column(3m long)for toluene separation and a1/8-in.Carboxen1000column(3m long)for permanent gas separation.The outlet gases were also monitored online by a mass spectrometer(HPR20,Hiden).We found that no other products were detected in addition to CO2and H2O.On the basis of the toluene consumption and CO2production,the carbon balance and the conversion of toluene were calculated. The relative errors for the gas concentration measurements were less than±1.5%.The balance of carbon throughout theinvestigation was estimated to be ca.99.5%.■RESULTS AND DISCUSSIONCrystal Phase Composition.Figure1shows the XRD patterns of the as-prepared manganese oxide samples.Bycomparing to the XRD patterns of the standardα-MnO2 (JCPDS PDF72-1982),Mn2O3(JCPDS PDF41-1442),and Mn3O4(JCPDS PDF24-0734)samples,one can realize that the hydrothermally derived rod-and tube-like manganese oxide samples were single-phaseα-MnO2and of tetragonal crystal structure;in addition to the main phase of tetragonalα-MnO2, there was a trace amount of tetragonal Mn3O4phase in the wire-like manganese oxide sample.In the CCl4-solution derived flower-like manganese oxide sample,however,there were a cubic Mn2O3phase in majority and a tetragonalα-MnO2phase in minority.All of the diffraction peaks could be well indexed, as indicated in Figure1c and d.From Figure1,one can also observe no significant difference in XRD signal intensity of the four samples,indicating that they possessed similar crystallinity, a result due to the same subsequent thermal treatments.The XRD results demonstrate that the preparation conditions had an important influence on crystal structure of the manganese oxide sample.Morphology,Surface Area,Surface Element Compo-sition,and Oxygen Species.Figure2shows the SEM images of the as-prepared manganese oxide samples.It is observed that the manganese oxide particles derived hydrothermally at140°C for12h(Figure2a and b),240°C for24h(Figure2c and d),and120°C for12h(Figure2e and f)were,respectively, rod-,wire-,and tube-like in morphology,whereas those obtained with CCl4solution displayed a flower-like spherical shape with sharp edges.It should be noted that the wire-like morphology can be differentiated from the rod-like morphology in terms of the bending or straight shape.The diameter and length of the rods in the rod-likeα-MnO2sample were ca.43 nm and2−4μm,those of the wires in the wire-likeα-MnO2 sample were ca.40nm and1−10μm,and those of the tubesin Figure1.Wide-angle XRD patterns of(a)rod-like MnO2,(b)wire-like MnO2,(c)tube-like MnO2,and(d)flower-like Mn2O3.Δ: Impurity Mn3O4phase;○:impurity MnO2phase.the tubular α-MnO 2sample were ca.65nm and 1−3μm,respectively.For the Mn 2O 3sample,the size of the flower-like spheres was in the range of 800−1000nm.Shown in Figure 3are the TEM and high-resolution TEM images as well as the SAED patterns of the manganese oxide samples.Well-grown nanorods (Figure 3a),nanowires (Figure 3c),and nanotubes (Figure 3e)of α-MnO 2could be clearly observed.The TEM images (Figure 3g and h)were recorded on the edge of a broken flower-like Mn 2O 3nanoentity.From the high-resolution TEM images (Figure 3b,d,and f),one cansee well-resolved lattice fringes.The lattice spacings (d values)of the (121)crystal plane of the rod-,wire-,and tube-like α-MnO 2samples were ca.0.239,0.238,and 0.239nm,respectively,rather close to that (0.2388nm)of the standard α-MnO 2sample (JCPDS PDF 72-1982).The d value (0.271nm)of the (222)crystal plane of the flower-like spherical Mn 2O 3sample estimated from the high-resolution TEM image (Figure 3h)was also not far away from that (0.2716nm)of the referenced Mn 2O 3sample (JCPDS PDF 41-1442).Further-more,the recording of linearly aligned brightelectronFigure 2.SEM images of (a,b)rod-like MnO 2,(c,d)wire-like MnO 2,(e,f)tube-like MnO 2,and (g,h)flower-like Mn 2O 3.Figure 3.TEM and high-resolution TEM images as well as SAED patterns (insets)of (a,b)rod-like MnO 2,(c,d)wire-like MnO 2,(e,f)tube-like MnO 2,and (g,h)flower-like Mn 2O 3.diffraction spots in the SAED patterns (insets of Figure 3b,d,and f)means that the tetragonal α-MnO 2samples with rod-like,wire-like,and tubular morphologies were single crystalline.For the flower-like spherical Mn 2O 3sample,however,the SAED pattern (inset of Figure 3h)showed multiple bright electron diffraction rings,suggesting that this cubic Mn 2O 3sample was mainly polycrystalline.As can be seen from Table 1,the BET surface areas (ca.83m 2/g)of the rod-and wire-like α-MnO 2samples were similar,and much higher than that (ca.45m 2/g)of the tubular α-MnO 2sample.However,the flower-like spherical Mn 2O 3sample possessed a surface area of ca.162m 2/g,significantly higher than those of the hydrothermally derived α-MnO 2samples.The difference in preparation method led to a big difference in surface area of the MnO x catalysts with similar crystallinity,similar phenomena also took place in the preparation of α-Fe 2O 3samples.31,32XPS is a good tool to investigate the surface element composition,element oxidation state,and adsorbed species of a material.Figure 4illustrates the Mn 2p 3/2and O 1s XPS spectra of the manganese oxide samples.As shown in Figure 4A,there was one asymmetrical signal at BE =ca.642eV for the three α-MnO 2samples and at BE =ca.641eV for the Mn 2O 3sample,in which the former could be decomposed to two components at BE =641.6and 642.8eV,whereas the latter could be decomposed to three components at BE =640.6,641.6,and 642.8eV.The components at BE =640.6,641.6,and 642.8eV were attributable to the surface Mn 2+,Mn 3+,and Mn 4+species,7,33respectively.A quantitative analysis on the Mn 2p 3/2XPS spectra of the samples gives rise to the surface Mn 3+/Mn 4+as well as Mn 2+/Mn 3+molar ratios,as summarized in Table 1.Apparently,the preparation method had an important impact on the surface Mn 3+/Mn 4+or Mn 2+/Mn 3+molar ratio ofthe product.Among the hydrothermally prepared manganese oxide samples,the rod-like α-MnO 2sample showed the highest surface Mn 3+/Mn 4+molar ratio (0.58),whereas the lowest surface Mn 3+/Mn 4+molar ratio (0.31)was achieved on the wire-like α-MnO 2sample.It is noted that there was also the copresence of Mn 2+,Mn 3+,and Mn 4+on the surface of the flower-like Mn 2O 3sample due to the formation of tetragonal Mn 2O 3and α-MnO 2phases,with the surface Mn 3+/Mn 4+and Mn 2+/Mn 3+molar ratios being 4.17and 0.38,respectively.Based on the principle of electroneutrality,we deduce that the surface oxygen vacancy density was the highest on the rod-like α-MnO 2surface,while the lowest was on the wire-like α-MnO ually,oxygen molecules are adsorbed at the oxygen vacancies of an oxide material.Therefore,we believe that the oxygen adspecies locate at the surface oxygen vacancies of α-MnO 2or Mn 2O 3.This result is in good agreement with the result of O 1s XPS investigations.The formation of surface oxygen vacancies on the α-MnO 2or Mn 2O 3sample was beneficial for the oxidation of VOCs,which provides a good interpretation for the higher catalytic activity of rod-like α-MnO 2at low temperatures (shown in Section 3.4).As can be seen from Figure 4B,the asymmetrical O 1s signal could be deconvoluted to two components:one at BE =529.0eV and the other at BE =531.7eV;the former was assigned to the surface lattice oxygen (O latt )species,whereas the latter was assigned to the surface adsorbed oxygen (O ads )species.25−27,29It is found from Table 1that the estimated surface O ads /O latt molar ratios of the samples were dependent upon the preparation method.The surface O ads /O latt molar ratio decreased in the order of rod-like α-MnO 2(1.50)>tube-like α-MnO 2(1.15)>flower-like Mn 2O 3(0.92)>wire-like α-MnO 2(0.78).The formation of oxygen adspecies was due toTable 1.Preparation Conditions,BET Surface Areas,and Surface Element Compositions of the Manganese Oxide SamplesaThe datum in parentheses is the surface Mn 2+/Mn 3+molar ratio.Figure 4.(A)Mn 2p 3/2and (B)O 1s XPS spectra of (a)rod-like MnO 2,(b)wire-like MnO 2,(c)tube-like MnO 2,and (d)flower-like Mn 2O 3.the presence of surface oxygen vacancies on α-MnO 2or Mn 2O 3,which implies that there might be the coexistence of Mn 3+and Mn 4+ions in/on the α-MnO 2samples or Mn 2+and Mn 3+ions on/in the Mn 2O 3sample.27,29Such a deduction was supported by the Mn 2p 3/2XPS results of these samples.Reducibility.Figure 5A illustrates the H 2-TPR profiles of the as-prepared manganese oxide samples.For the rod-like α-MnO 2sample,there was a main reduction band at 265°C with a shoulder at 285°C,the total H 2consumption was 11.28mmol/g (Table 2).However,only one strong reduction band centered at 275°C for the wire-like α-MnO 2sample and at 268°C for the tube-like α-MnO 2sample was recorded,with the total H 2consumption being 10.00and 10.95mmol/g (Table 2),respectively.In the case of the flower-like spherical Mn 2O 3sample,there were two weaker reduction bands at 260and 332°C,corresponding to a total H 2consumption of 5.93mmol/g (Table 2).According to the results reported previously,28,34the reduction process could be reasonably divided into two steps:(i)Mn 4+→Mn 3+and (ii)Mn 3+→Mn 2+.Theoretically,the H 2consumptions for the reduction of MnO 2to Mn 3O 4and of Mn 3O 4to MnO are 7.67and 3.83mmol/g,respectively;while a H 2consumption of 6.30mmol/g is needed if the Mn 2O 3is completely reduced to MnO.In the present studies,the totalH 2consumptions (10.00−11.28mmol/g)of the hydro-thermally derived α-MnO 2samples and that (5.93mmol/g)of the flower-like Mn 2O 3sample were quite close to their theoretical H 2consumptions (11.50and 6.30mmol/g,respectively).This result indicates that a substantial fraction of Mn 4+in α-MnO 2or Mn 3+and Mn 4+in Mn 2O 3had been reduced to Mn 2+below 400°C.To better compare the low-temperature reducibility of these samples,we calculated the initial H 2consumption rate of the first reduction band of each sample before the occurrence of phase transformation (where the initial H 2consumption of the first reduction band of the catalyst is less than 25%25−27,35,36),and the results are shown in Figure 5B.Obviously,the initial H 2consumption rate decreased in the sequence of rod-like α-MnO 2>tube-like α-MnO 2>flower-like Mn 2O 3>wire-like α-MnO 2.That is to say,the low-temperature reducibility of these manganese oxide samples followed the above order.Catalytic Performance.In the blank experiment (only quartz sands were loaded),no conversion of toluene was detected below 400°C,indicating that under the adopted reaction conditions there was no occurrence of homogeneous reactions.Figure 6shows the catalytic performance of the bulk α-MnO 2sample (surface area =ca.10m 2/g,Beijing Chemical Reagent Company,A.R.,99.9%)and the as-prepared α-MnO 2and Mn 2O 3samples for the combustion of toluene.Under the conditions of toluene concentration =1000ppm,toluene/O 2molar ratio =1/400,and SV =20000mL/(g h),toluene conversion increased with the rise in reaction temperature,and the α-MnO 2and Mn 2O 3catalysts with various morphologies performed much better than the bulk α-MnO 2catalyst.It is worth pointing out that toluene was completely oxidized to CO 2and H 2O over the as-prepared α-MnO 2and Mn 2O 3catalysts,and there was no detection of products of incomplete oxidation,as confirmed by the good carbon balance of ca.99.5%in each run.It is convenient to compare the catalytic activities of these samples by using the reaction temperatures T 10%,T 50%,and T 90%(corresponding to the toluene conversion =10,50,and 90%),as summarized in Table 2.It is clearly seen that rod-like α-MnO 2was inferior to wire-and tube-like α-MnO 2and flower-like Mn 2O 3in catalytic performance atlowerFigure 5.(A)H 2-TPR profiles and (B)initial H 2consumption rates of (a)rod-like MnO 2,(b)wire-like MnO 2,(c)tube-like MnO 2,and (d)flower-like Mn 2O 3.Table 2.Reduction Temperatures,H 2Consumptions,and Catalytic Activities of the Manganese Oxide Samples2rod-like MnO 226528511.28176210225wire-like MnO 227510.00143225245tube-like MnO 226810.95157222233flower-like Mn 2O 3260332 5.93145226238temperatures (<180°C),but the former catalyst (T 50%=210°C and T 90%=225°C)outperformed the latter three catalysts (T 50%=222−226°C and T 90%=233−245°C)at higher temperatures.Such a phenomenon might be mainly associated with the nature and distribution of the surface adsorbed oxygen (O −,O 2−,and O 22−)species on the catalysts.As we know,the oxygen adspecies can be converted from O 2−(the lowest reactivity)to O −(the highest reactivity)at elevated temper-atures.37−39Although the total amount of the surface adsorbed oxygen species on the rod-like MnO 2sample was higher than those on the wire-and tube-like MnO 2or flower-like Mn 2O 3catalyst,the O −species concentration (which is governed by the defective structure)on the rod-like MnO 2catalyst might be lower than those on the other three catalysts at lower temperatures.Hence,the rod-like MnO 2catalyst showed lower activity at low temperatures.With a rise in reactiontemperature,a larger amount of O −species might be available through the conversion of O 2−and O 22−to O −species on the rod-like MnO 2catalyst,37,39giving rise to a great enhancement in catalytic activity.The T 50%and T 90%values for the rod-like α-MnO 2catalyst were 82and 97°C lower than those for the bulk α-MnO 2catalyst,respectively.Therefore,it is concluded that in terms of T 50%and T 90%values,the catalytic performance decreased in the order of rod-like α-MnO 2>tube-like α-MnO 2>flower-like Mn 2O 3>wire-like α-MnO 2,coinciding with the sequences of oxygen adspecies concentration obtained in the XPS studies and of low-temperature reducibility revealed by the H 2-TPR investigations.25−27,29Figure 7A and B shows the effects of SV and toluene/O 2molar ratio on the catalytic activity of the rod-like α-MnO 2sample,respectively.It is observed that the catalytic activity of rod-like α-MnO 2decreased with the rise in SV value (Figure 7A)or toluene/O 2molar ratio (Figure 7B).Obviously,the rise in O 2concentration of the reactant feed favored the enhancement of toluene conversion,suggesting that the oxygen adspecies might play an important role in the total oxidation of toluene.That is to say,the oxygen nonstoichiometry relevant to structural defects might be a critical factor in determining the catalytic activity of manganese oxide.25−30To examine the catalytic stability of the rod-like α-MnO 2sample,we carried out the on-stream reaction experiment at 225°C and the result is shown in Figure S1of the Supporting Information.It is found that there was no significant decline in catalytic activity within 60h of on-stream reaction.Hence,we believe that the rod-like α-MnO 2sample was catalytically durable.In the past years,a number of materials have been used as catalysts for the oxidative removal of toluene.It was reported that under similar conditions for the combustion of toluene,the T 50%and T 90%values were 245−340and 265−375°C over the commercial Mn 3O 4,Mn 2O 3,or MnO 2catalyst at SV =15000mL/(g h),15140−200and 234−240°C over the mesoporous CrO x or MnO 2catalyst at SV =20000h −1,26,28254−279and 295−306°C over the LaMnO 3or LaCoO 3catalyst at SV =178h −1,40,41270and 300°C over the 5wt %Au/CeO 2catalyst at SV =186h −1,42and 180and 250°C over the 0.5wt %Pd/Figure 6.Toluene conversion as a function of reaction temperature over the catalysts under the conditions of toluene concentration =1000ppm,toluene/O 2molar ratio =1/400,and SV =20000mL/(g h).Figure 7.Toluene conversion versus reaction temperature over the rod-like MnO 2catalyst under the conditions of (A)toluene concentration =1000ppm,toluene/O 2molar ratio =1/400,and different SV values;and (B)toluene concentration =1000ppm,SV =20000mL/(g h),and various toluene/O 2molar ratios.LaMnO 3catalyst at SV =18000mL/(g h).43Apparently,the rod-like α-MnO 2catalyst (T 50%=210°C and T 90%=225°C at SV =20000mL/(g h))outperformed the above-mentioned commercial Mn 3O 4,Mn 2O 3,and MnO 2,mesoporous CrO x and MnO 2,LaMnO 3,LaCoO 3,5wt %Au/CeO 2,and 0.5wt %Pd/LaMnO 3catalysts for the combustion of toluene.15,26,28,40−43It is well-known that the catalytic activity of a transition metal oxide is associated with several factors,such as defect nature and density,oxygen adspecies concentration,reducibility,surface area,and morphology.For the combustion of organics,the catalyst with a higher surface area would show a better catalytic activity.15,44The surface area of the flower-like spherical Mn 2O 3sample was much higher than that of the rod-and tube-like α-MnO 2samples,but its catalytic perform-ance was inferior to the rod-and tube-like α-MnO 2samples;furthermore,the wire-like α-MnO 2sample possessed a much higher surface area than the tube-like counterpart,but the catalytic activity of the wire-like α-MnO 2sample was also poorer than that of the tube-like α-MnO 2sample.This result indicates that surface area was a minor factor influencing the catalytic performance.Although the morphology might exert an influence on the reducibility of a catalyst,45the relation between the morphology and the oxygen vacancy density is not clear.The morphology and oxygen density as well as reducibility of the as-obtained catalysts might be dependent mainly on the preparation approach in the present ually,a higher structural defect (e.g.,oxygen vacancy)density,which is beneficial for the activation of oxygen molecules to active oxygen adspecies,and a stronger reducibility render the catalyst to show better catalytic performance.22As revealed by the XPS and H 2-TPR investigations,the oxygen adspecies concentration relevant to the surface oxygen vacancy density and low-temperature reducibility were correlative with the catalytic activity of these manganese oxide samples.25−27,29Therefore,we conclude that the excellent catalytic performance of the rod-like α-MnO 2sample for toluene combustion was mainly related to the high oxygen adspecies concentration and good low-temperature reducibility.■ASSOCIATED CONTENT*Supporting Information Details of catalyst preparation procedures and characterization,and one additional figure.This material is available free of charge via the Internet at .■AUTHOR INFORMATIONCorresponding Author*Phone:+86-10-6739-6118;fax:+86-10-6739-1983;e-mail:hxdai@).NotesThe authors declare no competing financial interest.■ACKNOWLEDGMENTSFinancial support by the NSF of Beijing Municipality (grant 2102008),the NSF of China (grants 20973017and 21077007),the National High-Tech Research and Development (863)Program of China (grant 2009AA063201),the Creative Research Foundation of Beijing University Technology (grants 00500054R4003and 005000543111501),and the Funding Project for Academic Human Resources Development in Institutions of Higher Learning under the Jurisdiction ofBeijing Municipality (grants PHR201007105and PHR201107104)is gratefully acknowledged.We also thank Prof.Chak Tong Au (Department of Chemistry,Hong Kong Baptist University)and Mrs.Jianping He (State Key Laboratory of Advanced Metals and Materials,University of Science &Technology Beijing)for doing the XPS and SEM analyses,respectively.■REFERENCES(1)Gupta,V.K.;Carrott,P.J.M.;Ribeiro Carrott,M.M.;Suhas,L.Low-cost adsorbents:Growing approach to wastewater treatment −a review.Crit.Rev.Environ.Sci.Technol.2009,39,783−842.(2)Ali,I.;Gupta,V.K.Advances in water treatment by adsorption technology.Nat.Protoc.2007,1,2661−2667.(3)Gupta,V.K.;Ali,I.Removal of endosulfan and methoxychlor from water on carbon slurry.Environ.Sci.Technol.2008,42,766−770.(4)Gupta,V.K.;Rastogi,A.;Dwivedi,M.K.;Mohan,D.Process development for the removal of zinc and cadmium from wastewater using slag −A blast furnace waste material.Sep.Sci.Technol.1997,32,2883−2912.(5)Gupta,V.K.;Rastogi,A.Biosorption of lead(II)from aqueous solutions by non-living algal biomass Oedogonium sp.and Nostoc sp.−A comparative study.Colloids Surf.,B 2008,64,170−178.(6)Gupta,V.K.;Rastogi,A.Sorption and desorption studies of chromium(VI)from nonviable cyanobacterium Nostoc muscorum biomass.J.Hazard.Mater.2008,154,347−354.(7)Tseng,T.K.;Chu,H.;Hsu,H.H.Characterization of γ-alumina-supported manganese oxide as an incineration catalyst for trichloro-ethylene.Environ.Sci.Technol.2003,37,171−176.(8)Rotter,H.;Landau,M.V.;Herskowitz,bustion of chlorinated VOC on nanostructured chromia aerogel as catalyst and catalyst support.Environ.Sci.Technol.2005,39,6845−6850.(9)Parida,K.M.;Sahu,N.;Tripathi,A.K.;Kamble,V.S.Gold promoted S,N-doped TiO 2:An efficient catalyst for CO adsorption and oxidation.Environ.Sci.Technol.2010,44,4155−4160.(10)Wang,R.H.;Li,J.H.Effects of precursor and sulfation on OMS-2catalyst for oxidation of ethanol and acetaldehyde at low temperatures.Environ.Sci.Technol.2010,44,4282−4287.(11)Kim,S. C.;Shim,W.G.Influence of physicochemical treatments on iron-based spent catalyst for catalytic oxidation of toluene.J.Hazard.Mater.2008,154,310−316.(12)Masui,T.;Imadzu,H.;Matsuyama,N.;Imanaka,N.Total oxidation of toluene on Pt/CeO 2−ZrO 2−Bi 2O 3/γ-Al 2O 3catalysts prepared in the presence of polyvinyl pyrrolidone.J.Hazard.Mater.2010,176,1106−1109.(13)Santos,V.P.;Carabineiro,S.A.C.;Tavares,P.B.;Pereira,M.F.R.;O rfa o ,J.J.M.;Figueiredo,J.L.Oxidation of CO,ethanol and toluene over TiO 2supported noble metal catalysts.Appl.Catal.,B 2010,99,198−205.(14)Shim,W.G.;Lee,J.W.;Kim,S.C.Analysis of catalytic oxidation of aromatic hydrocarbons over supported palladium catalyst with different pretreatments based on heterogeneous adsorption properties.Appl.Catal.,B 2008,84,133−141.(15)Kim,S.C.;Shim,W.G.Catalytic combustion of VOCs over a series of manganese oxide catalysts.Appl.Catal.,B 2010,98,180−185.(16)Liang,S.H.;Teng,F.;Bulgan,G.;Zong,R.L.;Zhu,Y.F.Effect of phase structure of MnO 2nanorod catalyst on the activity for CO oxidation.J.Phys.Chem.C 2008,112,5307−5315.(17)Gao,Y.Q.;Wang,Z.H.;Wan,J.X.;Zou,G.F.;Qian,Y.T.A facile route to synthesize uniform single-crystalline α-MnO 2nano-wires.J.Cryst.Growth 2005,279,415−419.(18)Zheng,D.S.;Sun,S.X.;Fan,W.L.;Yu,H.Y.;Fan,C.H.;Cao,G.X.;Yin,Z.L.;Song,X.Y.One-step preparation of single-crystalline β-MnO 2nanotubes.J.Phys.Chem.B 2005,109,16439−16443.(19)Yuan,C.Z.;Gao,B.;Su,L.H.;Zhang,X.G.Interface synthesis of mesoporous MnO 2and its electrochemical capacitive behaviors.J.Colloid Interface Sci.2008,322,545−550.。
Hydrothermal Synthesis of Barium Titanate:Effect of Titania Precursor and Calcination Temperature on Phase TransitionNatarajan Sasirekha,Baskaran Rajesh,and Yu-Wen Chen*Department of Chemical Engineering,Nanocatalysis Research Center,National Central Uni V ersity,Chung-Li320,Taiwan,Republic of ChinaNanosized barium titanate powders were synthesized by a hydrothermal method.The effect of titania precursorson the phase transition of BaTiO3with respect to Ba/Ti ratio,reaction temperature,reaction time,and calcinationtemperature was investigated.The synthesized materials were characterized by X-ray diffraction,scanningelectron microscopy,and transmission electron microscopy.BaTiO3in pure cubic phase with sphericalmorphology was observed with a lower calcination temperature,Ba/Ti ratio,reaction temperature,and time.Increase in the tetragonal phase was ascertained in treatments at higher reaction temperature with a longerreaction time.The lattice hydroxyl release is believed to be the reason for tetragonality at high reaction andcalcination temperatures.To prepare tetragonal BaTiO3using HClO4-TiO2,the optimum synthesis conditionsviz.,Ba/Ti ratio,reaction temperature,and reaction time,are1.2,160°C,and3h,respectively,at a calcinationtemperature of1150°C.The reaction time and reaction temperature for the cubic-tetragonal phasetransformation of BaTiO3shifted toward shorter reaction time and lower reaction temperature when TiO2was synthesized by hydrolysis using HClO4as the acid catalyst.1.IntroductionBarium titanate(BaTiO3),one of the most well-known ferroelectrics,has played an important part in the modern ceramic industry since the discovery of ferroelectric properties in the tetragonal phase of BaTiO3during the1940s.1It has been broadly used as a dielectric material in multilayer ceramic capacitors(MLCCs),2-4printed circuit boards(PCBs),5,6dy-namic random access memory(DRAM),positive temperature coefficient of resistance thermistors(PTCRs),piezoelectric sensors for ultrasonic and measuring devices,pressure transduc-ers,infrared detectors,and electrooptic devices7-9due to its unique perovskite structure(ABO3)and exceptionally high dielectric[(2-5)×103]10and piezoelectric properties at room temperature.However,these outstanding behaviors mainly depend on the crystal structure,shape,size,stoichiometry, homogeneity,and surface properties of BaTiO3,which in turn depends on the synthesis method.Among the crystal structures of BaTiO3,the cubic phase exhibits paraelectric properties,while the tetragonal phase shows ferroelectric properties.The direct generation of tetragonal BaTiO3is of considerable interest. The conventional synthesis of barium titanate compounds typically involves high-temperature(∼1200°C)calcinations of a BaCO3and TiO2powder mixture,which often results in low purity and polydispersity due to high reaction temperature and heterogeneous solid-phase reaction.11,12Nevertheless,fine Ba-TiO3ceramics can be prepared by wet-chemistry synthesis techniques,including the coprecipitation method,13coprecipi-tation in combination with the inverse microemulsion method,14,15 sol-gel processing,16,17the hydrothermal method,18-21spray pyrolysis,22the oxalate route,23the high-temperature ceramic route,the microwave hydrothermal method,24-27and the polymeric precursor method.28Hydrothermal synthesis for the preparation of crystalline BaTiO3has gained popularity recently.29-33It involves the chemical reactions of Ba(OH)2,TiO2,or gels of Ba-Ti acetate mixtures at a high temperature.It has the advantage of producing finer particles with more uniform size.In addition,the interac-tion between the solid and fluid phases determines the physical characteristics of BaTiO3,and hence,the synthesis allows one to control the particle size by adjusting the synthesis parameters, such as the reaction temperature,time,and pH values.The synergistic effect of solvent,temperature,and pressure on the ionic reaction equilibrium in the hydrothermal reaction medium can stabilize the formation of BaTiO3and retards the formation of impurities.Also,the precursors for the preparation of BaTiO3 by hydrothermal synthesis are readily available,inexpensive, and easy to handle,which makes the hydrothermal synthesis an easy and effective method to adopt for the synthesis of BaTiO3.Although the hydrothermal synthesis has the above-mentioned advantages,the formation and growth mechanisms in BaTiO3synthesis have not been well understood.There are a few articles about the study of phase transformation of BaTiO3 with preparation conditions.However,so far there is no report about the effect of titania precursor,which plays a vital role in the growth mechanism of BaTiO3synthesis,on the phase transformation of BaTiO3.In this paper,a systematic investiga-tion on the effect of titania precursor on phase transformation of BaTiO3with respect to Ba/Ti ratio,reaction temperature, reaction time,and calcination temperature is presented.2.Experimental Section2.1.Hydrothermal Synthesis of BaTiO3.Barium titanate powders were synthesized by hydrothermal method.All the reagents used were of analytical grade.Hydrothermally produced TiO2particles34prepared using hydrochloric acid and perchloric acid as acid precursors were used as the titania source.The detailed characteristics of these materials have been presented in our previous paper.34Ba(OH)2‚8H2O(Showa Chemical Co., Ltd.)and TiO2powder(rutile)34were mixed with a Ba/Ti ratio (1.2,1.4,1.6,1.8,2.0)in a50mL autoclave with45mL of deionized water.The autoclave was sealed,shaken,and placed in an oven at160°C for a variable reaction period ranging from*To whom correspondence should be addressed.Tel.:(886)3422751,ext34203.Fax:(886)34252296.E-mail:ywchen@cc.ncu.edu.tw.1868Ind.Eng.Chem.Res.2008,47,1868-187510.1021/ie070986m CCC:$40.75©2008American Chemical SocietyPublished on Web02/16/20083to 24h.After cooling naturally to room temperature,the contents of the autoclave were diluted in 90mL of 0.1M formic acid with stirring for 5min in an attempt to remove any BaCO 3formed and the addition of excess Ba 2+to the starting solution.The mixture was filtered and washed with distilled water (500mL)three times,and the residue was dried in oven at 100°C for 24h.2.2.Characterization.The crystalline phase of BaTiO 3was analyzed by powder X-ray diffraction (XRD)using a Siemens D500automatic powder diffractometer.Nickel-filtered Cu K R radiation (λ)0.15418nm)was used with a generator voltage of 40kV and a current of 29mA.Bragg -Brentano focusing geometry was employed with an automatic divergence slit (irradiated sample length was 12.5nm),a receiving slit of 0.1nm,a fixed slit of 4°,and a proportional counter as a detector.It was operated in the step scan mode,at scanning speeds of 0.1°2θ/s and 1s step time in the range 20-80°for barium titanate.Scherrer’s equation 35was used to calculate the crys-tallite size of barium titanate crystals from the full width at half-maximum of the XRD peak.The morphology of the particles was analyzed by scanning electron microscopy (SEM)and transmission electron micros-copy (TEM).SEM images were acquired with a Hitachi S-800field emission microscope using an acceleration voltage of 20kV.The samples were coated with Au prior to analysis and imaged directly.TEM images were obtained on a JEOL JEM-2000FX Πmicroscope using an electron beam generated by a tungsten filament and an accelerating voltage of 160kV,a beam diameter of approximately 1-2µm,and an objective lens aperture of 20µm.The sample grids were prepared via sonication of powdered sample in ethanol for 10min and evaporating 1drop of the suspension onto a carbon-coated,porous film supported on a 3mm,200-300mesh copper grid.TEM images were recorded at a magnification of 100000-400000×.The magnification was calibrated in pixels per nanometer on the camera.3.Results and Discussion3.1.Effect of Ba/Ti Ratio.BaTiO 3powder,prepared with Ba/Ti ratio in the range of 1.2-2.0,was characterized by XRD,SEM,and TEM techniques to study the cubic -tetragonal phase transformations and surface modifications of BaTiO 3.The ratio of Ba/Ti was chosen to be greater than 1to avoid contamination of BaTiO 3(s)with excess TiO 2(s)under the conditions of hydrothermal synthesis.24Furthermore,Ba/Ti >1increases the pH of the solution,which is an important thermodynamicvariable for the synthesis of perovskite materials,and helps to avoid the addition of an alkaline mineralizer to facilitate the formation of BaTiO 3.According to the thermodynamic calcula-tions of stability diagrams for the hydrothermal Ba -Ti system,high pH and Ba/Ti >1are necessary for the synthesis of high-purity BaTiO 3crystals.28XRD patterns of the as-synthesized BaTiO 3,with Ba/Ti ratios of 1.2,1.4,1.6,1.8,and 2.0,showed the characteristic peaks of both cubic BaTiO 3(JCPDS File No.79-2263)and those of BaCO 3for both TiO 2precursors.Modest BaCO 3contamination was noted in almost all the samples due to the introduction of airborne CO 2,which would dissolve as CO 32-and reacts with Ba 2+to form BaCO 3during the posttreatment.26,36The formation of BaCO 3,observed in this work,is quite common in the hydrothermal processing as BaCO 3can precipitate at lower pH values than those needed to precipitate BaTiO 3.24AccordingtoFigure 1.XRD patterns of BaTiO 3synthesized at various Ba/Ti ratios using (a)HCl-TiO 2and (b)HClO 4-TiO 2precursors and washed with formic acid followed by calcination at 900°C (2h).Table 1.Effect of Ba/Ti Ratio and Calcination Temperature on the Crystalline Phase of BaTiO 3calcination temp (°C)Ti precursor Ba/Ti ratio synthesis temp (°C)synthesis time (h)9001150crystalline phase HCl-TiO 21.21606--cubic 1.41606--cubic 1.61606--cubic 1.81606--cubic2.01606--cubic HClO 4-TiO 21.21606--cubic 1.41606--cubic 1.61606--cubic 1.81606--cubic2.01606--cubic HCl-TiO 21.21606yes -cubic 1.41606yes -cubic 1.61606yes -cubic 1.81606yes -cubic2.01606yes -cubic HClO 4-TiO 21.21606yes -cubic 1.41606yes -cubic 1.61606yes -cubic 1.81606yes -cubic2.01606yes -cubic HCl-TiO 21.21606-yes cubic 1.41606-yes cubic 1.61606-yes cubic 1.81606-yes cubic2.01606-yes cubic HClO 4-TiO 21.21606-yes tetragonal 1.41606-yes tetragonal 1.61606-yes tetragonal 1.81606-yes tetragonal2.01606-yestetragonalInd.Eng.Chem.Res.,Vol.47,No.6,20081869the thermodynamic stability diagram of Ba -Ti systems,BaCO 3precipitates at lower pH values than those needed to precipitate BaTiO 3.28Moreover,the formation of BaCO 3is more predomi-nant in BaTiO 3prepared using HClO 4-TiO 2,which indicates its lower pH compared with those prepared using HCl-TiO 2.The relative pH of HClO 4is lower than that of HCl as the p K a values of HClO 4and HCl are -10and -7,respectively.37The XRD results of the as-synthesized BaTiO 3illustrate the absence of apparent peak splitting at 2θ)45°,which corre-sponds to the tetragonal phase of BaTiO 3(JCPDS Card No.5-0626)and hence confirmed the cubic structure with symmetry Pm 3m .In order to remove BaCO 3,the powders were washed with formic acid and calcined at 900°C for 2h.Figure 1shows XRD patterns of BaTiO 3chemically treated with formic acid and calcined at 900°C,which confirms the removal of BaCO 3from BaTiO 3prepared using HCl-TiO 2and HClO 4-TiO 2.Moreover,it indicates that there is no change in the cubic phase of BaTiO 3upon treatment with formic acid.The effect of Ba/Ti ratio and calcination temperature on the crystal structure of BaTiO 3is summarized in Table 1.It can be observed that,even at a Ba/Ti molar ratio of 2without heat treatment,the tetragonal splitting of the diffraction peaks corresponding to the (200)and (002)planes of the perovskite BaTiO 3could not be distinguished,indicating the presence of pure cubic crystalline phase.Shi et al.36observed tetragonal BaTiO 3crystallites when the precursor with high Ba/Ti molar ratio of 3was used,which reduces the probability of forming barium vacancies and stabilized tetragonal phase.The influence of calcination temperature at various Ba/Ti ratios on the cubic -tetragonal phase transition of BaTiO 3can be observed by comparing Figures 1and 2.Figure 2shows the XRD patterns of BaTiO 3prepared using HCl-TiO 2and HClO 4-TiO 2,subjected to calcination at 1150°C.For BaTiO 3samples prepared using HCl-TiO 2,the XRD results show that the crystalline phase is metastable cubic phase for all the samples at 900and 1150°C.The peaks are very sharp,indicating that the crystalline structure is well developed.Generally,the tetragonality of BaTiO 3is deduced from the plane spacing of (002)over that of (200);the corresponding peak appears near 45°in the XRD patterns.Because the peak splitting at 45°is a predominant one to confirm the formation of tetragonal phase,tetragonal splitting of the peaks corresponding to (200)and (002)planes have been chosen to verify the formation of tetragonal phase.Normally,BaTiO 3cubic -tetragonal phase changes begin at 900and 1150°C,but for BaTiO 3prepared using HCl-TiO 2the phase transformation does not proceed to completion even at 1150°C.In the case of BaTiO 3prepared using HClO 4-TiO 2and calcined at 900°C,the XRD patterns are almost identical irrespective of Ba/Ti ratio and cubic phase is observed.However,tetragonal phase was observed at 2θ)45°for the powders synthesized at Ba/Ti ratios of 1.2,1.4,1.6,1.8,and 2.0and calcined at 1150°C for 2h,as shown in Figure 2b.A slight increase in the intensity of tetragonal phase with Ba/Ti ratio may be due to the removal of barium vacancies (charge compensator of OH -defect)by excess barium content,which stabilizes tetragonality.Figures 3and 4show the SEM pictures of BaTiO 3samples prepared using HCl-TiO 2and HClO 4-TiO 2,respectively,at various Ba/Ti ratios of 1.2,1.4,1.6,and 1.8.The particles agglomerated in a spherical shape with ca.0.05-0.15µm (ca.50-150nm)diameters.A possible mechanism for the formation of BaTiO 3by hydrothermal synthesis is the dissolution-Figure 2.XRD patterns of BaTiO 3synthesized at various Ba/Ti ratios using (a)HCl-TiO 2and (b)HClO 4-TiO 2precursors and calcined at 1150°C (2h).Figure 3.SEM micrographs of as-synthesized BaTiO 3prepared using HCl-TiO 2at various Ba/Ti ratios:(a)1.2,(b)1.4,(c)1.6,and (d)1.8.1870Ind.Eng.Chem.Res.,Vol.47,No.6,2008precipitation method,38in which there is a chemical equilibrium between TiO 2and [Ti(OH)x ]4-x .[Ti(OH)x ]4-x ,which is a highly active species,can combine with Ba 2+to form a new nucleus,and hence,with an increase in Ba/Ti ratio the chance for the formation of a new nucleus by [Ti(OH)x ]4-x increases and leads to a decrease in the particle size of BaTiO 3.Figure 3shows the decrease in the particle size of BaTiO 3with an increase in Ba/Ti ratio,which is in accord with the dissolution -precipitation mechanism.TEM results show that the primary particles of the sample prepared at Ba/Ti ratios of 1.2and 1.4using HCl-TiO 2as precursor are spherical in shape with 50-60nm diameters,as shown in Figure 5a,b,whereas the particle sizes of BaTiO 3prepared using HClO 4-TiO 2are in the range of 40-50nm diameters (Figure 5c,d).Moreover,it can be ascertained from TEM images that the Ba/Ti ratio increases the cluster size of primary particles.Besides,it should be noted that the stability of cubic and tetragonal phases depends on the critical size of BaTiO 3particles and the critical size was reported to be ∼50nm.39The crystallite size of BaTiO 3is a principal factor controlling tetragonality because the surface defects of nanoc-rystallites are predominant over the bulk ones below a certain critical size of BaTiO 3.The surface defects can prevent the completion of phase transformation,leading to high strains within the crystal.Increase in the cluster size of primary particles reduces the strain within the cubic structure for distortion.It can be concluded that the phase transition of cubic BaTiO 3occurs at 1150°C irrespective of Ba/Ti ratio when HClO 4-TiO 2was used as the TiO 2precursor.Moreover,the primaryparticleFigure 4.SEM micrographs of as-synthesized BaTiO 3prepared using HClO 4-TiO 2at various Ba/Ti ratios:(a)1.2,(b)1.4,(c)1.6,and (d)1.8.Figure 5.TEM micrographs of BaTiO 3prepared using (a)HCl-TiO 2,Ba/Ti )1.2;(b)HCl-TiO 2,Ba/Ti )1.4;(c)HClO 4-TiO 2,Ba/Ti )1.2;and (d)HClO 4-TiO 2,Ba/Ti )1.4.Figure 6.XRD patterns of BaTiO 3synthesized at various temperatures using (a)HCl-TiO 2and (b)HClO 4-TiO 2precursors calcined at 900°C (2h).Ind.Eng.Chem.Res.,Vol.47,No.6,20081871size of BaTiO 3prepared using HClO 4-TiO 2is smaller than that prepared using HCl-TiO 2,which can be ascribed to the smaller particle size of TiO 2prepared by HClO 4.34The agglomeration of BaTiO 3nanoparticles at higher calcination temperature promotes the stability of the tetragonal phase.3.2.Effect of Synthesis Temperature.To study the influence of synthesis temperature on the phase of BaTiO 3and particle morphology,BaTiO 3was prepared at 80,120,160,180,and 200°C while keeping the rest of the process parameters as Ba/Ti )1.2and the synthesis time as 6h.The XRD patterns of BaTiO 3obtained at different reaction temperatures and calcined at 900°C are given in Figure 6.The XRD results illustrated well-developed cubic crystalline phase and the intensity of the peaks increased with reaction temperature.There is a possibility of decrease in the unit-cell volume and decrease in density with an increase in the reaction temperature due to the release of lattice hydroxyls.20The influence of calcination temperature withsynthesis temperature is compiled in Table 2.Figure 7depicts the XRD patterns of BaTiO 3calcined at 1150°C.With increased synthesis temperature,the diffraction peaks related to the (200)and (002)planes of the tetragonal BaTiO 3separated and the c /a ratio of the lattice increased,confirming the cubic -tetragonal phase transition with synthesis temperature.The splitting of the (200)reflection is apparent for the samples synthesized at 180and 200°C,suggesting the tetragonal phase.The intensity ratio of 45°peaks significantly increased as the synthesis temperature increased.The presence of shoulders at 80and 120°C represents the formation of partially tetragonal phase in cubic BaTiO 3.The stabilization of tetragonal phase with increase in temperature may be due to the removal of hydroxyl groups in the BaTiO 3lattice.Figure 8depicts the SEM micrographs of BaTiO 3prepared using HCl-TiO 2at 80,120,180,and 200°C for 24h.The particles agglomerated into a spherical shape,and the particle sizes estimated from the SEM micrographs are within 0.05-0.15µm in diameter.When the synthesis temperature increased from 80to 200°C and with reacting for 24h,the particle size of BaTiO 3increased to 0.09-0.15µm.The shape of the particles was observed to be spherical independent of treated tempera-tures.The increase in the synthesis temperature leads to an increase in the particle size,which may explain the stronger agglomeration at higher temperature.However,for BaTiO 3prepared using HClO 4-TiO 2(Figure 9),the secondary particle size increased from 0.05to 0.10µm with an increase in the reaction temperature from 80to 200°C for 24h,confirming that the particle size of BaTiO 3was dependent on synthesis temperature.The overall shape of the agglomerated secondary particle size was estimated to be 0.05-0.10µm in diameter.As shown in Figure 10,the particles consist of near-monodis-perse spherical nanoparticles of BaTiO 3.The agglomeration of primary particles with an increase in the reaction temperature can be identified from TEM images,as shown in Figure 10.The clusters of primary particles observed for HClO 4-TiO 2precursor are more than those of HCl-TiO 2.This result suggested that the crystallite size is one of the vital factors that control tetragonality.At a higher reaction temperature,the phase transition has occurred from cubic to tetragonal.3.3.Effect of Calcination Temperature.The stability of the cubic phase in BaTiO 3prepared by hydrothermal synthesis at room temperature may be accounted for by the presence of weakly bound water molecules absorbed onto the surface of the particles and the more strongly bonded structural water as lattice OH -ions.The content of barium vacancy as well as OH -defects in the cubic crystallites is higher than that inTable 2.Effect of Synthesis Temperature and Calcination Temperature on the Crystalline Phase of BaTiO 3calcination temp (°C)Ti precursor Ba/Ti ratio synthesis temp (°C)synthesis time (h)9001150crystalline phase HCl-TiO 21.2806--cubic 1.21206--cubic 1.21606--cubic 1.21806--cubic 1.22006--cubic HClO 4-TiO 21.2806--cubic 1.21206--cubic 1.21606--cubic 1.21806--cubic 1.22006--cubic HCl-TiO 21.2806yes -cubic 1.21206yes -cubic 1.21606yes -cubic 1.21806yes -cubic 1.22006yes -cubic HClO 4-TiO 21.2806yes -cubic 1.21206yes -cubic 1.21606yes -cubic 1.21806yes -cubic 1.22006yes -cubic HCl-TiO 21.2806-yes cubic 1.21206-yes cubic 1.21606-yes cubic 1.21806-yes tetragonal 1.22006-yes tetragonal HClO 4-TiO 21.2806-yes cubic 1.21206-yes cubic 1.21606-yes tetragonal 1.21806-yes tetragonal 1.22006-yestetragonalFigure 7.XRD patterns of BaTiO 3synthesized (Ba/Ti )1.2)at various temperatures using (a)HCl-TiO 2and (b)HClO 4-TiO 2precursors and calcined at 1150°C (2h).1872Ind.Eng.Chem.Res.,Vol.47,No.6,2008tetragonal phase.The cubic -tetragonal phase transformation at higher reaction temperature and calcination temperature is due to the elimination of OH -vacancies from the lattice with heat treatment,which leads to the tetragonal stability.At the Curie point,where BaTiO 3undergoes a phase transition,the relative displacement of cation sublattice to O 2-sublattice causes the phase transition of BaTiO 3from cubic to tetragonal.The oxygen vacancies have significant mobility above 650°C,whereas the cation vacancies acquire measurable mobility only above 1050°C.24Moreover,the decrease in the lattice parameter of the crystallites with temperature led to the conclusion that the removal of OH -defects caused the enlargement of the unit cell and released the lattice strain to form the tetragonal phase.3.4.Effect of Synthesis Time.The effect of synthesis time on the formation of crystalline BaTiO 3was also studied by performing the experiments at different reaction times ranging from 3to 24h at 160°C with Ba/Ti )1.2.The crystalline form at shorter periods of time,viz.,3and 6h,is primarily the metastable cubic form.SEM micrographs indicated no signifi-cant difference in the morphology.The cluster size was larger by extending the processing time,but the particle size has no significant difference.BaTiO 3powders prepared by using HClO 4-TiO 2as the precursor resulted similarly to those prepared by using HCl-TiO 2as the precursor.The XRD patterns as shown in Figure 11confirm the cubic phase of BaTiO 3prepared using HCl-TiO 2and HClO 4-TiO 2calcined at 900°C.Figure 12a shows the typical phase transformation of BaTiO 3prepared using HCl-TiO 2.When BaTiO 3prepared using HCl-TiO 2was treated for 12h,a noticeable peak splitting appeared.With increasing reaction time from 12to 24h,the intensity and sharpness of the tetragonal peak splitting increased,indicating an increase in the crystallinity of the tetragonal phase along with anincreaseFigure 8.SEM micrographs of BaTiO 3synthesized using HCl-TiO 2at various temperatures:(a)80,(b)120,(c)180,and (d)200°C.Figure 9.SEM micrographs of BaTiO 3synthesized using HClO 4-TiO 2at various temperatures:(a)80,(b)120,(c)180,and (d)200°C.Figure 10.TEM micrographs of BaTiO 3prepared using (a)HCl-TiO 2,120°C;(b)HCl-TiO 2,180°C;(c)HClO 4-TiO 2,120°C;and (d)HClO 4-TiO 2,180°C.Ind.Eng.Chem.Res.,Vol.47,No.6,20081873in the particle size of BaTiO 3.The results are summarized in Table 3.The tetragonal BaTiO 3can be synthesized from HCl-TiO 2at reaction times of 12and 24h using Ba/Ti ratio of 1.2,synthesis temperature of 160°C,and calcination temperature at 1150°C for 2h.However,even at 3h reaction time,BaTiO 3prepared using HClO 4-TiO 2achieved the cubic -tetragonal phase transformation (Figure 12b).The reason can be ascribed to the acidic nature of HClO 4,which leads to the formation of BaTiO 3with fewer defects so as to stabilize the tetragonal phase apart from the possible influence of Cl -ions present in the reaction mixture.The presence of chloride ions is speculated to influence the diffusion of Ba 2+ions and retard the crystal growth process,thereby stabilizing the tetragonal phase by forming larger crystals.40In the early stage of reaction,chloride ions produce more nuclei and form smaller particles,which grow larger at prolonged time.Sun and Li 41reported that BaTiO 3particles synthesized in the presence of chloride ions are slightly larger than the particles synthesized in the absence of chloride ions,however,with an enhanced tetragonality compared to the latter.The physicochemical properties of TiO 2prepared from HCl and HClO 4make the difference in the properties of BaTiO 3.34Therefore,it is concluded that the BaTiO 3tetragonal phase can be successfully synthesized using HClO 4-TiO 2as the precursor at a [H +]/[Ti 4+]ratio of 1.2,synthesis temperature of 160°C,and calcination temperature of 1150°C (2h).344.ConclusionIn the present study,the morphology and phase transformation of BaTiO 3prepared using HCl-TiO 2and HClO 4-TiO 2with respect to reaction temperature,reaction time,Ba/Ti ratio,and calcination time were investigated.Increase in Ba/Ti ratio,temperature,and reaction time increases the possibility of cubic phase transformations.Well-crystallized tetragonal BaTiO 3powders of high purity were obtained using HCl-TiO 2as the precursor at optimum conditions of Ba/Ti ratio )1.2,temper-Figure 11.XRD patterns of BaTiO 3synthesized at various reaction times using (a)HCl-TiO 2and (b)HClO 4-TiO 2precursors calcined at 900°C (2h).Figure 12.XRD patterns of BaTiO 3synthesized at various reaction times using (a)HCl-TiO 2and (b)HClO 4-TiO 2precursors.Conditions:reaction temperature )160°C;Ba/Ti )1.2;calcination temperature )1150°C (2h).Table 3.Effect of Synthesis Time and Calcination Temperature on the Crystalline Phase of BaTiO 3calcination temp (°C)Ti precursor Ba/Ti ratio synthesis temp (°C)synthesis time (h)9001150crystalline phase HCl-TiO 21.21603--cubic 1.21606--cubic 1.216012--cubic 1.216024--cubic HClO 4-TiO 21.21603--cubic 1.21606--cubic 1.216012--cubic 1.216024--cubic HCl-TiO 21.21603yes -cubic 1.21606yes -cubic 1.216012yes -cubic 1.216024yes -cubic HClO 4-TiO 21.21603yes -cubic 1.21606yes -cubic 1.216012yes -cubic 1.216024yes -cubic HCl-TiO 21.21603-yes cubic 1.21606-yes cubic 1.216012-yes tetragonal 1.216024-yes tetragonal HClO 4-TiO 21.21603-yes tetragonal 1.21606-yes tetragonal 1.216012-yes tetragonal 1.216024-yestetragonal1874Ind.Eng.Chem.Res.,Vol.47,No.6,2008ature)180°C,synthesis time)6h,and calcination at 1150°C for2h.However,the phase transformation of BaTiO3 prepared using HClO4-TiO2occurred at lower reaction temper-ature(160°C)and synthesis time(3h)than BaTiO3particles prepared using HCl-TiO2.BaTiO3particles are agglomerated to a spherical shape with ca.80-90nm and BaTiO3particles synthesized with HClO4-TiO2were smaller than those prepared by HCl-TiO2.The stabilization of cubic BaTiO3is caused by defects including OH-defects and barium vacancies.The formation of tetragonal BaTiO3is promoted by the use of high reaction temperature,calcination temperature,and reaction time, which reduces the probability of forming OH-vacancies.In summary,the precursor has a strong influence on the size and morphology of BaTiO3.BaTiO3prepared from HClO4-TiO2 indeed increases the transformation of cubic-to-tetragonal phase at lower reaction conditions without significant particle growth. AcknowledgmentThis research was supported by the National Science Council, Taiwan,Republic of China.Literature Cited(1)von Hippel,A.Ferroelectricity,domain structure,and phase transi-tions of barium titanate.Re V.Mod.Phys.1950,22,221.(2)Zhu,W.;Akbar,S.A.;Asiaie,R.;Dutta,P.K.Sintering and dielectric properties of hydrothermally synthesized cubic and tetragonal BaTiO3powders.Jpn.J.Appl.Phys.1997,36,214.(3)Kiss,K.;Magder,J.;Vukasovich,M.S.;Lockhart,R.J.Ferroelectrics of ultrafine particle size:I,synthesis of titanate powders of ultrafine particle size.J.Am.Ceram.Soc.1996,49,291.(4)Bruno,S.A.;Swanson,D.K.High-performance multilayer capacitor dielectrics from chemically prepared powders.J.Am.Ceram.Soc.1993, 76,1233.(5)Yogo,T.;Yamamoto,T.;Sakamoto,W.;Hirano,S.In situ synthesis of nanocrystalline BaTiO3particle-polymer hybrid.J.Mater.Res.2004, 19,3290.(6)Rao,Y.;Wong,C.P.Material characterization of a high-dielectric-constant polymer-ceramic composite for embedded capacitor for RF applications.J.Appl.Polym.Sci.2004,92,2228.(7)Huybrechts,B.;Ishizaki,K.;Takata,M.The positive temperature coefficient of resistivity in barium titanate.J.Mater.Sci.1995,30,2463.(8)Choi,G.J.;Lee,S.K.;Woo,K.J.;Koo,K.K.;Cho,Y.S. Characteristics of BaTiO3particles prepared by spray-coprecipitation method using titanium acylate-based precursors.Chem.Mater.1998,10,4104.(9)Hu,M.Z. C.;Miller,G. A.;Payzant, E. A.;Rawn, C.J. Homogeneous(co)precipitation of inorganic salts for synthesis of mono-dispersed barium titanate particles.J.Mater.Sci.2007,35,2927.(10)Wul,B.M.;Goldman,I.M.Dielectric constants of titanates of metals of the second group.C.R.Acad.Sci.URSS1945,46,139.(11)Haertling,G.H.Ferroelectric ceramics:history and technology. J.Am.Ceram.Soc.1999,82,797.(12)Boulos,M.;Guillemet-Fritsch,S.;Mathieu,F.;Durand,B.;Lebey, T.;Bley,V.Hydrothermal synthesis of nanosized BaTiO3powders and dielectric properties of corresponding ceramics.Solid State Ionics2005, 176,1301.(13)Testino,A.;Buscaglia,M.T.;Buscaglia,V.;Viviani,M.;Bottino,C.;Nanni,P.Kinetics and mechanism of aqueous chemical synthesis of BaTiO3particles.Chem.Mater.2004,16,1536.(14)Beck,C.;Hartl,W.;Hempelman,R.Size-controlled synthesis of nanocrystalline BaTiO3by a sol-gel type hydrolysis in microemulsion-provided nanoreactors.J.Mater.Res.1998,13,3174.(15)Wang,J.;Fang,J.;Ng,S.C.;Gan,L.M.;Chew,C.H.;Wang,X.; Shein,Z.Ultrafine barium titanate powders via microemulsion processing routes.J.Am.Ceram.Soc.1999,82,873.(16)Kobayashi,Y.;Nishikata,A.;Tanase,T.;Konno,M.J.Size effect on crystal structures of barium titanate nanoparticles prepared by a sol-gel method.Sol-Gel Sci.Technol.2004,29,49.(17)Harizanov,O.;Harizanova,A.;Ivanova,T.Formation and char-acterization of sol-gel barium titanate.Mater.Sci.Eng.,B2004,106,191.(18)Yan,T.;Liu,X.-L.;Wang,N.-R.;Chen,J.-F.Synthesis of monodispersed barium titanate nanocrystals s hydrothermal recrystallization of BaTiO3nanospheres.J.Cryst.Growth2005,281,669.(19)Tripathy,S.K.;Sahoo,T.;Mohapatra,M.;Anand,S.;Das,R.P. XRD studies on hydrothermally synthesized BaTiO3from TiO2-Ba(OH)2-NH3system.Mater.Lett.2005,59,3543.(20)Qi,L.;Lee,B.I.;Badheka,P.;Wang,L.-Q.;Gilmour,P.;Samuels, W.D.;Exarhos,G.J.Low-temperature paraelectric-ferroelectric phase transformation in hydrothermal BaTiO3particles.Mater.Lett.2005,59, 2794.(21)Qi,L.;Lee,B.I.;Badheka,P.;Yoon,D.-H.;Samuels,W.D.; Exarhos,G.J.Short-range dissolution-precipitation crystallization of hydrothermal barium titanate.J.Eur.Ceram.Soc.2004,24,3553.(22)Lee,S.;Son,T.;Yun,J.;Kwon,H.;Messing,G.L.;Jun,B. Preparation of BaTiO3nanoparticles by combustion spray pyrolysis.Mater. Lett.2004,58,2932.(23)Simom-Seveyrat,L.;Hajjaji, A.;Emziane,Y.;Guiffard, B.; Guyomar,D.Re-investigation of synthesis of BaTiO3by conventional solid-state reaction and oxalate coprecipitation route for piezoelectric applications. Ceram.Int.2007,33,35.(24)Lencka,M.M.;Riman,R. E.Thermodynamic modeling of hydrothermal synthesis of ceramic powders.Chem.Mater.1993,5,61.(25)Newalkar,B.L.;Komarneni,S.;Katsuki,H.Microwave-hydro-thermal synthesis and characterization of barium titanate powders.Mater. Res.Bull.2001,36,2347.(26)Guo,L.;Luo,H.;Gao,J.;Guo,L.;Yang,J.Microwave hydro-thermal synthesis of barium titanate powders.Mater.Lett.2006,60,3011.(27)Xu,H.;Gao,L.Hydrothermal synthesis of high-purity BaTiO3 powders:control of powder phase and size,sintering density,and dielectric properties.Mater.Lett.2004,58,1582.(28)Lencka,M.M.;Riman,R.E.Thermodynamics of the hydrothermal synthesis of calcium titanate with reference to other alkaline-earth titanates. Chem.Mater.1995,7,18.(29)Begg,B.D.;Vance,E.R.;Nowotny,J.Effect of particle size on the room-temperature crystal structure of barium titanate.J.Am.Ceram. Soc.1994,77,3186.(30)Kajiyoshi,K.;Ishizawa,N.;Yoshimura,M.Preparation of tetragonal barium titanate thin film on titanium metal substrate by hydrothermal method.J.Am.Ceram.Soc.1991,74,369.(31)Takeuchi,T.;Ado,K.;Asai,T.;Kageyama,H.;Saito,T.; Masquelier,C.;Nakamura,O.Thickness surface phase of barium titanate single-crystalline grains.J.Am.Ceram.Soc.1994,77,1665.(32)Li,X.;Shih,W.H.Size effects in barium titanate particles and clusters.J.Am.Ceram.Soc.1997,80,2844.(33)Henninga,D.;Schreinemacher,S.Characterization of hydrothermal barium titanate.J.Eur.Ceram.Soc.1992,9,41.(34)Rajesh, B.;Sasirekha,N.R.;Chen,Y.-W.Influence of acid precursors on physicochemical properties of nanosized titania synthesized by thermal-hydrolysis method.Mater.Res.Bull.2008,43,682.(35)Bai,W.;Choy,K.L.;Sytelzer,N.H.J.;Schoonman,J.Thermo-phoresis-assisted vapour phase synthesis of CeO2and Ce x Y1-x O2-δnano-particles.Solid State Ionics1999,116,225.(36)Shi,E.W.;Xia,C.T.;Zhong,W.Z.;Wang,B.G.;Feng,C.D. Crystallographic properties of hydrothermal barium titanate crystallites.J. Am.Ceram.Soc.1997,80,1567.(37)Atkins,P.W.Physical Chemistry,5th ed.;W.H.Freeman and Company:New York,1994.(38)Chen,K.Y.;Chen,Y.-W.Preparation of barium titanate ultrafine particles from rutile titania by a hydrothermal conversion.Powder Technol. 2004,141,69.(39)Ishikawa,K.;Yoshikawa,K.;Okada,N.Size effect on the ferroelectric phase transition in PbTiO3ultrafine particles.Phys.Re V.B 1998,37,5852.(40)Dutta,P.K.;Gregg,J.R.Hydrothermal synthesis of tetragonal barium titanate.Chem.Mater.1992,4,843.(41)Sun,W.;Li,J.Microwave-hydrothermal synthesis of tetragonal barium titanate.Mater.Lett.2006,60,1599.Recei V ed for re V iew July20,2007Re V ised manuscript recei V ed November30,2007Accepted December23,2007IE070986M Ind.Eng.Chem.Res.,Vol.47,No.6,20081875。
亚微米级钛酸钡的晶相与形貌调控及其立方-四方晶相转变DING Houyuan;SHANG Shaoming;GU Dan;QIN Gaomin;LIU Hao;ZHAO Beibei【摘要】以α钛酸和八水合氢氧化钡为原料,采用低温固相法制备出均一性良好的亚微米级四方相钛酸钡,研究了焙烧工艺(焙烧温度、焙烧时间、升温速率和焙烧方式)对钛酸钡微观形貌结构、晶相含量、晶粒大小和晶相转变温度的影响.通过SEM、XRD和Raman等手段对钛酸钡样品进行了表征,其结果表明四方相钛酸钡晶粒大小为亚微米级,在300℃由亚稳态立方相钛酸钡晶相转变而来,600℃时钛酸钡晶粒以立方体形貌为主,700℃时钛酸钡粉体中以四方相钛酸钡为主.无论是晶相转变温度还是焙烧温度均较传统温度显著降低.【期刊名称】《功能材料》【年(卷),期】2018(049)012【总页数】6页(P12211-12216)【关键词】钛酸钡;低温固相法;焙烧工艺;晶相转变;功能粉体【作者】DING Houyuan;SHANG Shaoming;GU Dan;QIN Gaomin;LIUHao;ZHAO Beibei【作者单位】;;;;;【正文语种】中文【中图分类】TQ1740 引言四方相钛酸钡(T-BaTiO3)由于其较好的压电、铁电性能、低介电损耗和高介电常数等优点,广泛应用在多层陶瓷电容器(MLCC)、光电器件、PTC热敏电阻和压电传感器等电子元器件中[1-4]。
随着电子元器件小型化和高性能化趋势发展,一种具有结晶度高、晶相含量高、纯度高、粒度分布窄、均一性好和粒径小而可调控等特征[5-7]的T-BaTiO3粉体,具有良好的应用前景与价值。
传统固相法[8-9]制备钛酸钡(BaTiO3)是通过高温下焙烧BaCO3和TiO2获得的,该法得到的BaTiO3晶粒大小多为微米级、均匀性较差、表面活性差和高度团聚等缺点。
由于传统固相法无法满足要求,更多的展开溶胶-凝胶法[10-11]、水热法[13-14]和沉淀法[15]等液相法进行BaTiO3的制备研究,然而液相法也存在着结晶度和四方相含量低等粉体质量问题,以及制备过程中的废液产生、成本和二次煅烧带来的能耗等问题。
2,4-二羟基苯甲酸辅助合成不同形貌二氧化铈及其在NH3-SCR中的应用苏航;徐蔓;周诗健;杨福;孔岩【摘要】使用2,4-二羟基苯甲酸(DHBA)辅助控制合成出具有不同形貌(棒状与片状)的碱式碳酸铈.在水热阶段,碱式碳酸铈的形貌可以通过DHBA的量进行调控.当DHBA为3.5 mmol时,得到棒状碱式碳酸铈,然而增加DHBA的量至5.0 mmol时,可形成片状碱式碳酸铈.棒状与片状fcc-CeO2(面心立方二氧化铈)可成功地通过相应的焙烧处理获得.所得二氧化铈均有较大的比表面积(>60 m2· g-1),然而与片状二氧化铈相比,棒状二氧化铈有更高的氧化还原能力与更多的酸量.棒状二氧化铈用于NH3-SCR时有着更好的催化活性.%Different morphologies (rod-like and sheet-like) of CeOHCO3 were controllably synthesized by using 2,4-dihydroxybenzonic acid (DHBA) as auxiliary.During the hydrothermal process,the morphologies of CeOHCO3 were controlled by adding different amount of DHBA.When the amount of DHBA was 3.5 mmol,rod-like CeOHCO3 was synthesized,while by increasing the amount of DHBA to 5.0 mmol,the sheet-like CeOHCO3 was relatively generated.Then the rod-like and sheet-like fcc-CeO2 (face-centered cubic-CeO2) were successfully obtained by the subsequent calcination procedure.The resulted CeO2 affords large surface area (>60 m2· g-1),while the rod-like CeO2 exhibits higher redox ability and more acid amount compared to those of sheet-like CeO2.In addition,the rod-like CeO2 exhibits better catalytic activity in NH3-SCR.【期刊名称】《无机化学学报》【年(卷),期】2018(034)008【总页数】9页(P1538-1546)【关键词】二氧化铈;2.4-二羟基苯甲酸;纳米结构;水热合成;NH3-SCR【作者】苏航;徐蔓;周诗健;杨福;孔岩【作者单位】南京工业大学化工学院,材料化学工程国家重点实验室,南京 210009;南京工业大学化工学院,材料化学工程国家重点实验室,南京 210009;南京工业大学化工学院,材料化学工程国家重点实验室,南京 210009;南京工业大学化工学院,材料化学工程国家重点实验室,南京 210009;南京工业大学化工学院,材料化学工程国家重点实验室,南京 210009【正文语种】中文【中图分类】O643.36;TB340 IntroductionIn recentdecades,metaloxideshave been intensely applied in the fields of catalysis[1-2],sensor[3-4],lithium-ion battery[5-6],etc.Particularly,metal oxides with controlled shapes have positive effect in heterogeneous catalysis system.Some related properties,such as the specific architecture and high surface area have important influence on the anchoring of the active sites and controlling the diffusion of reactants.With the well-defined morphologies,the researchers can not only adjust the requiredphysicochemical properties but also improve the catalytic performance[7].Therefore,it is of great significance to explore facile and controllable routes for designing the desired structures.As well known,nitrogen oxides remain the major pollution source in the air,which could result in the formation of photochemical smog,ozone depletion and acid rain[8].These situations are directly harmful to ecological environment and human health.In order to address this dilemma,some effective approaches are expected.Fortunately,selective catalytic reduction of NO with NH3has been regarded as one of the considerable technologies for the abatement of NO(NH3-SCR),and the process can be described by the following equation:Besides,as one of the metal oxides,ceria(CeO2)has been continually focused owing to the highly oxygen storage capacity,enhanced metal dispersion and facile stabilization of the support[9-10].Meantime,CeO2can also serve as an outstanding component in the field of selective catalytic reduction of NO with NH3[11].However,the CeO2-based materials have been significantly demonstrated that the morphologies are closely associated with the physicochemical properties.Typically,for the pure CeO2,hollow ceria nanosphere with multiple shells exhibited distinguishable photocatalytic activity in water oxidation[12].With regard to the hybrid CeO2-based materials,core-shell Pd@CeO2 nanostructures were found to exhibit excellent catalytic activity in NOreduction[13].Recently,in the system of NH3-SCR,Li et al.reported that thenovel MnOx-CeO2nanosphere showed superior activity than the non-structured MnOx-CeO2catalyst[14].Hybrid multi-shell hollow structured CeO2-MnOxwas designed and found that this material displayed excellent catalytic activity compared to the traditional CeO2-MnOxnanoparticles or single-shell hollow spheres[15].Although great efforts have been achieved,there is still room for controllable synthesis of CeO2with specific morphologies and apply to NH3-SCR.To control the morphology of CeO2,some efficient methods,such as hydrothermal[16],polyol method[17],template method[18]and colloidal solution combustion[19]have been adopted.While,in consideration of the tunable reaction parameters,such as different temperatures and additives,the hydrothermal method could be considered as a promising route.Notably,benzoic acid compoundshavebeen achieved toprepare various polymers,pharmaceuticals and metal-organic framework particles (MOFs).Especially,Fan et al.[20]reported CuFe2O4@HKUST-1 heterostructureswith MOFs shell were constructed by 1,3,5-benzenetricarboxylic acid.Korpany et al.[21]explored a series of benzoic acid derivatives to fabricate surface functionalized iron oxide nanoparticles.Plentiful functional materials have opened a doorto discoverthe relationship between benzoic acid derivatives and nanomaterials.Therefore,choosing the appropriate method as wellas the suitable benzoic acid compounds play an important role in the synthesis of desirable nanoparticles.Whereas,to the best of our knowledge,it is still lack the research in controlling synthesis of nanocrystallines including CeO2byusing benzoic acid derivatives.Herein,the rod-like and sheet-like CeO2were successfully synthesized with the assistant of 2,4-dihydroxybenzonic acid.The selected 2,4-dihydroxybenzonic acid could be completely dissolved in the reaction system to form a homogeneous solution.Timedependentand temperature-dependentexperiments were carried out to study the growth mechanism of the CeO2.Besides,the physicochemical properties of the CeO2were investigated.In addition,the catalytic activity of the as-prepared CeO2was evaluated in the system of NH3-SCR.1 ExperimentalThe rod-like CeO2was synthesized via the hydrothermalmethod and the calcination procedure.Typically,2 mmol of Ce(NO3)3·6H2O and 3.5 mmol of 2,4-dihydroxybenzoic acid (DHBA)were dissolved in the mixed solution of 15.0 mL ethanol and 30.0 mL deionized water.Then 5.0 mL of sodium acetate solution (0.5 mol·L-1)was added dropwise into the mixed solution with stirring.The obtained homogeneous solution was transferred into a Teflon-lined autoclave and heated at 180℃for 24 h in an electricoven.Moreover,the autoclave was cooled to room temperature,the precipitate wascentrifuged and washed with deionized water for four times and dried at 60℃for 6 h.Then the precursor(Ce-Pre-1)was calcined in air atmosphere at 500℃with a heat ramp rate of 2℃·min-1for 4 h,and the calcined products were named as Ce-Cal-1.Instead,the sheet-like CeO2was obtained according to the similar process of rod-like CeO2by increasing the amount of DHBA to 5 mmol,and thehydrothermal products and the calcined products were labeled as Ce-Pre-2 and Ce-Cal-2,respectively.Time-dependent experiments for the precursors of Ce-Cal-1 and Ce-Cal-2 were carried out at different hydrothermal intervals of 3,6,10 and 21 h without changing other reaction parameters.The temperaturedependent experiments of Ce-Cal-2 were performed at 120,140 and 160℃,respectively. X-ray diffraction patterns (XRD)was used for characterizing the phase purity with a monochromatic Cu Kα radiation source (λ =0.154 178 nm)and operated at 40 kV and 100 mA in the range of 10°~80°.Field-emission scanning electron microscopy(FESEM)was performed on a Hitachi S4800 Field-Emission Scanning Electron Microscope and operated at 5 kV.High-resolution transmission electron microscopy(HRTEM)images were recorded on an EM-2010 EX microscope with the accelerating voltage at 200 kV.The N2adsorption-desorption isothermswere carried out in the relative pressure (P/P0)range from 0.01 to 0.99,and the surface area of samples were calculated by Brunauer-Emmet-Teller equation(BET).Temperature-programmed reduction under H2environment(H2-TPR)was carried out on a TP-5000 instrument.50 mg CeO2was pretreated under He-O2stream at 500℃for 1 h.After cooling down to room temperature,the catalyst was purged with 30 mL·min-1of He for 30 min to remove the excess O2.Then the flow of 5%H2-He was introduced into the sample with a flow rate of 30 mL·min-1and the temperature was raised to 950℃ at a rate of 10℃·min-1.The acidity of the CeO2was measured by NH3temperature programmed desorption (NH3-TPD)in the same instrument as the H2-TPR.Prior to TPDexperiment,100 mg CeO2was pretreated at 300℃for 30 min and cooling to 50℃under argon flow.The sample was exposed to a flow of 2.500 g·L-1NH3/Ar(50 mL·min-1)at 100 ℃for 1 h,followed by argo n purging for another 1 h.Then,the temperature was raised to 950℃in argon flow at the rate of 10℃·min-1.Thermogravimetry and differential scanning calorimetry (TG-DSC) was measured by a NETZSCH STA 409 instrument with a heating rate of 10℃·min-1under nitrogen atmosphere.Fourier transform infrared (FT-IR)spectra of the samples were obtained in the range of 4 000~500 cm-1with powders dispersed in KBr on Bruker VECTOR22 resolution.The catalytic conversion of NO was measured via a fixed-bed reactor with 0.2 g pure CeO2 (40~60 mesh)as catalyst.The feed gas contained 500 mg·L-1 NH3,500 mg·L-1NO,5%(V/V)O2,5%(V/V)H2O,with N2as the balance gas.The total flow rate of the feed gas was 200 mL·min-1,corresponding to a space velocity of 60 L·g-1·h-1.The concentration of NO was detected by an onlin e Thermo fisher IS10 FTIR spectrometer equipped with a 2 m path-length gas cell(250 mL).The NO conversion can be calculated by NO conversion=(cNO,in-cNO,out)/cNO,in×100%.2 Results and discussionFig.1(a)and Fig.1(e)show the X-ray diffraction patterns(XRD)of Ce-Cal-1 and Ce-Cal-2.The diffraction peaks atca.28.5°,32.9°,47.3°,56.2°,59.1°,69.4°,76.5°,78.7°are well indexed to the facecentered cubic CeO2(fcc-CeO2,PDF No.34-0394),implying the samples are not amorphous.Fig.1(b)depicts the typical rod-morphology of Ce-Cal-1 with the average width of 100~300 nm and the average length of 500nm~1.5 μm.The TEM image in Fig.1(c)also reveals the rod-like profile of CeO2.Fig.1(d)presents the corresponding HRTEM image of Ce-Cal-1.As shown in Fig.1(d),the lattice fringe spacing of 0.27 and 0.31 nm correspond to (200)and(111)diffraction planes of CeO2,respectively.On the other hand,Ce-Cal-2 displays the sheet morphology with the thickness below 80 nm and the length can reach to 700 nm(Fig.1(f)and Fig.1(g)).Theobvious lattice fringe spacing of 0.31 nm in Fig.1(h)matches well with(111)diffraction plane of CeO2.In addition,the SAED profiles manifest the typical single crystal,and some defects of the resulted CeO2could be discovered(marked as green rectangles).Therefore,the rod-like and sheet-like CeO2are successfully synthesized in this case.Fig.1 XRD patterns(a,e),SEM images(b,f),TEM images(c,g),HRTEMimages(d,h)with the corresponding SAED(inset)of Ce-Cal-1 and Ce-Cal-2,respectivelyFig.2 N2adsorption-desorption isotherms(a,b),H2-TPR(c)and NH3-TPD profiles(d)of Ce-Cal-1 and Ce-Cal-2The N2adsorption-desorption isotherms of CeO2 were measured and shown in Fig.2(a)and Fig.2(b).The BET surface areas of the Ce-Cal-1 and Ce-Cal-2 are calculated as about 61 m2·g-1and 68 m2·g-1,respectively.Temperature-programmed reduction under H2environment (H2-TPR)was tested to detect the redox property of the resultedCeO2(Fig.2(c)).Both the samples manifest the similar reduction peak positions,which are in good agreement with the pure ceria in other reports[22-23].To be specific,the α1 peak at the lower temperaturebetween 250~600 ℃ could be attributed to the reduction of the absorbed surface oxygen species and the surface oxygen species of CeO2.The α2 peak in the range of 750~800 ℃ could be ascribed to the reduction of bulk oxygen.The H2 consumption amount of Ce-Cal-1 at α1 is higher than that of Ce-Cal-2,which could be attributable to the abundant surface oxygen species in Ce-Cal-1(Table 1).Meantime,some differences of the bulk oxygen are also presented(α2),which may be connected with the different structures.Temperature-programmed desorption experiments of NH3(NH3-TPD)were examined to understand the acidity strength,and the results are presented in Fig.2(d).The desorbed β1 peak presents at the lower temperature of 300~570 ℃,corresponding to the desorption of physisorbed NH3and NH3at the weak acid sites[24].While the desorbed β2 peak ranging between 570 and 940℃is assigned to NH3 absorbed at the strong acid sites[25].The desorbed peak positions of the acid sites are analogous with each other;however,the NH3amount of β1 and β2 in Ce-Cal-1 are higher than those in Ce-Cal-2,indicating that the Ce-Cal-1 could possess of more acid sites.Moreover,the acid amount of the strong acid sites in both Ce-Cal-1 and Ce-Cal-2 are higher than those in the weak acid sites.Therefore,the H2consumption and NH3desorption amount of Ce-Cal-1 are higher than those of Ce-Cal-2,possibly associating with the diverse shapes and differentexposed crystalline facets[26-27].Distinguishable physicochemical properties of the as-prepared rod-like and sheet-like CeO2can be discovered.To reveal the crystal phase and morphology evolution for the precursors ofCe-Cal-1 and Ce-Cal-2,time-dependentexperimentswere investigated.As displayed for the precursors of Ce-Cal-1(Fig.3(a)),the diffraction peaks of the samples can be well indexed to pure orthorhombic phase of CeOHCO3(PDF No.41-0013).However,with regard to the precursors of Ce-Cal-2(Fig.3(b)),the resulted precursors show the gradual phase transformation behaviors from orthorhombic phase (initial period)to hexagonal phase(final period).As expected,those products can be completely transformed into hexagonal phase of CeOHCO3(PDF No.32-0189)with the longer reaction time(21 and 24 h).It is noticeable that the mixed phases of orthorhombicand hexagonalareinvolved in the intermediate stages.Besides,representative SEM images of the precursors at different reaction intervals were examined.For the precursors of Ce-Cal-1,the SEM images display the simplex rod-like morphology from Fig.3(c)to Fig.3(g)without obvious morphology transformation.However,as depicted from Fig.3(h)to Fig.3(l),the product affords rod-like structure at initial 3 h,and then the rod particles partially dissolve and accompany with the presence of some apparently granular particles(6 and 10 h).Finally,more sheet-like particles emerge as the dominant state (21 and 24 h).It should be noted that when the reaction system is absence of DHBA,the hydrothermal product presents the pure phase of CeO2with irregular morphology (Fig.4).Those results indicate that the CeOHCO3with specific morphology fails to be obtained in this condition.Table 1 Quantitative analysis of H2-TPR and NH3-TPDa,bH2consumptionand NH3amount are calculated from the corresponding peakarea,respectively.NH3-TPD H2consumption/a.u.a NH3amount/a.u.b α1 α2 β1 β2 β1+β2 Ce-Cal-1 1 090 946 8 187 9 385 17 572 Ce-Cal-2 849 864 5 999 7 941 13 940 H2-TPR Catalyst α1+α2 2 036 1 713Fig.3 XRD patterns of the precursors Ce-Cal-1(a)and Ce-Cal-2(b)at different hydrothermal intervals;SEM images for the precursors of Ce-Cal-1(c~g)and Ce-Cal-2(h~l)at different reaction intervals of 3,6,10,21 and 24h,respectivelyFig.4 XRD pattern(a)and SEM image(b)of the hydrothermal product synthesized without DHBATemperature-dependentexperimentsbased on Ce-Cal-2 were carried out and the SEM images are shown in Fig.5.The sample obtained at120℃exhibits the rod-like structure with the average width of 300~500 nm and the length below 3 μm.Moreover,those particles present the highly decentralized state withoutsignificantaggregation.However,as the temperature up to 140 and 160℃,the products exhibit the rod-like morphology with the state of aggregation.Obviously,the typical sheet-like morphology ofthe productcan be observed asthe temperature reaching to 180℃(Ce-Pre-2).This phenomenon indicates that a morphology reconstruction process could be triggered with the high temperature. Fig.5 SEM images of the hydrothermal products at 120℃(a,b),140℃(c)and 160℃(d)For investigating the inorganic species of Ce-Pre-1 and Ce-Pre-2,FT-IR was recorded and the results are displayed in Fig.6(a).The Ce-Pre-1 is taken asan example to illustrate.The peak at ca.3 461 cm-1 could be due to the stretching vibration of O-H groups in the adsorbed water,and the bending mode of O-H at ca.1 638 cm-1could also be observed.The band at ca.1 561 cm-1should be attributable to the asymmetric stretching of CO2.Another sharp peak at ca.1 420 cm-1 may be assigned to the stretching vibration of CO32-.Besides,in the region of 700~900 cm-1,the bands at ca.861 and ca.724 cm-1are correspondingly attributed to the deformation of CO32-and asymmetric vibration of CO2species,respectively.The peak at ca.594 cm-1could be ascribed to the Ce-O stretching band[28].Some of the characteristic peaks including the stretching vibration and bending mode of O-H,the asymmetric stretching of CO2and the stretching band of Ce-O in Ce-Pre-2 are similar to Ce-Pre-1,indicating the same component of the two samples(CeOHCO3).However,some difference can be found in the range of 1 400~1 500 cm-1and 700~900 cm-1,which could be due to the different crystal phases and morphologies of the CeOHCO3.In addition,the thermostability of Ce-Pre-1 and Ce-Pre-2 were analyzed by thermogravimetry and differential scanning calorimetry(TGDSC).As can be seen from Fig.6(b)and Fig.6(c),the curves manifest the weight loss between 240 and 300℃with the major exothermic peak.The weight loss of Ce-Pre-1 and Ce-Pre-2 are approximately 21.8%and 21.2%,respectively,which are close to the theoretical decomposition value of CeOHCO3to CeO2(20.7%). Fig.6 FT-IR spectra(a),TG-DSC curves(b,c)of Ce-Pre-1 and Ce-Pre-2Fig.7 Illustration for the possible morphology evolution process for the Ce-Cal-1 and Ce-Cal-2Based on the above-mentioned characterization and analysis,we tentatively propose that the DHBA could decompose into carbon species(CO32-).The OH-could also be produced by the hydrolysis of CO32-,CH3COO-under the hydrothermal condition.Thus,Ce3+could combine with OH-and CO32-to generate small granules with high surface energy.Meantime,the sustaining nucleation could be favorable to the growth of rod-like orthorhombic phase of CeOHCO3.It is noticeable that the rod-like CeOHCO3could exist as the stable product with 3.5 mmol of DHBA(Fig.7,Route 1).While theprocessofdissolution and recrystallization could be triggered with 5.0 mmol of DHBA,and rod-like CeOHCO3could dissolve and reconstruct to form the sheet-like hexagonal phase of CeOHCO3ultimately(Fig.7,Route 2).As reported,the defects of the crystals could induce the dissolution and recrystallization process for the formation of CeO2 with nanosheet morphologies[29-30].However,in consideration of the different experiment conditions,the high content of the DHBA and high hydrothermal temperature could also play the important roles in this process.Furthermore,the as-prepared CeO2could preserve the rod-like and sheet-like morphologies after calcination.In this work,Ce-Cal-1 and Ce-Cal-2 are used as catalysts for eliminating NO with NH3.As shown in Fig.8,both of the samples present the similar trend of NO conversion from 100 to 400℃.With increasing the temperature to 350℃,Ce-Cal-1 shows the higher conversion about 69.2% compared with Ce-Cal-2(50.9%).According to the results of H2-TPR and NH3-TPD,this phenomenon could be due to that Ce-Cal-1 possesses of the higher redoxability and more acid amount.The obtained CeO2particles exhibit structuredependent catalytic activity for the catalytic reduction ofNO.Besides,both the NO conversion of Ce-Cal-1 and Ce-Cal-2 are higher than the reported pure CeO2,indicating high catalytic activity of Ce-Cal-1[31].On the account of the catalytic results,the rod-like CeO2 could be viewed as the optimized structure for the reaction.Fig.8 NO conversion of the Ce-Cal-1 and Ce-Cal-23 ConclusionsIn summary,the rod-like and sheet-like CeOHCO3 were successfully synthesized with the assistant of 2,4-dihydroxybenzonic acid.The rod-like orthorhombic phase of CeOHCO3was proposed as the stable product via the nucleation growth process,and the dissolution and recrystallization accompanied with the morphology evolution and phase transformation were supposed to the generation ofsheet-like hexagonalphase of CeOHCO3.The highly dispersed rod-like CeOHCO3 could be obtained under the low hydrothermal temperature,while the state of aggregation and the transformation of morphology could be triggered by the high temperature.The obtained CeO2presented distinguishablestructure-dependentproperties,and the rod-like CeO2exhibited higher redox ability and moreacid amount.Moreover,the rod-like CeO2 manifested the better catalytic activity in NH3-SCR.Furthermore,it is proposed that more benzoic acid compounds can be expected to fabricate metal oxides with desirable morphologies.References:【相关文献】[1]Mitsudome T,Yamamoto M,Maeno Z,et al.J.Am.Chem.Soc.,2015,137(42):13452-13455[2]Yen H,Seo Y,Kaliaguine S,et al.Angew.Chem.Int.Ed.,2012,51(48):12032-12035[3]Li Y,Luo W,Qin N,et al.Angew.Chem.Int.Ed.,2014,53(34):9035-9040[4]PENG Juan(彭娟),LI Ye(李晔),JI Peng-Yu(季鹏宇),et al.Chinese J.Inorg.Chem.(无机化学学报),2012,28(6):1251-1258[5]Bai J,Li X,Liu G,et al.Adv.Funct.Mater.,2014,24(20):3012-3020[6]Cai D P,Wang D D,Huang H,et al.J.Mater.Chem.A,2015,3(21):11430-11436[7]Florea I,Feral-Martin C,Majimel J,et al.Cryst.Growth Des.,2013,13(3):1110-1121[8]Qi G S,Yang R T,Chang R.Appl.Catal.B:Environ.,2004,51(2):93-106[9]Sayle D C,Maicaneanu S A,Watson G W.J.Am.Chem.Soc.,2002,124(38):11429-11439[10]Premkumar T,Govindarajan S,Coles A E,et al.J.Phys.Chem.B,2005,109(13):6126-6129[11]Tang C J,Zhang H L,Dong L.Catal.Sci.Technol.,2016,6(5):1248-1264[12]Qi J,Zhao K,Li G,et al.Nanoscale,2014,6(8):4072-4077[13]Wang X,Zhang Y,Song S,et al.Angew.Chem.Int.Ed.,2016,55(14):4542-4546[14]Li L,Sun B,Sun J,et mun.,2017,100:98-102[15]Ma K,Zou W,Zhang L,et al.RSC Adv.,2017,7(10):5989-5999[16]WEI Zhong-Bin(位忠斌),CUI Yu-Qian(崔育倩),GUO Pei-Zhi(郭培志),et al.ChineseJ.Inorg.Chem.(无机化学学报),2011,27(7):1399-1404[17]Ho C,Yu J C,Kwong T,et al.Chem.Mater.,2005,17(17):4514-4522[18]YUE Lin(乐琳),ZHANG Xiao-Ming(张晓鸣).Chinese J.Inorg.Chem.(无机化学学报),2008,24(5):715-722[19]Voskanyan A A,Chan K Y,Li C Y V.Chem.Mater.,2016,28(8):2768-2775[20]Fan S,Dong W,Huang X,et al.ACS Catal.,2017,7(1):243-249[21]Korpany K V,Majewski D D,Chiu C T,et ngmuir,2017,33(12):3000-3013[22]Liu W,Feng L,Zhang C,et al.J.Mater.Chem.A,2013,1(23):6942-6948[23]Zhang L,Li L,Cao Y,et al.Catal.Sci.Technol.,2015,5(4):2188-2196[24]Yao X,Zhang L,Li L,et al.Appl.Cata.B:Environ.,2014,150:315-329[25]Zhang D,Zhang L,Shi L,et al.Nanoscale,2013,5(3):1127-1136[26]Aneggi E,Wiater D,de Leitenburg C,et al.ACS Catal.,2014,4(1):172-181[27]Sayle T X T,Cantoni M,Bhatta U M,et al.Chem.Mater.,2012,24(10):1811-1821[28]Sun C W,Sun J,Xiao G L,et al.J.Phys.Chem.B,2006,110(27):13445-13452[29]Li C R,Sun Q T,Lu N P,et al.J.Cryst.Growth,2012,343(1):95-100[30]Gong J,Meng F,Yang X,et al.J.Alloys Compd.,2016,689:606-616[31]Yao X,Ma K,Zou W,et al.Chin.J.Catal.,2017,38(1):146-159。
Hydrothermal route to single crystalline a -MoO 3nanobelts andhierarchical structuresShutao Wang,Yange Zhang,Xuchu Ma,Weizhi Wang,Xuebing Li,Zude Zhang *,Yitai QianDepartment of Chemistry,University of Science and Technology of China,Hefei,Anhui 230026,People’s Republic of ChinaReceived 15December 2004;received in revised form 24June 2005;accepted 3August 2005by J.A.BrumAvailable online 19August 2005AbstractSingle crystalline nanobelts or nanoribbons and spherical or flower like hierarchical structures of a -MoO 3were obtained through homogeneous precipitation and subsequent hydrothermal treatment.It has been found that temperature,concentration of cationic surfactant cetyltrimethylammonium bromide (CTAB),and the addition order of reactants are the three critical factors for the assembly of nanobelts in the current process.q 2005Elsevier Ltd.All rights reserved.PACS:61.66.Fn;81.10.DnKeywords:A.Nanostructures;B.Crystal growth;B.Chemical synthesis1.InstructionNanobelts or nanoribbons,of semiconducting materials particularly,have attracted considerable attentions recently as a new group of quasi one-dimensional (1D)nanostruc-tures,owing to their special characteristics,which differ from those of nanowires and nanotubes [1,2].The single crystalline nature and in particular their large aspect ratio as well as the faceting nature of these nanobelts make them ideal candidates for probing size and dimensionality dependent physical or chemical phenomena as well as for applications in nanodevices.Nanobelts of ZnO,SnO 2,In 2O 3,CdO,Ga 2O 3and PbO 2have been successfully prepared by thermal evaporation of the desired commercial metal oxide powders at high temperatures [3–6].Attempts have also been made to fabricate non-oxide or elemental nanobelts,such as GaN [7,8],Ge 3N 4[9],ZnS [10],Bi 2S 3[11],Ni [12],Se [13],Te [14,15]and et al.So far,most of the methods involve thermal evaporation and condensation or decomposition of starting powders at elevated paratively less attention has been focused on solution-based chemical route to oxide nanobelts though reactions in solution which having the advantage of better uniformity and instrumental simplicity [16,17].The present study,gained single crystal nanobelts of transition metal oxides MoO 3via solution-phase route.It is expected that other layered structures can also form this kind of belt-like morphology if the reaction conditions are properly controlled.From the bottom-up point of view in nanotech-nology,assembly of individual nanobelts as building blocks into hierarchical structure opens up opportunities for both fundamental studies and nanodevice applications.With distinctive properties of electrochromism,thermo-chromism and photochromism as smart materials,gas sensors,catalysts and host materials for intercalation,MoO 3have been extensively investigated over the past decades [18–22].MoO 3usually exist in two polymorphisms:The thermodynamically stable orthorhombic phase a -MoO3*Corresponding author.Tel.:C 865513606804;fax:C 865513601592.E-mail address:zzd@ (Z.Zhang).and the metastable monoclinic phase b-MoO3[18,22]. Reports on the synthesis of b-MoO3are scarce owing to its instability.Nanobelts of a-MoO3have been obtained through a low-temperature solution synthetic method via acidification of sodium molybdate(Na2MoO4)solution by perchlorid acid through hydrothermal treatment at140–1808C for24h[21].In this communication,we report a simple hydrothermal route to a-MoO3nanobelts through homogeneous precipi-tation method and their assembly into hierarchical structures with the assistance of cetyltrimethylammonium bromide (CTAB,[Me(CH2)15NMe3]Br).Investigations have been carried out and a possible mechanism has been proposed to clarify the role of CTAB.2.ExperimentAll the chemicals(analytical grade)were purchased from Shanghai Chemical Reagents Co.and were used without further purification.A typical synthetic procedure was as follows:0.4mmol ammonium heptamolybdate tetrahydrate(NH4)6Mo7O24$4H2O,1mmol CTAB and 10mL 2.2M HNO3were mixed with10mL distilled water in a teflon-lined stainless autoclave with the capacity of50mL.The autoclave was maintained at120or1808C for2–20h and then cooled to room temperature naturally. The resultant precipitate was collected,washed thoroughly with distilled water,absolute ethanol,and acetone,and finally dried in air at808C.For a comparison,reactions without CTAB had also been conducted with other conditions kept constant[22].Crystallographic information of the samples was investigated with X-ray powder diffraction(XRD)on a Philips X’Pert Pro Super diffractometer equipped with graphite monochromatized Cu K a radiation(l Z1.54187A˚). Diffraction data were collected over the2q range from10to 708.The morphology of the samples was examined with transmission electron microscopy(TEM),scanning electron microscopy(SEM),and high-resolution transmission elec-tron microscopy(HRTEM)using a Hitachi H-800trans-mission electron microscope,Hitachi X-650scanning electron microscope,and Jeol-2010high-resolution trans-mission electron microscope,respectively.The selected area electron diffraction(SAED)spots were recorded with the accessories equipped on TEM or HRTEM microscope. The samples used for microscopy were dispersed in absolute ethanol and were ultrasonicated before observation.3.Results and discussionFig.1shows the XRD pattern of a typical sample.All the peaks can be indexed to a-MoO3[space group:Pbnm(62), JCPDS card No.350609].The strong diffraction peaks of (020),(040)and(060)planes reveal a layered crystal structure,or a highly anisotropic growth of the oxides[22].The precipitate consist of a large quantity1D structures about7.6–11m m in length and200–900nm in width.These structures are confirmed to be nanobelts since their projected width changes accompaning the rotation around the axes,implying a reactangular cross-section instead of a round one[9].Precise determination of the nanobelts thickness is difficult here since nearly all the belts are lying parallel to the grid owing to their small thickness. Occasionally,nanowires about70–80nm in diameter and 7m m in length can be observed,but the volume ratio is well below1%.Fig.2(a)shows the image of an individual nanobelt. SAED pattern(inset of Fig.2(a))recorded perpendicular to the growth axis can be indexed to the[010]zone of a-MoO3, impling preferential growth along c-axis.HRTEM image (Fig.2(b))recorded at the edge of the same belt provides further insight into its structure.The interplanar spacing observed is about0.39and0.36nm,respectively,which corresponds to the separation between(100)and(001) lattice planes of a-MoO3.In some cases,even(200)and (002)lattice planes with interplanar spacing about0.19and 0.18nm can be clearly identified,indicating that the nanaobelt is particularly thin.The edge of the belt is rough with some steps and no amorphous layer covering the belt surface is observed.Fig.2(c)shows the tip of an individual nanowire and suggests that the wire is composed of several nanobelts. SAED pattern(inset of Fig.2(c))of the arrowed belt is indexed to the[100]zone of b-MoO3and implies preferiential growth along b-axis.However,we cannot get a clear image of the crystalline lattice owing to the thickness of these wires.And XRD measurement cannot detect b-MoO3within experimental accuracy because of its low yield(volume ratio below1%).We have tried,yet failed,to improve the outcome of the nanowires for further phase or structure characterization.In following discussions,the nanowire is treated as b-MoO3.However,to provetheformation of b-phase MoO3,which is somewhat incon-clusive currently,much convincing evidence is needed.From the above results,a structure model is schemed to show that nanobelts of a-MoO3grow along the c-axis,with G(010)top or bottom surfaces and G(100)side surfaces (Fig.2(d)).Nanobelts of possible b-MoO3grow along the [010]direction,with G(100)top or bottom surfaces,and G (001)side surfaces(Fig.2(e)).b-MoO3nanobelts will grow along their b-axis and roll up simutaneously into one solid wire with a circular cross section to minimize the interfacial surface energy[6,14].The favored[001]growth of a-MoO3is decided by its highly anisotropical structure regardless of reaction con-ditions[18,21,22].In a-MoO3,distorted MoO6octahedrons share both edges(along[001]direction)and corners(along [100]direction).The interactions between layers along b-axis are weak van der Waals forces.In contrast,the interactions along c-axis are strong covalent bonds, implying that more energy will be released if growth along[001]direction occurs.That is,growth of a-MoO3 along c-axis is favored from energy point of view.The XRD diffraction of(0k0)planes is stronger than that of other planes since the(010)plane is retained in thefinal product as the consequence of slow growing rate.b-MoO3involve corner-connected distorted octahedrons in a ReO3-type structure,where preferential growth is not favored[18,22]. The1D growth may be induced by the adsorption of CTA C cations to the(010)plane,which will accelerate the growth by changing the degree of supersaturation round the side surfaces[9,17,23].Assembly of the above1D structures as building blocks into hierarchical structures has been realized with the assistance of cationic surfactant CTAB.Experiments have showed that cationic CTAB influence the assembly process dramatically while anionic sodium lauryl sulfate(SDS, C12H25OSO3Na)do not.Deren Yang et al.have reported CTAB assisted hydrothermal route toflowerlike ZnO nanostructures where both temperature and the presence of CTAB are the key parameters[24].It is interesting that in the present condition,the addition order of reactants is also critical for the assembly of nanobelts.Spherical orflower-like hierarchical structures with nanobelts as building blocks are created when HNO3isfirstly added(Fig.3(a)–(c)).As a contrast,belt-like morphology is reserved when CTAB is firstly added(Fig.3(d)).It is noted that the width becomes larger and length shorter comparing to those of the nanobelts produced without the assistance of CTAB.Fig.3(c)shows an interesting sphere with several nanobelt protrusions,the state of which can be easily related to the transitionfrom Fig.2.Images of MoO3prepared at1808C for20h,CTAB isfirstlyadded,(a)an individual nanobelt and corresponding SAED pattern (inset of(a));(b)HRTEM image on the edge of the same nanobelt;(c)tip of an individual nanowire with SAED pattern(inset of(c))of the arrowed composing nanobelt;structure model of(d)a-MoO3, (e)b-MoO3nanobelt with different growthdirections.Fig.3.Images of a-MoO3prepared at1208C for20h,((a)–(c))HNO3isfirstly added;(d)CTAB isfirstly added.S.Wang et al./Solid State Communications136(2005)283–287285spherical toflowerlike morphology.It is proposed that these hierarchical structures are assembled with the help of CTAB,which will be verified by following discussions about the results of IR and TGA.It is noted that the transitional spheres coexisted with the hierarchicalflowers in the same batch of samples.That is,‘secondary assembly’may occur during the formation process of hierarchical structures,similar to the case of secondary nucleation in the crystallization process.Therefore,selective control for the formation of particular transitional morphology cannot be realized.When the temperature is raised to1808C,there are also nanobelts formed,though cannot be assembled into larger hierarchical structures(Fig.4).This temperature effect is similar to the result reported in literature[24].But the addition order of CTAB also has a significant influence on the oxide morphology.MoO3remain nanobelts when CTAB isfirstly added.Flakes,instead of spheres orflowers,appear when HNO3is addedfirstly.The IR spectra show the presence of CTAB for samples prepared at1208C,while no signals of CTAB are detected for samples prepared at1808C.The result of thermal analysis is consistent with that of IR.According to TGA curves,the total weight loss is14.49or29.10%for samples prepared at1208C with CTAB or HNO3firstly added, respectively,implying more CTAB are involved in the hierarchical structures.For samples obtained at1808C,no weight loss will happen until the oxides begin to sublimate, the possibility of CTAB incorporation being totally excluded.While0.4655g(0.4mmol)(NH4)6Mo7O24$4H2O leads to the formation of0.4030g MoO3theoretically, 0.5803g solid product was obtained practically for samples prepared with HNO3firstly added at1208C.The effective productivity was calculated to be144%according to the mass ratio of MoO3obtained practically to those obtained theoretically.This value proves the incorporation of CTAB in the hierarchical structures,although slightly greater than the value from TGA analysis(129.10%).Adsorption of water in air and weighing accuracy may account for the deviation from the TGA result.Nearly O90%samples possess the hierarchicalflower morphology in thefield of vision at TEM observation.Therefore,this method for the assembly of smaller belts into larger structures is highly active.A possible mechanism is proposed for the above observations.As is shown in Scheme1(a),oxide nuclei formfirstly when HNO3is added at1208C.The inclination to reduce the oxide surface energy and the electrostatic forces between the nuclei and CTAB make for the adsorption of CTAB via theC N(CH3)3(C16H33)headgroup. It is proposed that CTAB adsorbed on the capped oxide nuclei tend to form a bilayer structure with adjacent neighbors via hydrophobic cetyl tails,which will then connect tightly to form spherical cores.When the reaction time is long enough,each nuclei will grow into nanobelts and beautifulflowers are in full bloom.There is a strong tendency to form stable micelles since the concentration of CTAB(0.05M)is well above its critical micelle concentration(cmc)[25].Micelles of CTAB have already generated when HNO3is added following the addition of CTAB(Scheme1(b)).The strong interactions between H C and Mo7O6K24will suppress the attraction of Mo7O6K24by CTA C when HNO3is introduced.The adsorption between CTAB micelles and NO K3instead of the oxide nuclei will be favored in this stage.With the proceeding of reaction, individual nanobelt will grows by its nature.When the reaction is carried out at1808C(Scheme1(c)), adsorption of CTAB on to the oxide nuclei is disadvanta-geous,owning to the exothermic nature of this process. CTA C will form iron pairs with Mo7O6K24or[(MoO3)7 (OH)3]3K instead of forming micelles since the micelles will be destroyed at high temperature[24].Therefore,it is expected the growth of nanobelts will not be influenced much by CTAB in this case.Scheme1(d)shows that when HNO3isfirstly added,instead of forming assemblies of nuclei[26],CTAB will be adsorbed preferentially onto the {010}planes of MoO3and hinder the growth along[010] direction kinetically to formflakes.Fig.4.Images of a-MoO3prepared at1808C for20h,(a)CTAB isfirstly added;(b)HNO3isfirstlyadded.Scheme1.Possible mechanism for the formation of hierarchicalassembly of a-MoO3nanobelts.S.Wang et al./Solid State Communications136(2005)283–2872864.ConclusionsNanobelts of single-crystal a-MoO3,up to11m m in length and50–900nm in width,have been prepared by a hydrothermal process with neither catalyst nor template. The nanobelt will act as template for molybdenum-based sulfides,nitrides,carbides,et al.,with1D morphology.In the case of morphology control,assembly of the nanobelts into spherical orflowerlike hierarchical structures has been realized with the assistance of CTAB.The role of CTAB cationic surfactant has been investigated thoroughly and a possible mechanism is proposed.More detailed study is needed to certify the formation of b-MoO3. AcknowledgementsWe thank the National Natural Science Foundation of China forfinancial support of this research.Supporting informationSupplementary data associated with this article can be found at doi:10.1016/j.ssc.2005.08.002References[1]w, D.J.Sirbuly,J.C.Johnson,J.Goldberger,R.J.Saykally,P.Yang,Science305(2004)1269.[2]Y.B.Li,Y.Bando,D.Golberg,K.Kurashima,Appl.Phys.Lett.81(2002)5048.[3]Z.L.Wang,Annu.Rev.Phys.Chem.55(2004)159.[4]Z.W.Pan,Z.R.Dai,Z.L.Wang,Appl.Phys.Lett.80(2002)309.[5]w,H.Kind,B.Messer,F.Kim,P.Yang,Angew.Chem.Int.Ed.41(2002)2405.[6]X.Y.Kong,Z.L.Wang,Nano Lett.3(2003)1625.[7]S.Y.Bae,H.W.Seo,J.Park,H.Yang,J.C.Park,S.Y.Lee,Appl.Phys.Lett.81(2002)126.[8]J.Y.Li,Z.Y.Qiao,X.L.Chen,Y.G.Cao,M.He,J.Phys.:Condens.Matter13(2001)L285.[9]Y.H.Gao,Y.Bando,T.Sato,Appl.Phys.Lett.79(2001)4565.[10]C.Ma,D.Moore,J.Li,Z.L.Wang,Adv.Mater.15(2003)228.[11]Z.P.Liu,S.Peng,Q.Xie,Z.K.Hu,Y.Yang,S.Y.Zhang,Y.T.Qian,Adv.Mater.15(2003)936.[12]Z.P.Liu,S.Li,Y.Yang,S.Peng,Z.K.Hu,Y.T.Qian,Adv.Mater.15(2003)1946.[13]X.B.Cao,Y.Xie,S.Y.Zhang,F.Q.Li,Adv.Mater.16(2004)649.[14]M.S.Mo,J.H.Zeng,X.M.Liu,W.C.Yu,S.Y.Zhang,Y.T.Qian,Adv.Mater.14(2002)1658.[15]U.K.Gautam,C.N.R.Rao,J.Mater.Chem.14(2004)2530.[16]L.Zhang,J.C.Yu,A.W.Xu,Q.Li,K.W.Kwong,L.Wu,mun.23(2003)2910.[17]J.W.Wang,Y.D.Li,mun.18(2003)2320.[18]L.Seguin,M.Figlarz,R.Cavagnat,sse`gues,Spectro-chimi.Acta,Part A51(1995)1323.[19]X.W.Lou,H.C.Zeng,J.Am.Chem.Soc.125(2003)2697.[20]J.Zhou,N.S.Xu,S.Z.Deng,J.Chen,J.C.She,Z.L.Wang,Adv.Mater.15(2003)1835.[21]X.L.Li,J.F.Liu,Y.D.Li,Appl.Phys.Lett.81(2002)4832.[22]X.W.Lou,H.C.Zeng,Chem.Mater.14(2002)4781.[23]Y.Liu,D.Hou,G.Wang,Chem.Phys.Lett.379(2003)67.[24]H.Zhang,D.R.Yang,Y.J.Ji,X.Y.Ma,J.Xu,D.L.Que,J.Phys.Chem.B108(2004)3955.[25]M.L.Tobe,J.Burgess,Inorganic Reaction Mechanisms,Longman,England,1999.[26]X.M.Sun,X.Chen,Z.X.Deng,Y.D.Li,Mater.Chem.Phys.78(2002)99.S.Wang et al./Solid State Communications136(2005)283–287287。