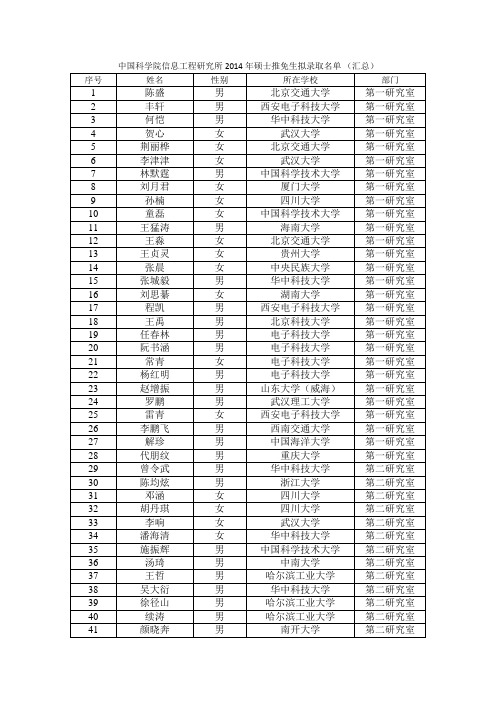
2014西南交通大学信科学院复试上机真题
- 格式:doc
- 大小:21.50 KB
- 文档页数:2


西南交通大学2013-2014学年第(一)学期考试试卷(期中)课程代码 2023500 课程名称 机械原理 考试时间 120分钟(开卷)阅卷教师签字:一、(18分)题一图所示机构,图示比例为mm m l /005.0=μ。
构件1为圆心为A 、内径为、外径为圆环;构件2为半径为的短圆柱,嵌入构件1上;在构件2上开有一个槽,构件3嵌入其中,C 为固定铰链。
构件1为原动件。
试: 1. 画出机构的运动简图; 2. 写出机构的邻接矩阵;3. 判断构件3能否绕点C 转动360°。
二、 (18分)题二图所示为一个机构的示意图。
移动副E 、E ’的导路相互平行,点F 的轨迹是以点D 为圆心、半径为R 的圆弧,并且已知R=BG ,DG=BF ,平行于轴。
1.计算机构的自由度。
若有复合铰链、局部自由度和虚约束,请予以指出; 2.画出机构的低副运动等效机构; 3.如果已知。
试确定连杆2与水平方题一图 题二图班 级 学 号 姓 名密封装订线 密封装订线 密封装订线向线之间夹角的最大值和最小值。
题三图题四图三、(16分)题三图所示为一个连杆机构的示意图。
已知油缸的运动规律H ,v H ,a H ,以及固定铰链点A 、D 、F 的坐标、构件杆长BD 、CD 、CE ;。
1.拆出机构中所包含的基本杆组,并判断机构的级别;2.现要求构件5的角运动。
试按照求解顺序,写出求解构件5的角位置的方程,并简要说明如何求解构件5的角速度和角加速度;3.试确定机构在图示位置时,构件1与构件3的速度瞬心。
四、 (16分)题四图为一个连杆机构的示意图。
已知,,构件1为原动件, 并且等速转动。
自选作图比例,试①画出以下两种情况下滑块5的极限位置;②标出机构的极位夹角;③确定出滑块的行程H ;④确定出机构的行程速比系数。
1、 当时; 2、 当时。
五、 (18分)题五图所示为一个两自由度机构设计的示意图。
设计的主要目的是实现工件的三个位置:,,(图中未标出),,。

西南交通大学信息科学与技术学院2014年计算机/软件工程/信息安全硕士研究生入学考试840 数据结构与程序设计/ 959 数据结构之(免费资料,请勿掏钱购买!谁掏钱,我跟谁急)Powered by 未休矣试题代码: 959 试题名称:数据结构机密★启用前西南交通大学2012年全日制硕士研究生入学考试试卷试题代码:959试题名称:数据结构考试时间:2012年1月考生请注意:1.本试题共4题,共6页,满分150分,请认真检查;2.答题时,直接将答题内容写在考场提供的答题纸尚,答在试卷上的内容无效;3.请在答题纸上按要求填写试题代码和试题名称;4.试卷不得拆开,否则遗失后果自负。
一、单项选择题(本大题共25题,每题2分,共50分)1.以下属于数据的逻辑结构的是【】A.顺序表 B.哈希表 C.线性表 D.单链表2.计算机所处理的数据一般具有某种内在联系,这是指【】A.数据与数据之间存在某种关系B.数据元素与数据元素之间存在某种关系C.元素内部存在某种结构D.数据项与数据项之间存在某种关系3.线性表是具有n个【】的有限序列(n≥0)。
A.表元素B.字符C.数据元素D.数据项4.若某线性表最常用的操作是存取任意指定序号的元素和在表尾进行插入和删除,则选用【】的存储方式最节省时间。
A.顺序表B.双链表C.带头结点的双循环链表D.单循环链表5.若长度为n的线性表采用顺序存储结构,在第i个位置插入一个新元素的算法的时间复杂度为【】。
A.O(0)B. O(1)C. O(n)D. O()6.如果对线性表的运算只有两种,即删除第一个数据元素,在最后一个数据元素的后面插入一个新数据元素,则最好使用【】A.只有表头指针没有表尾指针的单循环链表B.只有表尾指针没有表头指针的单循环链表C.非循环双链表D.顺序表7.对于一个线性表,既要求能够较快速地进行插入和删除,又要求存储结构能反映数据元素之间的逻辑关系,则应该采用【】A.顺序存储方式B.链式存储方式C.随机存储方式D.以上均可以8.用单链表表示的链队列的链表指针在链表的【】A.链头B.链尾C.链中D.都不是9.对于循环队列【】A.无法判断队列是否为空B.无法判断队列是否为满C.队列不可能为满D.以上说法都不对10.一个栈的进栈序列为A、B、C、D、E,则栈的不可能的输出序列是【】A.EDCBAB.DECBAC.DCEABD.ABCDE11.循环队列的最大容量为M,则队空的条件是【】A.rear==frontB.(rear+1)%M==frontC.rear+1==frontD.(rear-1)%M==front12.【】是C语言中串“abcd321ABCD”的子串。
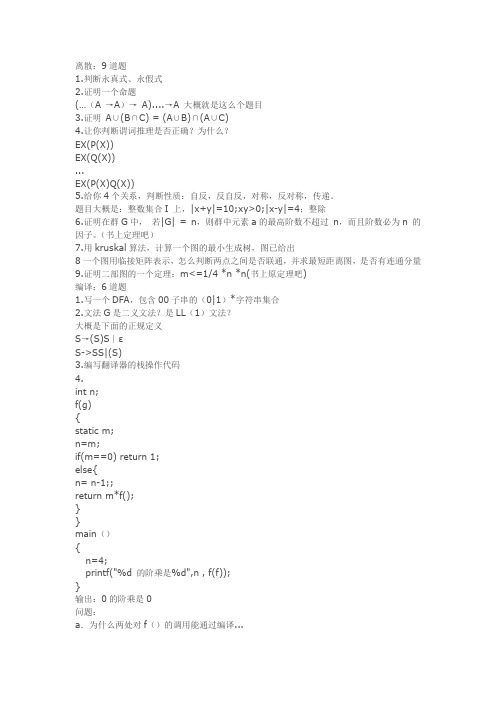
离散:9道题1.判断永真式、永假式2.证明一个命题(…(A →A)→A)....→A 大概就是这么个题目3.证明A∪(B∩C) = (A∪B)∩(A∪C)4.让你判断谓词推理是否正确?为什么?EX(P(X))EX(Q(X))...EX(P(X)Q(X))5.给你4个关系,判断性质:自反,反自反,对称,反对称,传递。
题目大概是:整数集合I 上,|x+y|=10;xy>0;|x-y|=4;整除6.证明在群G中,若|G| = n,则群中元素a的最高阶数不超过n,而且阶数必为n 的因子。
(书上定理吧)7.用kruskal算法,计算一个图的最小生成树,图已给出8一个图用临接矩阵表示,怎么判断两点之间是否联通,并求最短距离图,是否有连通分量9.证明二部图的一个定理:m<=1/4 *n *n(书上原定理吧)编译:6道题1.写一个DFA,包含00子串的(0|1)*字符串集合2.文法G是二义文法?是LL(1)文法?大概是下面的正规定义S→(S)S∣εS->SS|(S)3.编写翻译器的栈操作代码4.int n;f(g){static m;n=m;if(m==0) return 1;else{n= n-1;;return m*f();}}main(){n=4;printf("%d 的阶乘是%d",n , f(f));}输出:0的阶乘是0问题:a.为什么两处对f()的调用能通过编译...b.为什么是输出:0的阶乘是0,而不是4的阶乘245.int i,j,n;char c;n= &i - &j;c = &i - &j;大概就是这么个程序...就是两个指针相减,问你指针相减的结果,并说明为什么。
6.int f()….main(){printf("%d",fx());}在编译运行时出现两个问题:****.cwarning:ambiguous reference printf****.oerror:undecleared reference fx问第一个警告是编译错误还是链接错误?下一个是编译错误还是链接错误?由于没有把所有的知识点完全覆盖,离散就那两个书上定理没搞定,编译那个栈代码没写,其它的基本都会儿写,应该也基本写对了~************************************************************** *****************************************1.写一个myrand(int a,int b)函数,输出100个1和10000之间的随机数,并统计1-1000,1001-2000.。

一、前言10年我毕业之后在中铁干了几年,后来实在受不了这到处流动的工作,再加上我父母身体不好需要我就近工作照顾,于是我就辞职回来。
又发现自己很难找到像样的工作,于是决定破釜沉舟考研。
经过半年多的努力,我顺利的考上了,接下来我把我的经验教训告诉给15考研的学弟学妹们,希望你们能够从我身上学到一些东西(虽然我这人水平也不咋地)。
二、初试篇1、政治:这门课说实话本人水平很挫,说白了就是缺乏政治觉悟。
政治这门学科这几年来越考越活,只要是看你的功底如何,就算你把红宝书上面的知识点背得再滚瓜烂熟,真正做起考题,你还是会发现一片茫然。
但是话说回来,如果你连红宝书上面的知识点都记不住,那到了考试的时候你肯定会跪。
至于有人说的什么“我裸考但是运气好还是考了60+”这样的话建议你们一定不要学,运气这个东西根本就靠不住,求人不如求己。
2、英语:英语说白了就是单词记得多,但是记单词不是要你一天到晚背着大纲单词,这样根本记不住。
英语单词需要你在阅读文章中去理解记忆,只有理解了才记得住。
所以大家需要做的事情很简单,但是很多人做不到——那就是每天坚持做一两篇阅读。
最开始可以只做一篇,后面熟了就可以做两篇了。
做完了在好好看看自己哪些单词不会,不会的单词结合文章去记忆。
这样既使得自己记住了单词,又增强了自己的阅读能力。
这个每天就花的了一两个小时,可很多人就是三天打鱼两天晒网不能坚持。
3、数学:这是最拉分的一门课,成也数学败也数学这句话一点也不夸张。
数学这门课就是先把李永乐那本复习全书好好过一遍,起码要把那些最基础的定理原理搞清楚。
然后就是题海战术了,不要局限于真题,模拟题也要尽可能的多做。
但是做题也不要无脑的去做,你必须要从做题的过程中发现自己哪个知识点不足,这样才能有的放矢的强化自己。
温馨提示:随着近年来报考四川的考生越来越多,数学判卷也越来越严格,一道题结果错了就是零分。
所以大家做计算题的时候尽量做到又快又好,争取一步算对,不要指望能检查出错误。
2014年西南交通大学考研回忆录我是2014年1月参加全国考研的学子之一,我报考的是西南交通大学的信息科学与技术学院的电子与通信工程(专业硕士学位),下面,我讲解我初试经历和复试经历,包括初试复习的情况和复试准备情况(包括如何选导师)。
我从2013年8月初开始准备考研,之前已经了解过考研的科目和内容。
为什么我从8月才开始复习,因为2013年7月19号才结束第8届全国大学生“飞思卡尔”杯智能车竞赛。
我的本科是江苏省的一所普通本科学校,8月份这一个月,我基本每天都是复习数学和英语,其中英语是我最重要的一部分。
因为我的英语基础不好,数学基础还行,还获得过数学竞赛二等奖。
到了9月份,我数学复习一遍结束开始做张宇的1000题,此时我还没买复习全书,英语按照英语一的难度来复习,这一个月背完一遍单词,黄皮书真题的阅读都做完并且精度了。
进入9月份,继续复习英语和数学,到10月份,开始买了专业课资料,真正复习专业课到11月份。
政治也是11月下旬开始复习的,主要就是肖秀荣的背诵版那本书和4套卷。
数学真题做了三遍,15年真题。
模拟题做的张宇版的《命题人8套卷》。
初试复习基本就是这样,真题和模拟题都要做,但是真题是重点!1月份考完试,2月17号晚公布成绩了。
今年的国家线比往年都早,今年是3月18号公布的,每个学院复试时间都不太一样,我们信息院在4月5号到7号(正好清明那几天)复试。
我4月1号中午坐上无锡了开往成都的火车(K1156次)。
4月2号下午到达成都,然后到酒店和其他研友汇合。
我们住在交大西门的凯优威尔酒店,团购118一天的标间(没有早饭,单独买10元一份),周末是140一天(提供早饭了),酒店环境还不错,就是有个服务员服务不咋的。
反正比南门的QQ酒店好多了。
4月3号早上10点30见导师(邓平教授),在14楼,当时他告诉我们到01401见他,其中给大家普及一下,开头的0代表信息院的楼是#0楼的意思,逸夫馆就是4开头,14就是楼层,最后的01就是房间编号。
西南交通大学2014-2015学年第(1)学期考试试卷课程代码 3122400 课程名称 信号与系统 A 考试时间 120分钟阅卷教师签字: 一、选择题:(20分)本题共10个小题,每题回答正确得2分,否则得零分。
每小题所给答案中只有一个是正确的。
1.积分⎰∞∞-dt t t f )()2(δ的结果为( A )A. )0(fB.)2(t fC.)()2(t t f δD.)()0(t f δ 2.信号)35(t f -是( D ) A .)3(t f 右移 5 B . )3(t f 左移35C .)3(t f -左移 5D .)3(t f - 右移353.一个因果稳定的LTI 系统的响应可分为瞬态响应与稳态响应两部分,其稳态响应的形式完 全取决于( B ) A.系统的特性 B.系统的激励 C.系统的初始状态D.以上三者的综合4.理想低通滤波器一定是( B )A .稳定的物理可实现系统 B.稳定的物理不可实现系统 C .不稳定的物理可实现系统 D.不稳定的物理不可实现系统 5.∑∞-∞=-=n n t t f )4()(δ周期信号的傅立叶变换为( A )A.∑∞-∞=-n n )2(2πωδπB. 2()n n πδωπ∞=-∞-∑C. ∑∞-∞=-n n )2(πωδπ D. 0.5∑∞-∞=-n n )(πωδπ班 级 学 号 姓 名密封装订线 密封装订线 密封装订线6.已知Z 变换Z 1311)]([--=z n x ,收敛域3>z ,则逆变换x (n )为(A )A .)(3n u n B. )(3n u n -- C.)(3n u n -- D.)1(3---n u n7.假设信号)(1t f 的奈奎斯特取样频率为1ω ,)(2t f 的奈奎斯特取样频率为,2ω且1ω>,2ω则信号)2()1()(21+*+=t f t f t f 的奈奎斯特取样频率为( B )(A )1ω (B )2ω (C )1ω+2ω (D )1ω*2ω 8.连续时间信号)(t f 的拉氏变换的收敛域是( A )A .带状 B.环状 C.与σ无关 D.与ω变量有关9.单边拉氏变换2)()2(+=+-s e s F s 的原函数=)(t f ( C )A .)1(e )1(2---t u t B. )2(e )2(2---t u t C .)1(e 2--t u t D. )2(e 2--t u t 10.系统的零点都在左半平面,则该系统一定是( D )A .全通网络 B.低通滤波网络 C.非最小相移网络 D.最小相移网络二、(10分)已知)5(t f -的波形如图所示,试画出)42(+t f 的波形。
西南交通大学研究生2013-2014学年第(1)学期考试试卷课程代码 082302B202a 课程名称 可靠性理论 考试时间 分钟阅卷教师签字:考核内容:该课程主要讲授有关可靠性理论与技术,需要学生熟练掌握相关可靠性计算与分析技术。
学生需要通过可靠性计算和分析软件上机实践,才能证明已掌握课堂学习的知识,从而达到分析问题、解决问题、理论与实践相结合的学习目的,拟不进行试卷考试,而采用上机实践考试,研究生要根据下面的10个题目进行计算、分析,撰写相应报告(分析图,计算过程,分析结果)。
根据报告质量评分作为本课程成绩。
院 系 学 号 姓 名密封装订线 密封装订线 密封装订线Practice Question 1 (8 points)Six units were reliability tested and the following times-to-failure were observed: 48, 64, 83, 105, 123 and 150 hr.Do the following:1.Determine how you would classify this data set, i.e. individual, grouped, suspended,censored, uncensored, etc.2.Create a new project and Standard Folio for individual times-to-failure data with nod “Question1.”3.Enter the data and select Rank Regression on X as the parameter estimation method.4.Determine the parameters for this data set using the following distributions and plot thedata for each distribution. From the plot, note how well you think each distribution tracks the data, i.e.how well does the fitted line track the plotted points?i. 2-parameter Weibullii. 3-parameter Weibulliii. Normaliv. Lognormalv. 1-parameter Exponentialvi. 2-parameter Exponentiale the Distribution Wizard to determine the distribution that best fits your data. Comparewith what you have observed.6.Obtain a probability plot with 90% 2-sided confidence bounds and a pdf plot.Practice Question 2 (8 points)ACME manufacturing implemented a reliability tracking program for a recent product. A total of 96 units were released in a small test market. 10 units failed sometime between 0 - 68 hr, 10 units failed between 68 -90 hr, 10 units failed between 90 - 120 hr and 7 failed between 120 - 130 hr. 59 units were still in the field after successfully operating for 153 hr.Do the following:1.Create a new Standard Folio for grouped times-to-failure data with suspensions andinterval censoring. named “Quest ion2.”1.Enter the data and determine the parameters of the 2-parameter Weibull distribution usingRank Regression on X.2.Obtain the probability plot for this data set.3.Plot the 90%, 2-sided confidence bounds (Type II). Export the plot graphic asMyPlot1.wmf.4.Experiment with annotating the plot while in RS Draw.5.From the plot, determine:i. The reliability of these units for a mission of 50 hr, R(50hr).ii. The 90%, 2-sided confidence bounds on the reliability for a mission of 50 hr (Type II).iii. The mission duration for these units if ACME Inc. requires a 90% reliability at the 50% confidence level.iv. The mission range if ACME Inc. requires a 90% reliability at the 90% confidence level (Type I).ing the Quick Calculation Pad, determine:i. The reliability of these units for a mission of 50 hr, R(50hr).ii. The 90%, 2-sided confidence bounds on the reliability for a mission of 50 hr.iii. The mission duration for these units if ACME Inc. requires a 90% reliability at the 50% confidence level.iv. The mission range if ACME Inc. requires a 90% reliability at the 90% confidence level.v. The 2-sided confidence bounds on the parameters.7.Obtain the Reliability vs. Time plot for these units.8.Obtain the pdf plot for these units.9.Obtain the Failure Rate vs. Time plot for these units. From the plot, what is the failure rateof these units at 100 hr?Practice Question 3 (8 points)1.Create a new Standard Folio for individual times-to-failure data with no d“Question3.”2.Rename the data sheet to “MLE” then copy and paste the data from “Question1.” Use the2-parameter Weibull distribution and Maximum Likelihood Estimation to calculate the parameters.3.Insert a new data sheet named “RRX” and paste the data set into the new sheet. Use the2-parameter Weibull distribution and Rank Regression on X to calculate the parameters.4.Plot both data sets individually.5.Customize both plots to your liking.6.Add a Multiple Plot Sheet to the project (named “Question3”) and select both data sets tobe displayed. (Note that both are made up of the same data. Do you see a difference?Why?)7.Save your changes to the project and close the Folios and Multiple Plot Sheet.Practice Question 4 (8 points)ACME Manufacturing is preparing to purchase a new component for one of its products. Two competing manufacturers presented ACME with the following test data. Each manufacturer tested 8 units to failure with the following results:1.Create a new Standard Folio for individual times-to-failure data with no censoring. named“Quest ion4.”2.Enter the data for each manufacturer into separate data sheets (named “A” and “B”) anddetermine the parameters of the 2-parameter Weibull distribution using Rank Regression on X.e the Tests of Comparison utility to calculate the probability that Manufacturer A isbetter than Manufacturer B. Which design would you choose?4.Save your changes to the project, close the Comparison Wizard and close the Folio.Practice Question 5 (10 points)As you may have noticed, plotting the data points and seeing how well the line runs through the points is an indication of how well the calculated parameters fit the data (or how correct the calculation is). However, when you use Maximum Likelihood Estimation, the data points do not, in general, track the plotted line. The reasons lie in the way the parameters are estimated. One way to view this convergence, since MLE maximizes the Likelihood Function, is to view the 3D plot of the Log-Likelihood Function. Weibull++ lets you do just that.1.Duplicate the “Question1” Folio and name the copy “Question5.”2.Calculate the parameters using the 2-parameter Weibull distribution and MLE as theparameter estimation method.3.Plot the Log-Likelihood Function using 3D Plot.4.Press Ctrl and click the plot. Move the mouse simultaneously in the direction you wouldlike to rotate the plot.5.Rotate the plot and view the maximum beta.6.Rotate the plot again and view the maximum eta.7.Close 3D Plot and insert a General Spreadsheet into the Folio.e the Function Wizard to create a table of Reliabilities with 90% 2-sided confidencebounds for a time range of 10 to 100, incremented by 5. Note: To get the 2-sided bounds, create one function for the CL at .05 (lower bound) and a second function for the CL at .95 (upper bound).9. Save your changes to the project and close the Folio.Practice Question 6 (8 points)The Monte Carlo Data generation is a useful tool when dealing with simulations. You can use it to generate values for any distribution or function. This example will take you through such a scenario.1.Create a new Standard Folio for times-to-failure data with no censoring, named“Question6.”2.Select Generate Monte Carlo Data... from the Tools menu or click the icon.3.Generate a data set using the 2-parameter Weibull distribution with beta = 2 and eta = 1500hr. Select to put the data points into the current Folio and Sheet.4.Calculate the parameters.5.Are the parameters equal to the ones used in the Monte Carlo tool? Comments?6.Generate another Monte Carlo data set using the same distribution and parameters. Selectto put the data points into the current Folio and a new Sheet.pare the two sets. Are they the same?8.Save your changes to the project and close the Folio.Practice Question 7 (10 points)Your new manager has to be convinced that product X has an MTBF of 1000 hr with a 95% confidence level. You know from past experience that the shape parameter for this product is 1.5. Due to time constraints, you are allowed to test the units for no more than 500 hr. Using ReliaSoft's Design of Reliability Tests (DRT) utility, find the number of units that have to be tested if:1. No failures are allowed.2. One failure is allowed.3. Experiment with the other cases using the DRT.Practice Question 8 (10 points)The next table presents a data set corresponding to the times-to-failure for two samples of the same product, samples A and B. Both samples are assumed to be identical, so thetimes-to-failure were entered together in the same data sheet, utilizing the Subset ID column to identify each sample.Using the Batch Auto Run feature, extract two different data sets. Do the following:1.Create a new Standard Folio for times-to-failure data with no censoring, named“Question8.”2.Calculate the parameters for each data set using the 2-parameter Weibull distribution withRank Regression on X.pare the two sets using the Tests of Comparison utility.4.Create a Multiple Plot Sheet (named “Question8”) and plot the two data sets together.5.Save your changes to the project and close the Folio.Practice Question 9 (10 points)For this example, design a test to demonstrate a reliability of 90% at t = 100 hr, with a 95% confidence. Assume a Weibull distribution with a shape parameter beta = 1.5. No failures will be allowed on this test, or f = 0.Using the DRT (Design of Reliability Testing) utility, determine the following:1. The number of units to test for 48 hr (in integers).2. The test time for 20 units.Practice Question 10 (10 points)A subsystem of a machine is composed of a Ball-Bearing subsystem and a Shaft, as shown below:The inspection times (in hours) for the Ball-Bearing subsystem are given in the table below.The life data set for the Shaft is given in the table below.1. Using the 2-parameter Weibull distribution with RRX for the Ball-Bearing data and the lognormal distribution with RRX for the Shaft data, estimate the reliability of the system at 1,000 hrs.2. What is the reliability of each component at 1,000 hrs?Practice Question 11 (10 points)Consider the following circuit bridge system:All components are identical, following an exponential life distribution with = 8.126E-4 failures/ day.1. Create a Template with the blocks you need to create the RBD and customize the Template blocks to your liking.2. Create the reliability block diagram for this system.3. Estimate the reliability at 200 days using the Analytical QCP.4. Create the Reliability vs. Time plot.5. Rename the Diagram Sheet to “Bridge System.”6. Save your project as Quest11.rbp and leave it open..。
编写一个程序,从键盘输入含有n个实数的一维数组,求此一维数组的平均值,结果保留两位小数,其中n为int型,数组为double型。
标准输入:
5 1.1 2.2 3.3 4.4 5.5
标准输出:
3.30
删除一个字符串(不包含空格)中指定下标的字符。
样例输入中,第一行的整数n表示输入数据的组数,从第二行开始,每两行为一组,共n组,其中每组数据的前一行为字符串,后一行为要删除的字符的下标。
标准输入:
2ab*cdefg5ABCDEFG3
标准输出:
ab*cdfg ABCEFG
编写一个程序,从键盘输入一个字符串,输出字符串中指定字符的个数。
例如,若输入字符串: a12341213b2,输入字符为: 1,则输出:3。
标准输入:
aa2254346722
标准输出:
3
#include<stdio.h>
#include<string.h>
int main()
{
int i,j,count=0;char b[90],n;
gets(b);
scanf("%c",&n);
j=strlen(b);
for(i=0;i<j;i++)
if(b[i]==n)count++;
printf("%d",count);
return 0;
}
第2题:
编写一个程序,从键盘输入若干个数放入整数数组中(不超过50个),用0结束输入并放在最后一个元素中,计算数组元素中值为负数的平均值(不包括0)。
结果保留四位小数。
例如:数组中元素的值依次为43,-47,-21,53,-8,12,0,则程序的运行结果为-25.3333。
标准输入:
3 -3 -
4 -
5 3
6
7 0标准输出:
-4.0000。