雅思写作小作文练习_翻译
- 格式:doc
- 大小:56.50 KB
- 文档页数:4
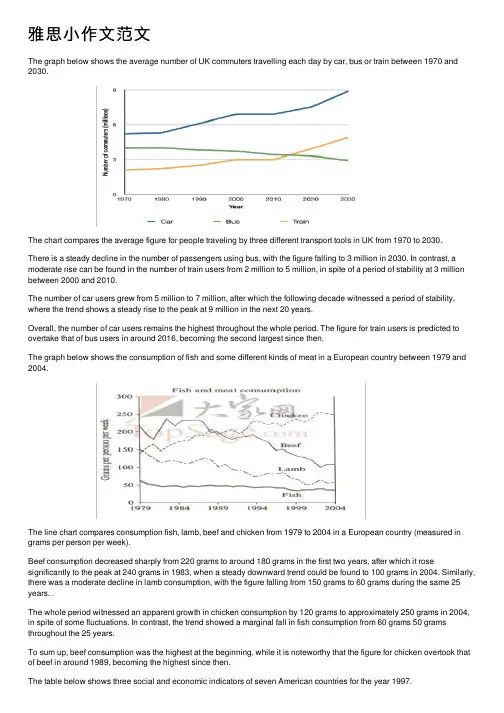
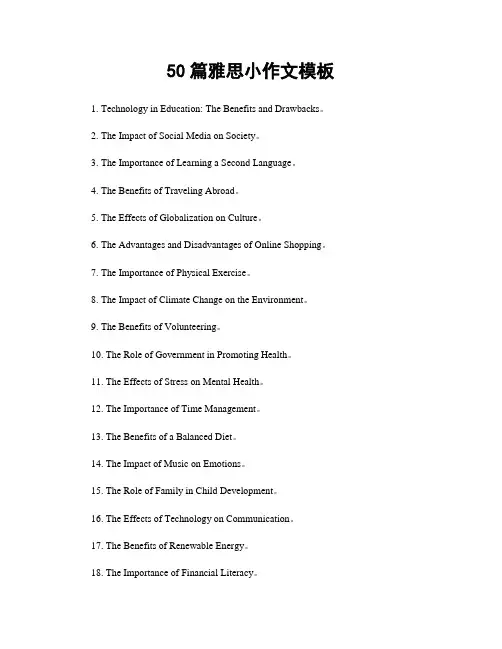
雅思⼩作⽂范⽂The graph below shows the average number of UK commuters travelling each day by car, bus or train between 1970 and 2030.The chart compares the average figure for people traveling by three different transport tools in UK from 1970 to 2030.There is a steady decline in the number of passengers using bus, with the figure falling to 3 million in 2030. In contrast, a moderate rise can be found in the number of train users from 2 million to 5 million, in spite of a period of stability at 3 million between 2000 and 2010.The number of car users grew from 5 million to 7 million, after which the following decade witnessed a period of stability, where the trend shows a steady rise to the peak at 9 million in the next 20 years.Overall, the number of car users remains the highest throughout the whole period. The figure for train users is predicted to overtake that of bus users in around 2016, becoming the second largest since then.The graph below shows the consumption of fish and some different kinds of meat in a European country between 1979 and 2004.The line chart compares consumption fish, lamb, beef and chicken from 1979 to 2004 in a European country (measured in grams per person per week).Beef consumption decreased sharply from 220 grams to around 180 grams in the first two years, after which it rose significantly to the peak at 240 grams in 1983, when a steady downward trend could be found to 100 grams in 2004. Similarly, there was a moderate decline in lamb consumption, with the figure falling from 150 grams to 60 grams during the same 25 years. .The whole period witnessed an apparent growth in chicken consumption by 120 grams to approximately 250 grams in 2004, in spite of some fluctuations. In contrast, the trend showed a marginal fall in fish consumption from 60 grams 50 grams throughout the 25 years.To sum up, beef consumption was the highest at the beginning, while it is noteworthy that the figure for chicken overtook that of beef in around 1989, becoming the highest since then.The table below shows three social and economic indicators of seven American countries for the year 1997.The table compares three indicators in terms of GDP per capita, adult illiteracy rate and newspaper sales per 1000 people in several American countries in 1997.GDP per capita in the Bahamas was the highest at $13,000, followed by that in Argentina ($9,100 ). Furthermore, there were five other countries whose figures were below $5000.In the case of the second item, Brazil had the highest adult illiteracy rate at 16.8%, in comparison with only 3.6% in Argentina. It is noteworthy that figures for the Bahamas and Cuba were the same: 4.4%. The proportion of illiterate people in Jamaica was 15.2%, nearly twice that of Surinam (7%).In the last category, similar newspaper sales per 1000 people were seen in Argentina and Surinam as well as Cuba: 123 and 122 and 118 papers respectively. The figures for the remaining four countries varied from a low of 40 to a high of 97 papers.Overall, the higher the newspaper sales, the lower illiteracy rate, which makes sense. However, it is interesting to find there was little relation between GDP and adult illiteracy rate, as the highest and lowest GDP had exactly the same rates of illiteracy.The table below gives information on consumer spending on different items in five different countries in 2002The table compares the expenditure of consumers on three categories in five different countries in 2002.Consumer spending on food/drinks/tobacco was the highest in Turkey (32.14%), followed by that in Ireland (28.91%). Figures for Italy, Spain, and Sweden varied from a low of 15% to a high of 20%.In terms of the second item, Italy had the largest consumer spending on clothing and footwear (9%), as opposed to only 5.4% in Sweden. Figures for Ireland, Spain and Turkey were similar: 6.43%,6.51% and 6.63% respectively.In the case of the third category, 4.35% of consumer expenditure was spent on leisure and education in Turkey, about twice as much as that in Ireland (2.21%). Similar consumer spending on this field was seen in Italy and Sweden: 3.2% and 3.22%. Overall, the largest proportion of consumer expenditure in each country was at food, drinks and tobacco; as to leisure and education, the reverse was the case.The picture illustrates the process of coffee manufacture and preparation for sale on the market.The picture illustrates how coffee is produced by using different facilities. In general, there are three stages of the process, beginning with the preparation of raw materials. The raw materials are then manufactured into coffee which finally will be packed into jars for sale.Looking at the first stage of the process, coffee beans are picked in fields by farmers, after which they are dried on the ground.At the following stage of the process, coffee beans are roasted, before being cooled rapidly. When this is done, they are ground into powder which is then mixed with the hot water. Thereafter, once the mixture is strained, it will be frozen and ground again. The next step takes place in a vacuum container in which the frozen liquid is dried and water is evaporated.The final stage is to pack newly made coffee into jars, which will then be labeled and prepared to be sold to customers in shops and markets.The diagrams below give information about a school site in 2004 and the planning of the same school in 2010.The maps show the changes taking place in a school named Hogwarts Grammar school between 2004 and 2010. It is clear that the school had changed considerably and there were about five new features between original school and the new one. According to the first map, a sport field was located in the middle of the school, with a car park on the east and a school building on the west. A main road crossed the school from the west to the east, leading to a car park.Looking at the second map in more detail, we can see that the original school building was substituted by three new ones as the number of students nearly doubled, rising from 600 to 1000. A new park lot was constructed in the northwest corner, and the previous sport field was halved in size. The former walking path completely disappeared and three new roads linked new school buildings. The main road was redeveloped to link the two car parks.。
50篇雅思小作文模板1. Technology in Education: The Benefits and Drawbacks。
2. The Impact of Social Media on Society。
3. The Importance of Learning a Second Language。
4. The Benefits of Traveling Abroad。
5. The Effects of Globalization on Culture。
6. The Advantages and Disadvantages of Online Shopping。
7. The Importance of Physical Exercise。
8. The Impact of Climate Change on the Environment。
9. The Benefits of Volunteering。
10. The Role of Government in Promoting Health。
11. The Effects of Stress on Mental Health。
12. The Importance of Time Management。
13. The Benefits of a Balanced Diet。
14. The Impact of Music on Emotions。
15. The Role of Family in Child Development。
16. The Effects of Technology on Communication。
17. The Benefits of Renewable Energy。
18. The Importance of Financial Literacy。
19. The Impact of Artificial Intelligence on Society。
主语从句翻译句子练习:1.显然,到2000年这两个国家依赖于不同的主要燃料源。
2.据报道每年有成千上百万人死于和水有关的疾病。
3.谁应该对老年人负责这个问题在社区里被广泛讨论。
4.不论谁污染环境都应该受到惩罚。
5.lt is probable that the no cturnal trades (夜间的谋生)go way back inthe ancestry of all mammals (哺乳动物).(剑7 Test 1 Reading1 )6.It should be no surprise then that amongmathematicians and architects, left-handers tend to be more commonand there are more left-handed males than females.7.现在,人们普遍认为没有一所大学能够在学生毕业的时候教给他们所需要的所有知识。
8.这档节目是否成功在接下来的几十年将会揭晓。
9.人们普遍认为计算机和其他机器已经成为社会必不可少的一部分。
10.无可争辩,寄宿学校正在发挥越来越重要的作用,尤其是最近几年。
11.采取有效的措施来结束日益恶化的空气污染势在必行。
12.无可争辩,现在有成千上万的人过着挨饿受冻的痛苦生活。
13.人们普遍认为太空探索能够促进科学事业的发展。
14.值得注意的是农村和城市的生态环境都在不断恶化。
15.众所周知,环境污染问题是中国乃至世界面临的最为严重的问题之一。
宾语从句翻译句子练习:1.许多专家怀疑英语是否应该作为全球唯一的官方语言。
2.大部分学生相信业余工作使他们有更多的机会发展人际交往能力,而这对他们未来找工作是非常有好处的。
3.有些人认为旅游业的发展会对传统文化产生一些负面的影响。
4.一项调查显示,许多农民工认为在城市打工不仅有较高的收入,而且能学到一些新技术。
5.越来越多的专家认为农民工(farmer laborers/rural emigra nts) 对城市的建设起到积极作用,然而,越来越多的城市居民却怀疑这种说法,他们抱怨农民工给城市带来了许多严重的问题,比如犯罪。
雅思小作文范文表题(必备14篇)(经典版)编制人:__________________审核人:__________________审批人:__________________编制单位:__________________编制时间:____年____月____日序言下载提示:该文档是本店铺精心编制而成的,希望大家下载后,能够帮助大家解决实际问题。
文档下载后可定制修改,请根据实际需要进行调整和使用,谢谢!并且,本店铺为大家提供各种类型的经典范文,如工作总结、工作计划、合同协议、条据文书、策划方案、句子大全、作文大全、诗词歌赋、教案资料、其他范文等等,想了解不同范文格式和写法,敬请关注!Download tips: This document is carefully compiled by this editor. I hope that after you download it, it can help you solve practical problems. The document can be customized and modified after downloading, please adjust and use it according to actual needs, thank you!Moreover, our store provides various types of classic sample essays for everyone, such as work summaries, work plans, contract agreements, doctrinal documents, planning plans, complete sentences, complete compositions, poems, songs, teaching materials, and other sample essays. If you want to learn about different sample formats and writing methods, please stay tuned!雅思小作文范文表题(必备14篇)雅思小作文范文表题第1篇The graph below shows the amounts of waste produced by three companies over a period of 15 years.雅思小作文范文The line graph compares three companies in terms of their waste output between the years 2000 and 20XX.It is clear that there were significant changes in the amounts of waste produced by all three companies shown on the graph.While companies A and B saw waste output fall over the 15-year period, the amount of waste produced by company C increased considerably.In 2000, company A produced 12 tonnes of waste, while companies B and C produced around 8 tonnes and 4 tonnes of waste material respectively.Over the following 5 years, the waste output of companies B and C rose by around 2 tonnes, but the figure for company A fell by approXimately 1 tonne.From 2005 to 20XX, company A cut waste production by roughly 3 tonnes, and company B reduced its waste by around 7 tonnes.By contrast, company C saw an increase in waste production of approXimately 4 tonnes over the same 10-year period.By 20XX, company C’s waste output had risen to 10 tonnes,while the respective amounts of waste from companies A and B had dropped to 8 tonnes and only 3 tonnes.(192 words, band (9)雅思图表作文真题:混合图:温度与降水The climograph below shows average monthly temperatures and rainfall in the city of Kolkata.雅思小作文范文The chart compares average figures for temperature and precipitation over the course of a calendar year in Kolkata.It is noticeable that monthly figures for precipitation in Kolkata vary considerably,whereas monthly temperatures remain relatively stable.Rainfall is highest from July to August, while temperatures are highest in April and May.Between the months of January and May,average temperatures in Kolkata rise from their lowest point at around 20°C to a peak of just over 30°C.Average rainfall in the city also rises over the same period, from approXimately 20mm of rain in January to 100mm in May.While temperatures stay roughly the same for the neXt four months, the amount of rainfall more than doubles between May and June.Figures for precipitation remain above 250mm from June to September, peaking at around 330mm in July.The final threemonths of the year see a dramatic fall in precipitation, to a low of about 10mm in December,and a steady drop in temperatures back to the January average.(173 words, band (9)雅思图表作文真题:混合图:独居人口The bar chart below shows the proportions of English men and women of different ages who were living alone in 20XX.The pie chart compares the numbers of bedrooms in these one-person households.Living alone in England by age and gender, of bedrooms in one-person households (England, 20XX)雅思小作文范文The two charts give information about single-occupant households in England in the year 20XX.The bar chart compares figures for occupants age and gender, and the pie chart shows data about the number of bedrooms in these homes.Overall, females made up a higher proportion of people living alone than males, and this difference is particularly noticeable in the older age categories.We can also see that the most common number of bedrooms in a single-occupant home was two.A significant majority of the people aged 65 or over whowere living alone in England in 20XX were female.Women made up around 72% of single occupants aged 75 to 84, and 76% of those aged 85 or over.By contrast, among younger adults the figures for males were higher.For eXample, in the 35-49 age category,men accounted for nearly 65% of people living alone.In the same year, of one-person households in England had two bedrooms,while one-bedroom and three-bedroom homes accounted for 28% and of the total.Under 7% of single-occupant homes had four or more bedrooms.(189 words, band(9)以上就是雅思图表作文真题及高分范文汇总的全部内容,更多雅思小作文及图表作文真题范文,请关注小站雅思频道。
雅思真题11作文范文雅思写作2021年11月11日All类大作文题目是什么您好,您是不是弄错了考试日期? 2021年10月11日大作文题:Some people think personal happiness is directly related to economic success, while others believe this depends on other factors. Discuss both sides and give your opinion. 2021年11月8日大作文题:We have three important parts of education reading,writting and Math. some people think every child will benefit from a fouth skill added to the list: computer skills: do you agree or disagree. 2021年11月17日大作文题:In the past, buildings often reflected the culture of a society but today all modern buildings look alike and cities throughout the world are becoming increasingly similar. What do you think is the reason for this? And is it a good thing or a bad thing?。
2021年11月03日雅思小作文题目和范文(源自洛阳大华雅思题库)Some people believe that many people who work for creative arts such as painting, theatre and music should be supported financially by government. Others think that artists in creative arts should be supported by other sources instead. Discuss both views and give your own opinion.IntroductionVisual and auditory arts play a key rolein education and entertainment, making these fields integral aspects of our society among all ages. Nevertheless, there is a controversial division about whether these areas ought to receive, or if they are even deserving of, any public funds.BodyThe arts form an intrinsic part of a country and have an ability to maintain traditional culture, as long as it is prevented from being absorbed by modern or foreign influences. As a result, government should invest funds into these historical types of art in order to educate its citizens and preserve their existence. There are ancient paintings, theatrical arts and musical instruments that ought to be housed and conserved in museums. The destruction of these precious pieces of art could signify a considerable loss of culture, whereby future generations will miss out on them.Artists and their outputs ought to adhere to the economic principles of supply and demand, whereby the necessity for their work is dictated by the need from society. Nevertheless, there are artists, dramatists and musicians who are relatively wealthy and do not require subsides from government to survive. As society evolves, perhaps certain genres of art are not needed anymore and it would be economically unfeasible to keep them afloat using taxpayer dollars. Instead, programs that haveimmediate impacts on the lives of citizens must be focused on, including education, healthcare and social services.ConclusionFrom my perspective, only art forms that are deemed nationally significant ought to receive government funding. In this way, it would be fair for a host of other industries who cannot easily obtain financial assistance.。
1. 国际贸易是一个公众感兴趣和关注的话题。
The international trade is a topic of public interest and concern.2. 在交流领域中,最热门的话题也许就是因特网的广泛使用。
Perhaps the hottest topic in the area of communication is the widespread use of the Internet. (插入语) 3.英语作为全球语言的发展是20世纪末和21世纪初最为瞩目的现象之一。
The development of English (what) as a global language is one of the most(瞩目现象)remarkable phenomena of the late 20th and early 21st centuries.4.文化和旅游业之间的关系已经在世界范围内引起了广泛关注。
The relationship between culture and tourism has received a great amount of attention throughout the wor ld.5.最近几年,关于国家之间贸易活动的争论已经被明显快速扩展的进口激化了。
In recent years, the debate about trade activities between countries has been fueled/intensified by overtly r apid expansion of importing.6.教育已经成为一个重要产业,它对社会的重要性无可比拟。
Education has become an important industry, an industry that is second to none in terms of importance to our society.7.由于健康和生活条件的改善,人类寿命快速延长,这是二十一世纪所有发达国家的一个特征。
剑10test2小作文范文跪谢!剑7TEST1小作文求批改...我也是挣扎中的烤鸭一员,只是说下我的见解,希望互相勉励吧第一段改写得很好啊,我好喜欢第二段感觉第一句不太对啊,图标给的是百分比而不是花销的量是吧.Food/Drinks/Tobacoo group accounted for the largest part of(我想用in是不是好一点呢)the three sectors还有在说到国家间差异的时候,我不太清楚你是在跟其他国家间对比呢,还是说是国家内部这个数据的对比呢.读起来有点迷糊.还有..你很久都没有处理你的问题啦,你现在已经考了么?剑七test2阅读你们做了感觉怎么样?三天前,我做了一遍错了20个...备考的学生分为两种:大部分选择参加上课培训,少部分是自学。
对上课的学生来说,他们除了上课听老师讲解写作的解题方法和解题思路,课后也需要大量的写作练习,或者希望能有范文参考,给与自己更多的想法和素材;而自学的学生主要通过购买参考书,慢慢地领会书中的讲解,参考其中的范文并进行模仿写作。
不管是老师给与学生范文还是学生自己搜索范文,参考范文的来源主要有以下几种:1)官方的高分范文;2)参考书上的范文;3)网络参考范文;学生视参考范文为‘救命稻草’,所以往往不分青红皂白地借用,而一旦脱离了范文,自己依然无从下手,主要原因是学生对范文的依赖已经远远超过自己的理解,没有正确地找到自己想要什么。
在本文中,朗阁海外考试研究中心的专家们会摘录不同渠道的参考范文,通过分析让学生真正理解如何更好地利用参考范文。
一:官方的参考范文官方的范文一般是考官所写,而且都是满分作文。
比如:In many countries, schools have severe problems with student behavior.What do you think are the causes of this?What solutions can you suggest?本题来自剑桥4,TEST4的TASK 2,属于report题型,题目简单阐述了一个事实,即学生在学校的行为问题比较普遍,需要分析其原因,并给出相应的解决方法。

雅思小作文考官范文(精选6篇)(经典版)编制人:__________________审核人:__________________审批人:__________________编制单位:__________________编制时间:____年____月____日序言下载提示:该文档是本店铺精心编制而成的,希望大家下载后,能够帮助大家解决实际问题。
文档下载后可定制修改,请根据实际需要进行调整和使用,谢谢!并且,本店铺为大家提供各种类型的经典范文,如工作总结、工作计划、合同协议、条据文书、策划方案、句子大全、作文大全、诗词歌赋、教案资料、其他范文等等,想了解不同范文格式和写法,敬请关注!Download tips: This document is carefully compiled by this editor. I hope that after you download it, it can help you solve practical problems. The document can be customized and modified after downloading, please adjust and use it according to actual needs, thank you!Moreover, our store provides various types of classic sample essays for everyone, such as work summaries, work plans, contract agreements, doctrinal documents, planning plans, complete sentences, complete compositions, poems, songs, teaching materials, and other sample essays. If you want to learn about different sample formats and writing methods, please stay tuned!雅思小作文考官范文(精选6篇)雅思小作文考官范文第1篇第一段:复述文章主题+引出论点典型的大作文文章开篇,中规中矩,不失为实战中最好用也是最稳妥的写法。
雅思语法模板翻译强化1. 所以,正像我所理解的,尽管计算机在教育领域被广泛应用,但教师仍在课堂上起着重要的作用。
Therefore, as I see it, although computers are widely used ineducation, teachers still play important role in the classroom.2. 从上面所讨论的,我们会得出最后结论:公司应当鼓励55岁以上的人退休,从而给年轻一代更多的机会。
From what has bee n discussed above, we may fin ally draw the con clusi on that compa ny should en courage people above 55 years old to retire in order to give opportunities to a new generation.3. 就像俗话所说,“有多少人,就有多少种观点”。
来自不同背景的人对同样的问题有不同的看法是可以理解的。
As the proverb goes, So many people, so manymin ds. ” It is quite un dersta ndable that people from differe nt backgro und have different interpretations of the same issue.4. 随着社会的发展,越来越多的问题引起我们的注意,其中一个问题是:人们过多的使用电脑使人们的社会能力已经下降。
Along with the development of society, more and more problems are brought to our attention, one of which is that people use computers so ofte n that their social skills have bee n dimini shed.5. 首先,科学家和艺术专家,如商人、语言学家、作家、历史学家和哲学家,为社会做出了同等的贡献。
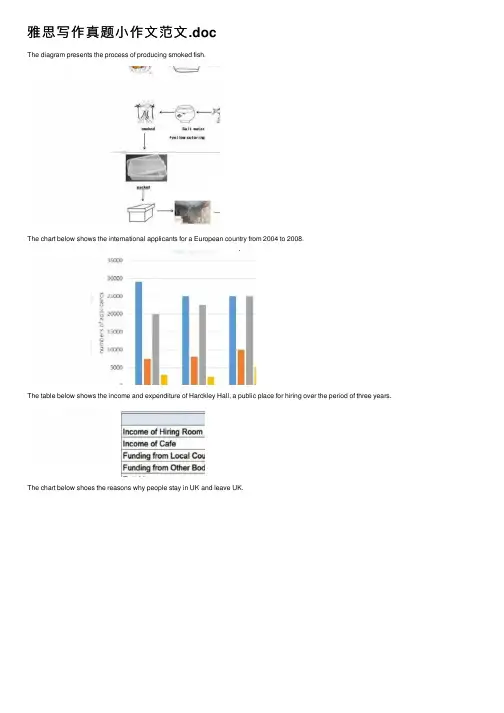
雅思写作真题⼩作⽂范⽂.docThe diagram presents the process of producing smoked fish.The chart below shows the international applicants for a European country from 2004 to 2008.The table below shows the income and expenditure of Harckley Hall, a public place for hiring over the period of three years.The chart below shoes the reasons why people stay in UK and leave UK.The chart below shows the percentage of adults not doing physical exercise in Australia in 2005.The chart below shoes the percentage of international students in Canada and USA, also compare the three top source of countries in Canada and USA.The first chart shows the number of people per kilometer square of six countries in 2003. The second chart shows the percentage change of population in urban area of the six countries from 2003 to 2005.The diagram presents the process of producing smoked fish.The chart shows the percentage of dependents in total population in 5 countries, compared the number in 2000 and the projection in 2050.The chart shows the percentages of both males and females who ate 5 kinds of fruits and vegetables per day of 7 age groups in the UK 2006.The table below shows the employment rate and average annual salary of graduates from the Australian University.The chart below shows the percentage of people using internet for different activities in an UK city of year 2007 and 2009.This diagram shows the online activities of a particular city in Britain in the year of 2007 and 2009.The diagrams below show the changes of a town called Bridgetown in 1700 and 2000.The chart below gives information about the possession of newer technologies by different age groups in UK in 2009. Summarize important information and make comparison and contrast.The diagrams shows a museum and its surroundings in 1900 and 2010.The graph below shows the percentage of workers in 5 different European countries with a days or more illness absence from 1991 to 2001.。
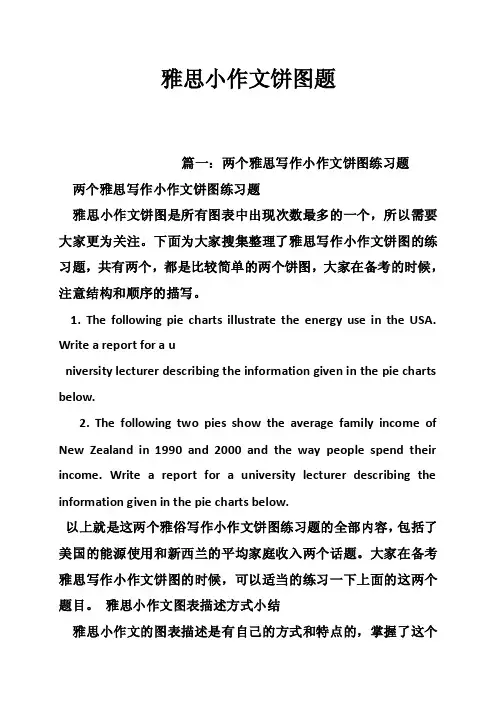
雅思小作文饼图题篇一:两个雅思写作小作文饼图练习题两个雅思写作小作文饼图练习题雅思小作文饼图是所有图表中出现次数最多的一个,所以需要大家更为关注。
下面为大家搜集整理了雅思写作小作文饼图的练习题,共有两个,都是比较简单的两个饼图,大家在备考的时候,注意结构和顺序的描写。
1. The following pie charts illustrate the energy use in the USA. Write a report for a university lecturer describing the information given in the pie charts below.2. The following two pies show the average family income of New Zealand in 1990 and 2000 and the way people spend their income. Write a report for a university lecturer describing the information given in the pie charts below.以上就是这两个雅俗写作小作文饼图练习题的全部内容,包括了美国的能源使用和新西兰的平均家庭收入两个话题。
大家在备考雅思写作小作文饼图的时候,可以适当的练习一下上面的这两个题目。
雅思小作文图表描述方式小结雅思小作文的图表描述是有自己的方式和特点的,掌握了这个方式可以让大家的小作文备考更快也更加贴近考试的要求。
下面就为大家整理了雅思小作文图表描述的方式,供大家参考。
1. 与趋势有关的词语:上升(v.):increase, rise, climb, ascend, surge, shoot up下降(v.):decrease, decline, drop, fall, descend, plunge持平(v.):remain stable, keep constant, level off, flatten out波动(v.):fluctuate, wave, go up and down快速(adj./adv.):considerable/considerably, significant/significantly, substantial/substantially, remarkable/remarkably, dramatic/dramatically稳步(adj./adv.):steady/steadily, stable/stably, moderate/moderately, modest/modestly缓慢(adj./adv.):slight/slightly, minimal/minimally, marginal/marginally顶点(n. /v.):peak趋势(n.):trend/ tendency2. 与大小相关的词语:Outnumber (v.):在数量上超过The demonstrators were outnumbered by the policeExceed (v.):在数量上超过Triple (v.):变成三倍The figure has tripled.Double (v.):变成两倍The price of houses has virtually doubled over the past few years.Mount to (v.):达到Counterpart (n.):对应的另一方,比较的另一方this product is better than its counterparts此外,朗阁海外考试研究中心建议考生还应考虑一下题中数据和百分比有没有联系,如果有的话还应辅以一些关于比例和占据的语句。
雅思写作饼图小作文满分雅思写作饼图小作文满分范文(通用20篇)饼图写作也是雅思写作常见的作文类型之一。
下面,店铺就为大家送上两篇雅思写作饼图小作文满分范文,希望对大家有用。
雅思写作饼图小作文满分篇1The pie charts compare visitors’ responses to a survey about customer service at the Parkway Hotel in 2005 and in 2010.It is clear that overall customer satisfaction increased considerably from 2005 to 2010. While most hotel guests rated customer service as satisfactory or poor in 2005, a clear majority described the hotel’s service a s good or excellent in 2010.Looking at the positive responses first, in 2005 only 5% of the hotel’s visitors rated its customer service as excellent, but this figure rose to 28% in 2010. Furthermore, while only 14% of guests described customer service in the hotel as good in 2005, almost three times as many people gave this rating five years later.With regard to negative feedback, the proportion of guests who considered the hotel’s customer service to be poor fell from 21% in 2005 to only 12% in 2010. Similarly, the proportion of people who thought customer service was very poor dropped from 15% to only 4% over the 5-year period. Finally, a fall in the number of ‘satisfactory’ ratings in 2010 reflects the fact that more people gave positive responses to the survey in that year. 雅思写作饼图小作文满分篇2The charts compare Korea, Sweden and the UK in terms of the methods used in each country to dispose of harmful waste.It is clear that in both the UK and Sweden, the majority of dangerous waste products are buried underground. By contrast,most hazardous materials in the Republic of Korea are recycled.Looking at the information in more detail, we can see that 82% of the UK’s dangerous waste is put into landfill sites. This disposal technique is used for 55% of the harmful waste in Sweden and only 22% of similar waste in Korea. The latter country recycles 69% of hazardous materials, which is far more than the other two nations.While 25% of Sweden's dangerous waste is recycled, the UK does not recycle at all. Instead, it dumps waste at sea or treats it chemically. These two methods are not employed in Korea or Sweden, which favour incineration for 9% and 20% of dangerous waste respectively.雅思写作饼图小作文满分篇3Dear Sir or Madam,I’m writing in response to the advertisement you placed in Shanghai Daily for the position of overseas mechanical engineer on Mon. Feb.23.I would like to apply for this post. I graduated with a Master’s degree in Machine-Building and Electronics Industries in Tsinghua University in 1999 and began my career in Zhongshan ABB Company as a young mechanical engineer. In 20XX, I was promoted to be the chief engineer, taking charge of the projects in Southeast Asia. I have been seeking for chances overseas in my majored domain in the hope that I can develop my potential further.If possible, I would like to choose a mechanical company with good reputation located in Chicago. I would also prefer small private companies which allow me to enjoy a larger space of promotion.The reason I made the decision above is that my husbandhas recently been relocated to Chicago by his company and I am, therefore, seeking a position in the same area in Chicago.I have enclosed my resume that outlines in detail my qualifications and experience as well as an open letter of recommendation from my former employer.Please give me a feedback at your earliest convenience if my qualifications meet your requirements.I look forward to hearing from you soon.Yours sincerely,Lucy Liu雅思写作饼图小作文满分篇4As a result of constant media attention, sports professionals in my country have become stars and celebrities, and those at the top are paid huge salaries. Just like movie stars, they live extravagantlifestyles with huge houses and cars.Many people find their rewards unfair, especially when comparing these super salaries with those of top surgeons or research scientists, or even leading politicians who have the responsibilityof governing the country. However, sports salaries are not determined by considering the contribution to society a person makes, or the level of responsibility he or she holds. Instead, they reflect the public popularity of sport in general and the level of public support that successful stars can generate. So the notion of ‘fairness’ is not the issue.Those who feel that sp orts stars’ salaries are justified might argue that the number of professionals with real talent are very few, and the money is a recognition of the skills and dedication a person needs to be successful. Competition is constant and a player is tested every time they perform. in their relatively short career. The pressure from the media is intense and there is littleprivacy out of the spotlight. So all of thesefactors may justify the huge earnings.Personally, I think that the amount of money such sports stars make is more justified than the huge earnings of movie stars, but at the same time, it indicatesthat our society places more value on sport than on more essential professions and achievements.译文在媒体不断地推波助澜下,我国的许多职业运动员已成为了明星和名人。
1. 饼状图主体段写法第一句话:说明饼状图的组成部分第二句话:说明占比例最大的部分第三句话以后:说明占比例第二的部分(或者:把剩下的几部分分类,把比例相同的部分捏合到一起说明)第一句:It can be seen from the pie chart that the electricity is used for four purposes.主体段第一句开头“由图可见”的常用表达:It can be clearly seen from the chart that…As can be clearly seen from the chart,We can see clearly from the chart that…According to the… chart,It is apparent/ obvious / evident / manifest from the…. chart that…主体段第一句和第二句的过渡句:To be more exact, = More exactly,To be more precise, = More precisely,To be more specific, = More specifically,To be more detailed, = More detailedly第二句开始:To be more precise, heating rooms and water accounts for the largest proportion (52.5%) of the electricity used, while the demand of ovens, kettles and washing machines occupies the 17.5% of the total need of electricity. Lighting, TV andradio represent the same percentage(15%) as do vacuum cleaners, food mixers and electric tools.饼状图写作要点:1.介绍各扇面及总体的关系2.各个扇面之间的比较,同类扇面在不同时间,不同地点的比较3.重点突出特色最明显的扇面:最大的,最小的,互相成倍的描写句式:1.It is clear that the most +adj. + 主题词is A, which accounts for ___% of all 主题词.2. B is the next largest + 主题词, ___% lower than A of all 主题词and followedclosely by C.3.The above three items of 主题词altogether take about ___%.4.By contrast, D, E and F make the smallest percentage of total 主题词, which are___%, ___% and ___% respectively.模仿例句:In 1950, the urban population represented less than 13% of the total. It is now about 40% and is expected to reach 60% by 2030. (摘自BBC)表示占据的动词或动词短语:form; comprise; make up; occupy; constitute; cover; represent; account for; be shared by倍数和比例的表达:a quarter of ……; half of ……; a majority of ……double (这三个词都可以做名词,动词和形容词); triple; quadruple… be twice as adj. as ……例句:The dining-room is twice as big as the kitchen. … more than ___ times as adj. as …… 例句:There are more than twice as many kangaroos as people in Australia.He is more than three times as rich as I.A has something in common with BA shares some similarity with BThe difference between A and B lies in ……Sentence Patterns:Introduction:The (two) pie charts show (reveal, suggest, illustrate, demonstrate, indicate, describe, relate) the proportion (percentage) of A and B…in (7) (categories), divided into…and…(one is…, another is…)Comparison:1、The biggest difference between (2) groups is in …, where A makes up % while (whereas) B constitutes % (makes up=constitutes=accounts for)the highest percentage / amount of A, which was approximately %, was for…. (=in) /was found in2、The percentage of A in …is more than twice the percentage of B, the ration is % to % (% compared to %)3、In…, while there is (not) a great deal of difference between the percentage of A and B (the former is % and the latter is %).in …, while a greater percentage of A than B are found in…(the former is % and the latter is %).4、There are more A (in …), reaching %, compared with % of B5、By contrast, A has increased (declined), from % in …to % in ….Compared with B, A …Conclusion:To sum up/ In conclusion / It appears that…/ The two charts clearly show…饼状图一例Many women want or need to continue working after they have children. The chart below shows the working after they have children. The chart below shows the working pattern of mothers with young children.the introduction can be written like this:Even just after having a child, a large number women return to work. As the child grows older, the percentage of mothers who choose or need to continue working rises. At least until the child is ten, the larger number of working mothers take part-time occupations. When the child is ten years or older, the number of the full-timers more than doubles while that of the part-timers decrease.Each chart entails / contains instruction, which illustrates what the chart involves rather than the over trends.Paragraph 1:When the youngest child is at most 2 years old, 30% of the women return to work. 19% full-time, and 11% as part-timers.Paragraph 2:The percentage of full timers remains the same until the child turns five and increased slightly to 14% when the child is at most 9 years old, but the percentage of part-time working mothers grows dramatically to 35 and continues growing to 48% by the time the child is 9.Paragraph 3:A change occurs after the child grows to ten. The number of full-time working mothers doubles in percentage to 29, while that of the part-timers is reduced slightly to by 3% to 45%.Conclusion:It appears that, when the child turns to ten, women have much fewer maternal responsibilities than the years before.You should spend about 20 minutes on this task. Write a report for a university lecturer describing the information shown below. You should write at least 150 words.In this analysis we will examine three pie charts. The first one is headed ‘World Spending.’ The second is ‘World Population’ and the third is ‘Consumption ofResources.’In the first chart we can see that people spend most of their income (24%) on food. Transport and then housing are the next major expenses at 18% and 12% respectively. Only 6% of income is spent on clothing.In the second chart entitled ‘World Population’, it is not surprising to find that 57% of people live in Asia. Europe and the Americans account for nearly 30% of the total, whilst 10% of people live in Africa.Finally, the third chart reveals that the USA and Europe consume a huge 60% of the world’s resource.To sum up, the major expenditure is on food, the population figures are the highest for Asia and the major consumers are the USA and Europe. (182 words)范文参考The two graphs show that oil was the major energy source in the USA in both 1980 and 1990 and that coal, natural gas and hydroelectric power remained in much the same proportions. On the other hand, there was a dramatic rise in nuclear power,which doubled its percentage over the ten years.Oil supplied the largest percentage of energy, although the percentage decreased from 42% in 1980 to 33% in 1990. Coal in 1990 was the second largest source of energy, increasing its proportion to 27% from 22% in the previous decade. Natural gas, the second largest source in 1980 at 26%, decreased its share very slightly to provide 25% of America’s energy ten years later. There was no change in the percentage supplied by hydroelectric power which remained at 5% of the total energy used. Nuclear power the greatest change: in 1990 it was 10%, twice that of the 1980s.(152 words)句型套路让“饼图”写作华彩绽放许多考生觉得饼图十分简单,也就是一些百分比及数字的列举,对该类图表不太重视,准备并不充分。
作文范文之2014雅思2月1日小作文2014雅思2月1日小作文【篇一:2014雅思写作大作文真题】2014.1.09 1社会生活:交通the best way for government to solve traffic congestion in cities is to provide free public transport 24 hours a day, 7 days a week.to what extent do you agree or disagree?老题回顾:06.6.17the best way to solve the worlds environmental problems is to raise the of fuel. to what extent you agree with or disagree?12.7.21many cities and towns in the world have high volumes of traffic.what are the causes of that and what action could be taken to solve the problem?剑8 test 3increasing the price of petrol is the best way to solve growing traffic and pollution problems. to what extent do you agree or disagree? what other measures do you think might be effective?2014. 1.11 2社会生活:工作问题many young people choose to change their job after few years.why?do the disadvantage overweigh the advantages? 2014.1.18 教育children find it difficult to concentrate on or pay attention to school. what are the reasons?how can we solve this problem? 2014.1.25 环境the international community must act immediately to ensure that all countries reduce the consumption of fossil fuels (e.g. gas and oil). to what extent do you agree or disagree with this statement?老题回顾:09.5.25many countries use fossil fuels (coal,oil,natural gas) as the main source of energy. however,in some countries the use of the alternative sources of energy (wind energy and solar energy) are encouraged. to what extent do you agree or disagree with this development?2014.2.01 3社会生活some people believe that the best way to produce a happier society is to ensure that there are only small differences between the richest and the poorest members. to what extent do you agree or disagree?2014.2.13 政府投资towns and cities are attractive places. some suggest the government should spend money putting in more works of art like paintings and statues to make them better to live in. agree or disagree?2014.2.154社会生活some people think success in life comes from hard work and determination, but others think there are more important factors like money and appearance. discuss both sideschildren’s education is expensive. in some countries, the government pay some of or all of the costs. do the advantages outweigh its disadvantages?老题回顾2013.08.17in some countries,students pay their college or university fees,while in some others,government pays for them. do you think the advantages that government pays the money outweigh the disadvantages. give reasons and examples.2012.09.06some people believe everyone has the right to get university education,to what extent do you agree government should make it free to all people no matter of their financial background?2007.09.22higher education has several ways to be funded:all costs paid by governmentall costs paid by studentsstudents could get government loan and after finishing the education students should repaid the cost to the government. discuss the benefits of these three theories above and decide which is the best way .2014.3.1 5社会生活——健康问题some people think living in big cities is bad for people’s health. to what extent do you agree or disagree?some people think that all young people should be required to stay in full-time education until they are at least 18 years old. to what extend do you agree or disagree?2014.3月15 6社会生活:健康it is important for all towns and cities to have large public outdoor places like squares and parks. to what extent do you agree or disagree?2014.4月5号7社会生活:工作an increasing number of people change their career and places of residence several times during their life.is this a positive or negative development?2014.4月12 4教育some believe the purpose of education is to prepare individuals to be useful to the society. while others say the purpose is to help individual to achieve personal ambitions. discuss both views and give your opinion.2014.04.241 文化:媒体nowadays many television advertisements are aiming at children. what are the effects of this situation on children? should television advertisements be controlled?2014.04.26 2 科技in most countries, with the widespread of the use of internet, people have more freedom to choose to work and study at home instead of traveling to work or college. do the advantages outweigh its disadvantages?2014.05.10弱势群体nowadays women have full-time work same as men, logically men should share household equally with women. do u agree or disagree?2014.05.17科技+教育some people believe that children can learn from tv effectively. so children should be encouraged to watch tv regularly both at home and at school. to what extent agree or disagree?2014.05.24 5教育many young people leave school with a negative attitude. what are the reasons? how can we encourage young people to study?2014.0607 1犯罪unlike other countries, police in uk do not carry guns. some think it leaves citizen unprotected. others think it reduces the overall violence in uk society. discuss both views and give your own opinion.2014年6月19 6教育some people think that its easier for adults to learn practical skills (such as computer skills) by themselves; others think that its better to learn with a teacher in the classroom. discuss both sicks and give your opinions.2014年6月28 1环境:能源with the increasing demand for energy resources of oil and gas, people should look for sources of oil and gas in remote and untouched places. do the advantages outweigh thedisadvantages of damaging such places?2014年7月10 8社会生活:体育运动some countries have achieved international success by building specialized sports facilities for top athletes to train instead of providing sports facilities that everyone can use. is this a positive or negative development?2014年7月12 2政府some people think young people are not suitable for important positions in the government, while others argue that it is a good idea. discuss both views and give your own opinion.2014年7月19 3政府some people believe that the government have the duty to ensure its citizens have a healthy diet,while others believe it is individuals responsibility to care for their diet andhealth?discuss both sides and give your opinion?2014年7月26 2环境some people think that environmental problems are too big for individuals to solve. others, however, believe that the problems cannot be solved if individuals do not take actions. discuss both views and give your own opinion.2014年8月2 2犯罪children are committing more crimes. what are the causes? how to punish them?2014年8月9政府+社会生活some think that government should ban dangerous sports. others believe that people should have the freedom. discuss and give opinion?2014年8月16 政府+社会生活governments are encouraging industries and businesses to move from large cities to regional areas. do the advantages outweigh the disadvantages?2014年8月21 国际化during the 20th century, contacts between different parts of the world developed quickly, thanks to air travel and telecommunication. to what extent do you think societies benefits from increased contact and closer relationship brought about by international tourism and business?2014年9月4 科技+社会生活now people in many countries can live and work anywhere they choose with improved communication technology and transport. advantages outweigh disadvantages?正方观点:随意选择居住地点和工作场所对社会和个人都有益处。
雅思写作小作文表格题参考雅思写作小作文表格题参考范文表格题的写作大家接触的比较少,可能写不好,但是一定要多练习。
因为这可是雅思小作文的常考类型之一。
下面,店铺为大家提供两篇雅思写作小作文表格题参考范文,希望对大家有用。
雅思写作小作文表格题参考篇1话题:The table below shows the amount of waste production (in millions of tonnes) in six different countries over a twenty-year period.参考范文:The chart compares the amounts of waste that were produced in six countries in the years 1980, 1990 and 2000.In each of these years, the US produced more waste than Ireland, Japan, Korea, Poland and Portugal combined. It is also noticeable that Korea was the only country that managed to reduce its waste output by the year 2000.Between 1980 and 2000, waste production in the US rose from 131 to 192 million tonnes, and rising trends were also seen in Japan, Poland and Portugal. Japan’s waste output increased from 28 to 53 million tonnes, while Poland and Portugal saw waste totals increase from 4 to 6.6 and from 2 to 5 million tonnes respectively.The trends for Ireland and Korea were noticeably different from those described above. In Ireland, waste production increased more than eightfold, from only 0.6 million tonnes in 1980 to 5 million tonnes in 2000. Korea, by contrast, cut its waste output by 12 million tonnes between 1990 and 2000.雅思写作小作文表格题参考篇2话题:The table below shows changes in the numbers of residents cycling to work in different areas of the UK between 2001 and 2011.参考范文:The table compares the numbers of people who cycled to work in twelve areas of the UK in the years 2001 and 2011.Overall, the number of UK commuters who travelled to work by bicycle rose considerably over the 10-year period. Inner London had by far the highest number of cycling commuters in both years.In 2001, well over 43 thousand residents of inner London commuted by bicycle, and this figure rose to more than 106 thousand in 2011, an increase of 144%. By contrast, although outer London had the second highest number of cycling commuters in each year, the percentage change, at only 45%, was the lowest of the twelve areas shown in the table.Brighton and Hove saw the second biggest increase (109%) in the number of residents cycling to work, but Bristol was the UK’s second city in terms of total numbers of cycling commuters, with 8,108 in 2001 and 15,768 in 2011. Figures for the other eight areas were below the 10 thousand mark in both years.雅思作文技巧推荐首先,我们来介绍一下雅思写作考试的基本内容吧。
求批改剑8 test4的小作文bottomed at 应该是bottomed out at还不错的,描述的很详细。
但是句式还可以更加丰富,可以用定语从句。
还有首句改写不可以仅仅换单词的。
可以这么改写:the line chat illustrates how quantities of goods were transported in UK from 1974 to 2002 through four main modes of transport.如果要打分的话是6.5大家帮忙看看,剑8 test4 , 小作文,我这样写几分,到底应该怎么样恩,首先你的单词量只有159,规定写150个,最好还是多个二十几个的比较好,你这个字数比较危险,考官不会一个个给你数的,你看起来比较少,可能就OVER了哦。
再来,你的开头,就有比较低级的错误,比如,UK,是the uk,或者你写the united kingdom,反正都要加THE。
这个问题出现了两次。
其他的细小语法错误都没有,单词拼写错误也没有。
还有后面的curves finally grow,这个grow 时态不对的,而且还不如用went up比较native,不想和后面的重复也可以用其他的,反正grow但用于末尾很奇怪的。
而你最后一段不能继续描述内容了,而是应该做出总结,也就是你在这个基础上应该再写一段,具体点出——在英国,公路运输最受欢迎,而选择水路和管道运输的人也日益增多,而铁路运输的状况一直没有大变化,意味着人们也没有对它变得感兴趣。
有了这个,这篇文章才算完整的。
我估计,如果考官觉得你字数完整,虽然没有总结,但是运用各种词汇和变化性的句式,会给你6分,但是如果考官没有数字数,觉得你内容不完整字数不够,会给你5.5分。
我是个喜欢实话实说的人,其实LZ你的作文功底还不错的,加油吧,相信你一定能改善的,祝你取得满意的成绩。
from:一个同样在为了考试煎熬的烤鸭。
第一章图表作文概述图表分成Linechart,table,piechart,barchart,flowchart(3次)一、审题ThegraphbelowshowsradioandtelevisionaudiencesthrougWriteareportforauniversitylecturerdescribingtheinformatiYoushouldwriteatleast150words.0.00%10.00%20.00%30.00%40.00%50.00%6:8:1:12:2:4:6:8:1:12:2:4:6:RadioTelevisionThediagrambelowshowstheaveragehoursofunpaidworkpe rweekdonebypeopleindifferentcategories.(Unpaidworkreferst osuchcategoriesaschildcareinthehome,houseworkandgardenichildren children chldrenThetablebelowshowsinformationonincomes,taGesandpricesinfivecitiesaroundtheworld.Writeareportforauniversitylecturerdescribingtheinformations hownbelow.Youshouldwriteatleast150words.0102030405060708090审题:1、审题目:(题目相关的内容和时间)2、审文字:图标文字信息,比如坐标轴数据代表的信息,度量单位(图三)3、审数字:注意:有时不止一个图表,先判断图标之间是否有联系,若有,就一起描述,若无则分开描述;若我们无法看出其中联系,最好分开描述。
(图五)1)不描述所有数据。
2)遵循时间、最高原则。
1. 该表格描述了在...年之...年间...数量的变化。
2. 该柱状图展示了...
3. 该图为我们提供了有关...有趣数据。
4. 该图向我们展示了...
5. 该线形图揭示了...
6. 这个曲线图描述了...的趋势。
7. 数据(字)表明...
8. 该树型图向我们揭示了如何...
9. 该数据(字)可以这样理解...
10. 这些数据资料令我们得出结论...
11. 如图所示...
12. 根据这些表(数字)...
13. 如表格所示...
14. 从图中可以看出,...发生了巨大变化。
15. 从图表我们可以很清楚(明显)看到...
16. 这个图表向我们展示了...
17. 该表格描述了...年到...年间a与b的比例关系。
18. 该图描述了...总的趋势。
19. 这是个柱型图,描述了...
20. 如图所示,两条曲线描述了...的波动情况。
21. 在...至...期间,...基本不变。
22. 在...年到...的期间
23. 1995年至1998三年里...
24. 从那时起...
25. ...月(年)至...月(年)...的数量基本不变。
26. 数字急剧上升至...
27. ...至...期间...的比率维持不变。
28. ...的数目在...月(年)达到顶点,为...
29. 比率维持在...
30. ...的比例比...的比例略高(低)。
31. ...与...的区别不大。
32. 该图表表明...的数目增长了三倍。
33. ...逐年减少,而...逐步上升。
34. ...的情况(局势)到达顶(高)点,为...百分点。
35. 数字(情况)在...达到底部。
36. 数字(情况)达到底部(低谷)。
37. a是b的...倍。
38. a增长了...
39. a增长到...
40. 比低高(低)
41. ...数字呈上升趋势。
42. ...到...发生急剧上升。
43. 从...到...,下降速率减慢。
44. 从这年起,...逐渐下降至...
45. 与...相似
46. 与...相同
47. ...与...之间存在许多相似(不同)之处
48. a于b有共同之处。
49. a与b之间的差别在于...
50. ...年...急剧上升。
51. 数字开始上升,但在…该趋势被一个下降的趋势所代替。
52. 该数字恢复至之前的水平,并超过该水平。
53. 该数字急转直下。
54. 一个下降的趋势出现了。
55. 紧随其后的是一个巨幅下降。
56. 这被一个小幅上升所跟随。
57. 1995年至2000年上升的速度与2000年至2005年下降的速度相同,并且恢复到上升前的位置。
58. 俄罗斯,乌克兰,和塔吉克斯坦的比例翻了一倍多,自从1990年社会主义垮台后。
59. 美国占据世界上45%的军费支出,达到2007年的1.2trillion,比其他十四个最大国家加在一块都要多。
60. 男性每小时的总收入比女性高17.4%.
61. 与1980年的10%相比,失业率在1990年达到了最近十多年来的最低值4%。
62. 2003年的温室气体排放量在2002年的水平上增加了5.2%
63. 90年代的全球玉米产量比1985的高百分之十五。
64.曲线经历了一个大幅上升,使A的数字超过的B的数字。