Distribution of heavy metals in sediments of Mwanza Gulf of Lake Victoria, Tanzania
- 格式:pdf
- 大小:300.35 KB
- 文档页数:7

长江口新桥水道表层沉积物分布格局及其影响因素陈 云,戴志军,胡高建,梅雪菲,顾靖华Surface sediment distribution pattern of the Xinqiao Channel of Changjiang Estuary and its controlling factorsCHEN Yun, DAI Zhijun, HU Gaojian, MEI Xuefei, and GU Jinghua在线阅读 View online: https:///10.16562/ki.0256-1492.2021061503您可能感兴趣的其他文章Articles you may be interested in莱州湾表层沉积物重金属分布特征、污染评价与来源分析Spatial distribution of heavy metals in the surface sediments of Laizhou Bay and their sources and pollution assessment海洋地质与第四纪地质. 2021, 41(6): 67江苏中部海岸晚第四纪沉积物的粒度与磁化率特征及其古环境意义Characteristics of grain size and magnetic susceptibility of the Late Quaternary sediments from core 07SR01 in the middle Jiangsu coast and their paleoenvironmental significances海洋地质与第四纪地质. 2021, 41(5): 210南海北部陆坡神狐海域SH-CL38站位的粒度特征及沉积记录Sediment grain size characteristics of the Core SH-CL38 in the Shenhu area on the northern continental slope of the South China Sea 海洋地质与第四纪地质. 2021, 41(5): 90南海南部浅表层柱状沉积物孔隙水地球化学特征对甲烷渗漏活动的指示Pore water geochemistry of shallow surface sediments in the southern South China Sea and its implications for methane seepage activities海洋地质与第四纪地质. 2021, 41(5): 112福宁湾海域夏季大潮期悬浮泥沙输运特征及控制因素Characteristics and controlling factors of suspended sediment transportation in summer spring tide in Funing Bay海洋地质与第四纪地质. 2021, 41(6): 53冲绳海槽西部陆坡泥底辟和泥火山特征及其形成动力机制Characteristics and genetic dynamics of mud diapirs and mud volcanoes on the western slope of Okinawa Trough schematic geographic map of studied area mud diapirs with different morphology in multi-channel seismic section海洋地质与第四纪地质. 2021, 41(6): 91关注微信公众号,获得更多资讯信息陈云,戴志军,胡高建,等. 长江口新桥水道表层沉积物分布格局及其影响因素[J]. 海洋地质与第四纪地质,2022,42(2): 59-69.CHEN Yun ,DAI Zhijun ,HU Gaojian ,et al. Surface sediment distribution pattern of the Xinqiao Channel of Changjiang Estuary and its controlling factors[J].Marine Geology & Quaternary Geology ,2022,42(2):59-69.长江口新桥水道表层沉积物分布格局及其影响因素陈云1,戴志军1,胡高建2,梅雪菲1,顾靖华11. 华东师范大学 河口海岸学国家重点实验室,上海 2002412. 上海勘测设计研究院有限公司,上海 200335摘要:涨潮槽是全球河口普遍存在的重要地貌单元,其动力沉积过程直接关乎河口涨潮槽冲淤稳定。
determination of heavy metals in soil by atomic absorption spectrometry(aas) name: xufei group: the 3rd group date: sep. 20th 2012part 1 the introduction1.1the purposes(1)learn how to operate the atomic absorption spectrometry;(2)learn how to do the pretreatment of soil samples;(3)get familiar with the application of atomic absorption spectrometry.1.2the principlesatomic absorption spectrometry (aas) is a technique for measuring quantities ofchemical elements present in environmental samples by measuring the absorbedradiation by the chemical element of interest. this is done by reading the spectraproduced when the sample is excited by radiation. the atoms absorb ultraviolet orvisible light and make transitions to higher energy levels . the concentration is calculated based on the beer-lambert law. absorbance isdirectly proportional to the concentration of the analyte absorbed for the existingset of conditions. the concentration is usually determined from a calibration curve,obtained using standards of known concentration. calibration curve method: preparestandard solutions of at least three different concentrations, measure the absorbanceof these standard solutions, and prepare a calibration curve from the values obtained.then measure the absorbance of the test solution adjusted in concentration to ameasurable range, and determine the concentration of the element from the calibrationcurve. part 2 the materials and apparatus part 3 the procedure3.1 operating procedure for aas (2) install required hollow cathode lamp. select “t” before turning to the powerand hollow cathode lamp. then select appropriate la mp current and preheat for 30min.(3) make sure electrical meter to point to zero and then turn on high-voltagepower.(4) select appropriate slit width.(5) rotate monochromator and select required wavelength. if the power meter istoo high or low, adjust negative high voltage until the meter reads full scale.(6) adjust light point and wavelength so that the meter represents the maximumvalue.(8) inject distilled water into the flame and continue to preheat the burner.inject distilled water into the flame after each sample.(9) select “e”, inject blank solution into the flame and adjust the meter tozero.(10) optimize analysis conditions and measure standard solution and samples.(12) select “t” before turning off high voltage power, decrease lamp currentand then turn off the lamp. at the same time, all buttons should be on originalpositions.(13) check the equipment before leaving the laboratory.3.2 determination of soil samples (1) preparation of extracting solution (0.05 mol/l edta solution) 18.6 g of edta is dissolved with water in a beaker (500 ml). the ph is adjustedto 7.0 using dilute ammonia. the mixture is transferred into a volumetric flask(1000ml), dilute to the mark and mixed well.(2) treatment of soil samples 2.50 g of air-dried soil (60- 100 mesh) is put into an erlenmeyer flask withstopper (100 ml). 12.5 ml of edta solution is added. the mixture is shaken for 1hand then filtered. the filtrate is preserved for analysis.(3) preparation of cu standard stock solution 0.10 g of cu is dissolved in 15 ml of (1:1) nitric acid solution. the mixtureis transferred into a volumetric flask (1000 ml) and diluted to the mark withre-distilled water. the concentration of the stock standard solution is 100g/ml. (theconcentration should be calculated according to the mass of cu).the working custandard solution (10μg/ml) is obtained by diluting 10 ml of cu standard stocksolution to 100 ml with re-distilled water.(4) plotting of the standard curve 0 ml, 1 ml, 2 ml, 3 ml, 4 ml and 5 ml of cu standard solution (10μg/ml) are addedrespectively to 6 volumetric flask (10 ml) with 1 ml of 5 mol/l hydrochloric acid.the mixture is diluted with re-distilled water and mixed well to give 0μg/ml, 1.00μg/ml,2.00μg/ml, 3.00μg/ml, 4.00μg/ml, 5.00μg/ml of cu, respectively. theabsorbance is measured at wavelengths of 3247 ?. the standard curve is constructedby plotting absorbance vs. concentration.(5) determination of samples the sample solution is analyzed using the same procedure and conditions as forthe standard curve. the concentration of cu is obtained from the standard curve basedon the absorbance.part 4 the results4.1 the raw data 4.2 aas standard curve 4.3 calculationthe absorbance of sample is 0.0511. according to the formula above :y=0.0446x+0.0024,r2=0.9997 the concentration of cu in the sample is:1.091mg/l. part 5 discussionin this experiment, we use the aas to determine cu in soil. i learn how to operatethe aas and the limitation. in the experimental process, standard solution wasprepared in strict accordance with the experimental requirements and i learn how todeal with the data. finally we get the standard curve, then, the sample concentrationis calculated according to the absorbance of the sample. ultimately, we get the linear formula is y = 0.0446x + 0.0024 and r2=0.9997. fromaccording to the formula and the absorbance of cu in the sample is 0.0511, we drawthe concentration of cu in the sample is 1.091μg/ml. we have known that theconcentration of test sample measured by instrument is 1.091mg/l. we can say our result of experiment is so very accurate from the standard curveof cu and the value of r(r2=0.09997). the accurate data is due to the efforts of weeveryone. thanks for every members of our group.i have some suggestions for our experiments. firstly when we’ll do an experiment,we must prepare our pre-lab by ourselves and translate it into chinese .only do likethis, we can understand the experiment well. secondly we should prefer to solute theproblems in the experiment rather than ask for ta. finally, everyone should understandhis own task in the experiment.篇二:英文实验报告的格式和写法英文实验报告的格式和写法【转】2010-10-04 06:03 一份最标准的实验报告的格式:1. abstract2. introduction3. method4. results5. discussion6. conclusion7. reference分别来分享下近来学到的。

1、Spatial Distribution of Heavy Metals in Soil and Flora Associated with theGlass Industry in North Central India: Implications for Phytoremediation2、Heavy metal contamination of urban soil in an old industrial city (Shenyang)in Northeast China3、Spatial distribution of lead in the surface layers of mountain forest soils, anexample from the Karkonosze National Park, Poland4、Multivariate and spatial analysis of heavy metal sources and variations in alarge old antimony mine, China5、The effects of agricultural practice and land-use on the distribution and originof some potentially toxic metals in the soils of Golestan province, Iran6、Distribution of heavy elements in urban and rural surface soils: the Novi Sadcity and the surrounding settlements, Serbia7、Toxic heavy metal contamination and risk assessment of street dust in smalltowns of Shanghai suburban area, China8、Distribution of heavy metals in the sediments of agricultural fields adjacent tourban areas in Central Taiwan9、Investigation of potentially toxic heavy metals in different organic wastes usedto fertilize market garden crops10、Hazardous Heavy Metal Distribution in Dahuofang Catchment, Fushun,Liaoning, an Important Industry City in China: A Case Study11、The effects of the Qinghai-Tibet railway on heavy metals enrichment in soils12、 A Geostatistical Approach to Assess Concentration and Spatial Distribution ofHeavy Metals in Urban Soils13、Sources identification of heavy metals in urban topsoil from inside the Xi'anSecond Ringroad, NW China using multivariate statistical methods14、Impact of long-term wastewater irrigation on variability of soil attributes alonga landscape in semi-arid region of Iran15、Distribution of trace element contamination in sediments and riverineagricultural soils of the Zhongxin River, South China, and evaluation of local plants for biomonitoring16、Effects of pH and low molecular weight organic acids on competitiveadsorption and desorption of cadmium and lead in paddy soils17、Identification of heavy metal pollutants using multivariate analysis and effectsof land uses on their accumulation in urban soils in Beijing, China18、Influence of agricultural practice on trace metals in soils and vegetation in thewater conservation area along the East River (Dongjiang River), South China 19、Spatial distribution and controlling factors of heavy metals contents in paddysoil and crop grains of rice-wheat cropping system along highway in East China20、Distribution of Heavy Metals in Peri-Urban Agricultural Areas Soils21、Environmental risks of trace elements associated with long-term phosphatefertilizers applications: A review22、Speciative distribution and bioavailability of metals in agricultural soilsreceiving industrial wastewater23、Comprehensive Assessment Model on Heavy Metal Pollution in Soil24、Spatial Distribution and Risk Assessment of As, Cd, Cu, Pb, and Zn in Topsoilat Rayong Province, Thailand25、Influence of Traffic Activity on Heavy Metal Concentrations of RoadsideFarmland Soil in Mountainous Areas26、Accumulation and distribution characteristics of platinum group elements inroadside dusts in Beijing, China27、Source identification of eight hazardous heavy metals in agricultural soils ofHuizhou, Guangdong Province, China28、Mercury and Cadmium Contamination in Traffic Soil of Beijing, China29、Assessment of metals in fourteen species of vegetables and crops cultivated ina suburban area using multivariate analyses30、SOURCE IDENTIFICATION OF SOIL Cu, Zn, Pb, AND Cd FROMANTHROPOGENIC ACTIVITIES BY DECISION TREE ANALYSIS IN FUYANG COUNTY, CHINA31、Heavy metals assessment in urban soil around industrial clusters in Ghaziabad,India: Probabilistic health risk approach32、DISTRIBUTION AND FRACTIONATION OF HEA VY METALS IN SOILPROFILES IRRIGATED WITH WASTEWA TER FOR DIFFERENT PERIODS OF TIME33、HEA VY METAL POLLUTION IN RURAL AREA OF CHINA: A CASESTUDY OF POND SEDIMENTS FROM SIXIAN COUNTY, NORTHERNANHUI PROVINCE34、Assessment of Heavy Metal Accumulation in Urban Soil around PotashIndustrial Site in the East of the Dead Sea and their Environmental Risks 35、Identifying the cause of soil cadmium contamination with Monte Carlo massbalance modelling: a case study from Potosi, Bolivia36、Distribution of Pb, Cu, Ni and Zn in urban soils in Rome city (Italy): effect ofvehicles37、Use of portable X-ray fluorescence spectrometry for environmental qualityassessment of peri-urban agriculture38、Spatial distribution, source identification and affecting factors of heavy metalscontamination in urban-suburban soils of Lishui city, China39、Accumulation of trace elements in agricultural topsoil under differentgeological background40、Spatial distribution of heavy metals in soils of the Bafra plain in Turkey41、Assessment of Heavy Metal Pollution in Soil and Plants from Dunhua SewageIrrigation Area42、Effects of municipal solid waste compost and mineral fertilizer amendmentson soil properties and heavy metals distribution in maize plants (Zea mays L.)43、Geochemical assessment, distribution, and dynamics of trace elements inurban agricultural soils under long-term wastewater irrigation in Kano, northern Nigeria44、Distribution of Arsenic in Sewage Irrigation Area of Pearl River Delta, China45、Assessment of heavy metal contamination in soils around Balanagar industrialarea, Hyderabad, India46、Risk assessment of heavy metal contamination in soil and wild Libyan jirdMeriones libycus in Riyadh, Saudi Arabia47、Investigation of the origin and distribution of heavy metals around EbenezerDam, Limpopo Province, South Africa48、Heavy metals assessment and identification of their sources in agriculturalsoils of Southern Tehran, Iran49、Spatial variability of cropland lead and its influencing factors: A case study inShuangliu county, Sichuan province, China50、Vertical distribution of heavy metals in wastewater-irrigated vegetable gardensoils of three West African cities51、Determination of heavy metal levels in medicinal plant Hemerocallis minorMiller by X-ray fluorescence spectrometry52、Heavy metals in urban soils with various types of land use in Beijing, China53、Utilization of reclaimed wastewater for irrigation of field-grown melons bysurface and subsurface drip irrigation54、Soil Contamination at Dumpsites: Implication of Soil Heavy MetalsDistribution in Municipal Solid Waste Disposal System: A Case Study of Abeokuta, Southwestern Nigeria55、Arsenic, cadmium, and lead pollution and uptake by rice (Oryza sativa L.)grown in greenhouse56、Nickel: An Overview of Uptake, Essentiality and Toxicity in Plants57、Effects of Treated Wastewater Irrigation on Element Concentrations in Soiland Maize Plants。
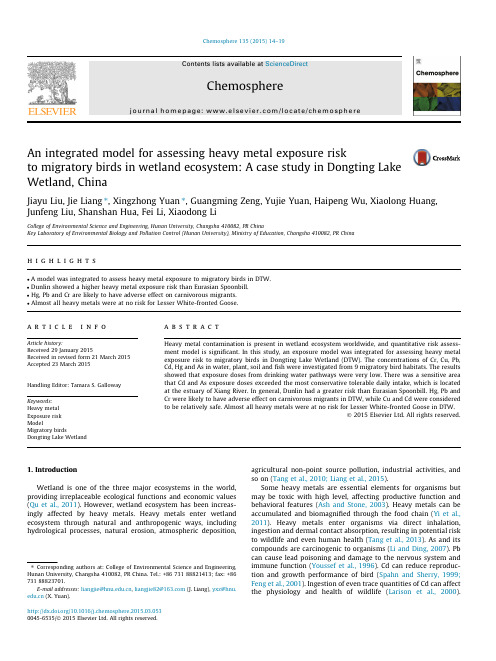
An integrated model for assessing heavy metal exposure riskto migratory birds in wetland ecosystem:A case study in Dongting Lake Wetland,ChinaJiayu Liu,Jie Liang ⇑,Xingzhong Yuan ⇑,Guangming Zeng,Yujie Yuan,Haipeng Wu,Xiaolong Huang,Junfeng Liu,Shanshan Hua,Fei Li,Xiaodong LiCollege of Environmental Science and Engineering,Hunan University,Changsha 410082,PR ChinaKey Laboratory of Environmental Biology and Pollution Control (Hunan University),Ministry of Education,Changsha 410082,PR Chinah i g h l i g h t sA model was integrated to assess heavy metal exposure to migratory birds in DTW. Dunlin showed a higher heavy metal exposure risk than Eurasian Spoonbill. Hg,Pb and Cr are likely to have adverse effect on carnivorous migrants. Almost all heavy metals were at no risk for Lesser White-fronted Goose.a r t i c l e i n f o Article history:Received 29January 2015Received in revised form 21March 2015Accepted 23March 2015Handling Editor:Tamara S.Galloway Keywords:Heavy metal Exposure risk ModelMigratory birdsDongting Lake Wetlanda b s t r a c tHeavy metal contamination is present in wetland ecosystem worldwide,and quantitative risk assess-ment model is significant.In this study,an exposure model was integrated for assessing heavy metal exposure risk to migratory birds in Dongting Lake Wetland (DTW).The concentrations of Cr,Cu,Pb,Cd,Hg and As in water,plant,soil and fish were investigated from 9migratory bird habitats.The results showed that exposure doses from drinking water pathways were very low.There was a sensitive area that Cd and As exposure doses exceeded the most conservative tolerable daily intake,which is located at the estuary of Xiang River.In general,Dunlin had a greater risk than Eurasian Spoonbill.Hg,Pb and Cr were likely to have adverse effect on carnivorous migrants in DTW,while Cu and Cd were considered to be relatively safe.Almost all heavy metals were at no risk for Lesser White-fronted Goose in DTW.Ó2015Elsevier Ltd.All rights reserved.1.IntroductionWetland is one of the three major ecosystems in the world,providing irreplaceable ecological functions and economic values (Qu et al.,2011).However,wetland ecosystem has been increas-ingly affected by heavy metals.Heavy metals enter wetland ecosystem through natural and anthropogenic ways,including hydrological processes,natural erosion,atmospheric deposition,agricultural non-point source pollution,industrial activities,and so on (Tang et al.,2010;Liang et al.,2015).Some heavy metals are essential elements for organisms but may be toxic with high level,affecting productive function and behavioral features (Ash and Stone,2003).Heavy metals can be accumulated and biomagnified through the food chain (Yi et al.,2011).Heavy metals enter organisms via direct inhalation,ingestion and dermal contact absorption,resulting in potential risk to wildlife and even human health (Tang et al.,2013).As and its compounds are carcinogenic to organisms (Li and Ding,2007).Pb can cause lead poisoning and damage to the nervous system and immune function (Youssef et al.,1996).Cd can reduce reproduc-tion and growth performance of bird (Spahn and Sherry,1999;Feng et al.,2001).Ingestion of even trace quantities of Cd can affect the physiology and health of wildlife (Larison et al.,2000)./10.1016/j.chemosphere.2015.03.0530045-6535/Ó2015Elsevier Ltd.All rights reserved.⇑Corresponding authors at:College of Environmental Science and Engineering,Hunan University,Changsha 410082,PR China.Tel.:+8673188821413;fax:+8673188823701.E-mail addresses:liangjie@ ,liangjie82@ (J.Liang),yxz@ (X.Yuan).Methylmercury can be bioaccumulated and biomagnified through the food chain,and chronic dietary exposure to small concentra-tions can impair reproduction of bird(Liu et al.,2008;Frederick and Jayasena,2010).Moreover,feces can accumulate heavy metals at higher concentrations than diet items(Morrissey et al.,2005).As a result,pollution may transfer to another place through feces of migrants(Liang et al.,2015).Heavy metal exposure risk to birds in wetland ecosystem is an international issue(Cui et al.,2011; Salamat et al.,2014).Although great efforts have been undertaken to show the severity of heavy metal contamination and analyze potential ecological risk in wetlands,few studies have quantita-tively evaluated exposure risk to wetland birds.Morrissey et al.(2005)assessed heavy metal exposure to American Dipper through food ingestion,while exposure from water and soil ingestion was ignored.For thefirst time,we systematically integrated a comprehensive risk model to evaluate heavy metal exposure to migrants in wetland ecosystem,con-sidering food,water and soil exposure pathways.Furthermore,an uncertainty factor was employed to account for the uncertainty of risk model and differences in sensitivity among species(CCME, 1998).Although the model already exists,it is seldom employed for exposure risk assessment.Moreover,the existing model has been 2.Materials and methods2.1.Study areaDongting Lake,the second largest freshwater lake in China, covers about2820km2(approximately28°300–29°380N,112°180–113°150E)in the northern part of Hunan Province on the middle and lower reaches of Yangtze River(Wu et al.,2013).The lake lies in the subtropical monsoon climate zone with abundant precipitation and longtime sunshine.Annual precipitation is approximately1100–1400mm,mainly between April and September.The mean depth is6–7m,and the hydrology cycle is about18d.It is recorded that the average annual temperature is 16.4–17.0°C and the frost-free period is259–277d.Wet season lasts from May to October,and dry season runs from November to March.The Three Gorges Dam impounds during wet season and then supplies water for the lake during dry season(Wu et al.,2015).Dongting Lake has both storage and release function with the characteristic of water carrying.During wet season,the water level rises with big volume of water body,drawing water from four tributaries(Yuan River,Xiang River,Zi River and Li River)and overwhelming the marshlands.The water area shrinksSampling sites in DTW,mid-south China.S1,S2and S3are located at West DTW.S4,S5and S6are located at South DTW.S7,S8and S9are located atJ.Liu et al./Chemosphere135(2015)14–1915Dongting Lake National Nature Reserve Authority,131species of aquatic plants,117species of freshwaterfish and340species of waterfowls with39species listing in the international Redbook have been recorded in East DTW.Moreover,there are about 130000migratory birds and more than70%of Lesser White-fronted Goose(Anser erythropus)in the world wintering in East DTW each year(Yuan et al.,2014).2.2.Sample collection and treatmentIn January2014,water,fish,plant and soil samples were col-lected from9main migratory bird habitats in the study area, where migratory birds are widely distributed(Fig.1).Water samples were collected by the lake in500mL acid-washed polyethylene bottles,acidified with1mL HNO3and stored at4°C.Twenty smallfish(with a length of about10cm) were collected at each sampling site.Samples were kept in an ice foam box,took back to the laboratory and subsequently washed with ultrapure water.Four samples of newly grown plant and the top soil(5cm in thickness)were collected from each sampling site,refrigerated with polyethylene bags.Fish and soil samples were stored atÀ20°C for measuring.All water,fish,plant and soil samples were collected in a50m2area from each site.2.3.Analytical methods and quality control5mL HNO3and7mL mixed acid(HNO3:HClO4=5:2)were added in acidified water samples for digestion.Fish,plant and soil samples were dried in an oven at90°C until constant weight.Fish samples were homogenized with a porcelain mortar. 1.000g preprocessedfish samples were accurately weighed and then transferred to50mL conicalflasks.Samples were added with 10mL mixed acid(HNO3:HClO4=9:1)and soaked overnight for digestion.The digested samples were diluted to afinal volume of 50mL with ultrapure water and thenfiltrated through a0.45-l m organic membrane.Plant samples were powdered with a high-speed grinder.0.500g preprocessed samples were accurately weighed and then transferred to airtight Teflon vessels,added with 12mL mixed acids(HNO3:HClO4=3:1)for digestion using the intelligent graphite digestion(SISP DS-360,China).Soil samples were ground gently,sieved with100mesh sieve for homogeniza-tion.Precise0.500g preprocessed samples were weighted and transferred to airtight Teflon vessels,added with10mL HCl and then13mL mixed acid(HNO3:HF:HClO4=5:5:3)for digestion using the intelligent graphite digestion.The Atom Absorption Spectrophotometer(AAS,PE AAnalyst 700,USA)was used to analyze Cr,Cu,Pb and Cd.Hg and As were measured by the Atomic Fluorescence Spectrophotometer(AFS, AFS-9700,China).Sample duplicates,method blanks and standard reference materials were used to validate the results of each batch of samples.The analytical precision was conducted with repetitive rate of10%.The recoveries of standard samples in digestion process ranged from95%to105%.2.4.Integrated exposure risk assessment model2.4.1.Exposure assessmentThe exposure model has been systematically integrated in an effort to quantify the risk of species exposure to chemicals in the surrounding environment.As dermal contact and inhalation routes of wildlife exposure are usually ignored,we consider contaminant exposure through oral ingestion of environmental medium(Suter, 2011).Besides,food composition and daily movement of migratory birds were not considered in the model.Therefore,an external measurement based exposure model for quantifying heavy metal risk to migratory birds can be calculated as follows.I df¼0:648BW0:651ð1Þwhere I df is food consumption rate(dry weight)(g dÀ1);BW is body-weight of selected birds(g).Food consumption rates are estimated from allometric regression models(Nagy,1987).BW(average body weight)of2000g was chosen for Eurasian Spoonbill or Lesser White-fronted Goose,and60g for Dunlin.I W¼59BW0:67ð2Þwhere I w is water consumption rate(mL dÀ1),and the unit of BW is kg.Water consumption rates are also estimated from allometric regression models(Calder and Braun,1983).I s¼PÂI dfð3Þwhere I s is soil consumption rate(g dÀ1)and P is the proportion of soil accounted food.In this study,P(18%)of Western Sandpipers (Calidris mauri)was chosen for Eurasian Spoonbill and Dunlin.8.2%of Canada Goose(Branta canadensis)was chosen for Lesser White-fronted Goose(Beyer et al.,1994).E j¼X mi¼1ðI iÂC ijÞ=BWð4Þwhere E j is oral exposure dose of heavy metal(j)(mg kgÀ1dÀ1);m is the number of absorbing medium(for example:food,water or soil);I i is the absorptivity of medium(i)(g dÀ1or mL dÀ1);and C ij is concentration of metal(j)in medium(i)(mg kgÀ1or mg LÀ1).2.4.2.Risk characterizationPotential exposure risk to species is evaluated by comparing the estimated elemental intake dose to tolerable daily intake(TDI).TDI is an estimate of a substance that is not anticipated to result in adverse effect.TDI j¼ðLOAEL jÂNOAEL jÞ0:5=UFð5Þwhere TDI j is tolerable daily intake of heavy metal(j)(mg kgÀ1dÀ1); LOAEL j is the lowest observed adverse effect level of heavy metal(j) (mg kgÀ1dÀ1);NOAEL j is no observed adverse effect level(mg kgÀ1 dÀ1).LOAEL and NOAEL for avian toxicity tests were taken from toxicological benchmarks for wildlife(Sample et al.,1996).UF is uncertainty factor.The selection of UF value may not be less than 10for extrapolating to a long-term exposure concentration without an effect,and may be higher than10depending on the substance, type,amount and quality of data available(CCME,1998).In the presented study,UF=10was chosen as the most conservative TDI (mc TDI).The most dangerous TDI(md TDI)is gained when the value of UF is100.Refer to human health risk assessment model,hazard quotient (HQ)has been employed to estimate the exposure risk to birds (USEPA,2001;MEPPRC,2014).HQ j¼E j=TDI jð6Þwhere HQ j is the hazard quotient of heavy metal(j).If HQ<1,it is considered that the exposed population is unlikely to experience adverse effect,whereas if HQ>1,negative effect on population may occur.Refer to grades of geo-accumulation index for assessing heavy metal contamination in sediments(Müller,1969),heavy metal exposure risk to birds was divided into four levels:no risk (HQ<1),low risk(1<HQ<2),moderate risk(2<HQ<3)and high risk(HQ>3),respectively.16J.Liu et al./Chemosphere135(2015)14–193.Results and discussion3.1.Statistics of heavy metal concentrationsThe concentrations of six heavy metals in water,fish,plant and soil from DTW are shown in Table1.The contents of heavy metals in water were all lower than class I of Chinese environmental quality standards for surface water.However,most of the concen-trations in soils exceeded the background values of DTW except for Cr.This was consistent with previous studies(Li et al.,2014;Lianget al.,2015).This phenomenon of low concentration in water but high contamination in soil was primarily due to sedimentation and ingestion by aquaticflora and fauna.The result was accordant with previous work(Fu et al.,2014).Besides,heavy metals have low solubility in water.Heavy metals in water bodies can be adsorbed by surface sediment(Olivares-Rieumont et al.,2005). 3.2.Heavy metal exposure doses to migratory birdsThe values of mc TDI and md TDI are calculated according to Eq.(6)and showed in Table2.Exposure doses of Cr,Cu,Pb,Cd,Hg and As to Eurasian Spoonbill,Dunlin and Lesser White-fronted Goose are presented in Fig.2.Drinking water exposure pathway has been ignored in this study because of low concentration.In general,two carnivorous migrants presented similar results.Dunlin showed relatively higher exposure dose than Eurasian Spoonbill,demon-strating birds with lighter weight mostly have higher exposure rge animals have more food and water consumption but lower metabolic rate than small animals.Therefore,unit weight of small animals has higher oral exposure(Suter,2011).Fig.2also shows that heavy metal concentrations in soil and soil consump-tion rate had a great influence on migrants in DTW.Only consider food exposure is incomplete.Both food and soil exposure should be taken into account when evaluating birds exposure risk.For Eurasian Spoonbill and Dunlin,Cr exposure doses all exceeded md TDI.Fish exposure doses were both lower than mc TDI while total exposure doses were over mc TDI due to relatively higher soil exposure doses of Cr.Cu exposure doses were almost under mc TDI.Fish exposure of Cu to Eurasian Spoonbill was under md TDI,demonstrating Cu exposure byfish intake was rela-tively safe.Pb exposure doses all exceeded md TDI.Total exposure doses were all over mc TDI.Soil exposure doses were in a large range,implying that the distribution of Pb was uneven in DTW, and Pb probably had various sources such as chemical industries and smelting plants(Liang et al.,2015).Cd exposure doses were all lower than mc TDI.Both food and soil exposure doses to Eurasian Spoonbill and Lesser White-fronted Goose were even less than md TDI.An outlier(S5)was found within soil exposure doses.It is located at Hengling Lake,the estuary of Xiang River which is the most serious contamination area of DTW(Liang et al.,2015).As the total exposure dose of Cd was higher than mc TDI for Dunlin in this region,negative effect on migratory birds living here may occur.Almost all Hg exposure doses to Eurasian Spoonbill and Dunlin exceeded mc TDI.Justfish exposure pathway could cause a significant impact on carnivorous migrants in DTW.Wiener and Spry(1996)showed that freshwater fish could accumulate methylmercury with high assimilation.Hg exposure doses offish varied widely,perhaps because different species offish have different bioaccumulation capacities of Hg. Exposure doses of Hg to Lesser White-fronted Goose were lower than mc TDI.Concentrations of Hg in plant samples were not detected,and the exposure pathway was mainly from soil. Feature of As exposure to carnivorous migrants was special.Fish exposure pathway of As was very safe.There was also an outlier, which exceeded mc TDI.It is located at Hengling Lake(S5)as well as Cd.Therefore,this region is demonstrated to be at risk as one of waterfowl habitats.Attentions should be taken and strategies should be designed to control the effects of heavy metal pollution on waterfowls and the ecosystem in this area.3.3.Heavy metal exposure risk to migratory birdsHQ s of the three studied birds from DTW are presented in Fig.3. For Eurasian Spoonbill and Dunlin,risk of six heavy metals was decreased in the following sequence:Hg>Pb>Cr>As>Cu>Cd. The result was generally consistent with that of sediment from DTW in previous studies because of the high soil consumption rate (Liang et al.,2015).However,Cd was shown the highest risk in soil but the lowest risk to migrants,probably due to its higher TDI for migrants.Dunlin had a greater risk than Eurasian Spoonbill.High risk of Hg,Pb and Cr was presented to Dunlin with7.92,5.74and3.66 of HQ,respectively.Moderate risk of Hg was presented to Eurasian Spoonbill.Low risk of Cr and Pb was presented to Eurasian Spoonbill as well as Cu and As to Dunlin.No risk of Cu, Cd and As was presented to Eurasian Spoonbill as well as Cd to Dunlin.Only Cd was shown no risk to both Eurasian Spoonbill and Dunlin.On the whole,Hg,Pb and Cr were most likely to have adverse effect on carnivorous migratory birds perched in DTW.Cu and Cd were considered to be relatively safe.In addition,benthic invertebrates,such as shrimp and screw,are also diet composition and prey for waterfowls.The overall risk of carnivorous migrants may be higher when considering benthic invertebrates,which may accumulate more heavy metals(Morrissey et al.,2005).For Lesser White-fronted Goose,heavy metal exposure risk was decreased in the following sequence:Pb>Cu>Cr>Hg>As>Cd. All elements were at no risk except Pb.It was due to its higher concentration in plants of DTW,and Pb exposure dose to Lesser White-fronted Goose exceeded mc TDI.In addition,compared with Eurasian Spoonbill,Lesser White-fronted Goose had higher plant ingestion exposure dose of Pb.However,the total exposure dose was almost the same due to different soil consumption rates, which were18%for Eurasian Spoonbill and8.2%for Lesser White-fronted Goose,respectively.Thus,the parameter selectionTable1Average concentrations of heavy metals infish,water and sediment from DLW.Water(mg LÀ1)Fish(mgkgÀ1,dw c)Plant(mgkgÀ1,dw c)Sediment(mg kgÀ1,dw c)CV a St b CV a BV dCr0.0040.01 2.82±1.02 1.84±1.7370.62±7.7083.92 Cu0.010.01 1.47±0.3016.18±2.9240.13±13.5825.00 Pb0.0030.01 2.95±2.008.73±1.8357.41±30.4727.75 Cd0.00010.0010.63±0.550.50±0.31 4.06±5.900.23 Hg0.000020.000050.06±0.04–0.22±0.150.07 As0.00420.050.16±0.19 1.02±1.0324.30±22.4513.41a CV:concentration value.b St:Chinese environmental quality standards for surface water,class I.c dw:dry weight.d BV:the background values of heavy metals in sediments from DTW(Liang et al., 2015).Table2Toxicity parameters of NOAEL and LOAEL,most conservative tolerable daily intake (mc TDI)and most dangerous tolerable daily intake(md TDI)of heavy metals(mg kgÀ1 dÀ1).Cr Cu Pb Cd Hg AsNOAEL 3.2811.7 1.13 1.450.0064 2.46 LOAEL13.1415.411.3200.0647.38 mcTDI0.66 1.340.360.540.0020.43 mdTDI0.0660.1340.0360.0540.00020.043J.Liu et al./Chemosphere135(2015)14–1917of soil consumption rate influences the model evidently.In heavy metal exposure risk to herbivorous migratory birds relatively safer than carnivorous ones in DTW.4.ConclusionAn exposure risk assessment model for evaluating heavy exposure risk to migratory birds in wetland ecosystem had integrated and applied.Water,fish,plant and soil samples collected to quantitatively analyze heavy metal exposure three representative migratory birds.Dunlin showed a relatively higher exposure dose and risk than Eurasian Spoonbill.exposure doses were very low while soil environment and soil consumption rate had a great influence on migrants DLW.The estuary of Xiang River was the most serious ination area where Cd and As exceeded mc TDI .Negative waterfowl may occur in this region that should take Fish,plant,soil and total exposure doses of heavy metals to migratory birds in DTW:(a)for Eurasian Spoonbill,(b)for Dunlin and (c)for Lesser White-fronted exposure dose via fish-eating pathway;E plant :exposure dose via plant-eating pathway;E soil :exposure dose via soil pathway;E total :exposure dose via both food pathways.3.Average hazard quotient (HQ )of six heavy metals in each habitat for Eurasian Spoonbill,Dunlin and Lesser White-fronted Goose in DTW.(a)For Eurasian Spoonbill,(b)for Dunlin and (c)for Lesser White-fronted Goose.Error bars represent the standard errors.attention.Risk to migratory birds in DTW was decreased in follow-ing sequence:Hg>Pb>Cr>As>Cu>Cd for carnivorous migratory birds and Pb>Cu>Cr>Hg>As>Cd for herbivorous ones,respec-tively.In general,Hg,Pb and Cr were likely to have adverse effect on carnivorous migrants in DTW,while Cu and Cd were considered to be relatively safe.Heavy metal exposure risk to herbivorous migrants was safer than carnivorous ones with almost all HQ of selected heavy metals were below1in each habitat in DTW.The model employed is demonstrated to be effective for expo-sure risk assessment,and the results are considered to be useful in developing migratory birds conservation strategies in DTW ecosystem.However,this study does not consider the diet composition of carnivorous migrants,and the real risk might be higher when considering benthic invertebrates. AcknowledgementsThis research wasfinancially supported by the National Natural Science Foundation of China(51479072,51009063,51039001),the State Council Three Gorges Project Construction Committee Projects(SX2010-026),the National Key Science and Technology Project for Water Environmental Pollution Control (2009ZX07212-001-06),the Dongting Lake Water Resources Administration Bureau of Hunan Province Projects(DGJ-KY-2013-05)and the New Century Excellent Researcher Award Program (NCET-08-0181)from Ministry of Education of China. ReferencesAsh,C.,Stone,R.,2003.A question of dose.Science300,925.Beyer,W.N.,Connor,E.E.,Gerould,S.,1994.Estimates of soil ingestion by wildlife.J.Wildl.Manag.58,375–382.Calder3rd,W.A.,Braun,E.J.,1983.Scaling of osmotic regulation in mammals and birds.Am.J.Physiol–Reg.I.244,R601–R606.CCME,1998.Protocol for the Derivation of Canadian Tissue Residue Guidelines for the Protection of Wildlife that Consume Aquatic Biota.Canadian Council of Ministers of the Environment,Winnipeg.Cui,B.S.,Zhang,Q.J.,Zhang,K.J.,Liu,X.H.,Zhang,H.G.,2011.Analyzing trophic transfer of heavy metals for food webs in the newly-formed wetlands of the Yellow River Delta,China.Environ.Pollut.159,1297–1306.Feng,J.,Yue,X.Y.,Feng,Z.G.,2001.Pathology of experimental Cd poisoning in broiler chickens.Acta Vet.Zootech.Sin.32,468–475.Frederick,P.,Jayasena,N.,2010.Altered pairing behaviour and reproductive success in white ibises exposed to environmentally relevant concentrations of methylmercury.Proc.R.Soc.B278,1851–1857.Fu,J.,Wang,Q.,Wang,H.,Yu,H.X.,Zhang,X.W.,2014.Monitoring of non-destructive sampling strategies to assess the exposure of avian species in Jiangsu Province,China to heavy metals.Environ.Sci.Pollut.Res.21,2898–2906.Larison,J.R.,Likens,G.E.,Fitzpatrick,J.W.,Crock,J.G.,2000.Cadmium toxicity among wildlife in the Colorado Rocky Mountains.Nature406,181–183.Li,F.,Ding,C.Q.,2007.Effects of heavy metal pollution on birds.Acta Ecol.Sin.27, 296–303.Li,F.,Huang,J.H.,Zeng,G.M.,Huang,X.L.,Li,X.D.,Liang,J.,Wu,H.P.,Wang,X.Y.,Bai,B.,2014.Integrated source apportionment,screening risk assessment,and riskmapping of heavy metals in surface sediments:a case study of the Dongting Lake,Middle China.Hum.Ecol.Risk Assess.20,1213–1230.Li,F.,Huang,J.H.,Zeng,G.M.,Yuan,X.Z.,Li,X.D.,Liang,J.,Wang,X.Y.,Tang,X.J.,Bai,B.,2013.Spatial risk assessment and sources identification of heavy metals insurface sediments from the Dongting Lake,Middle China.J.Geochem.Explor.132,75–83.Liang,J.,Liu,J.Y.,Yuan,X.Z.,Zeng,G.M.,Lai,X.,Li,X.D.,Wu,H.P.,Yuan,Y.J.,Li,F., 2015.Spatial and temporal variation of heavy metal risk and source in sediments of Dongting Lake wetland,mid-south China.J.Environ.Sci.Health A 50,100–108.Liu,G.L.,Cai,Y.,Philippi,T.,Kalla,P.,Scheidt,D.,Richards,J.,Scinto,L.,Appleby,C., 2008.Distribution of total and methylmercury in different ecosystem compartments in the Everglades:Implications for mercury bioaccumulation.Environ.Pollut.153,257–265.MEPPRC,2014.Technical guidelines for risk assessment of contaminated sites(HJ25.3–2014).Ministry of Environmental Protection of the People’s Republic ofChina,Beijing(in Chinese).Morrissey, C.A.,Bendell-Young,L.I.,Elliott,J.E.,2005.Assessing trace-metal exposure to American dippers in mountain streams of southwestern British Columbia,Canada.Environ.Toxicol.Chem.24,836–845.Müller,G.,1969.Index of geoaccumulation in sediments of the Rhine River.Geochem.J.2,108–118.Nagy,K.A.,1987.Field metabolic rate and food requirement scaling in mammals and birds.Ecol.Monogr.57,111–128.Olivares-Rieumont,S.,de la Rosa,D.,Lima,L.,Graham,D.W.,Alessandro,K.D’., Borroto,J.,Martínez,F.,Sánchez,J.,2005.Assessment of heavy metal levels in Almendares River sediments-Havana City,Cuba.Water Res.39,3945–3953. Qu,C.,Chen,S.W.,Bi,J.,Huang,L.,Li,F.Y.,2011.Ecological risk assessment of pesticide residues in Taihu Lake wetland,China.Ecol.Model.222,287–292. Salamat,N.,Etemadi-Deylami,E.,Movahedinia,A.,Mohammadi,Y.,2014.Heavy metals in selected tissues and histopathological changes in liver and kidney of common moorhen(Gallinula chloropus)from Anzali Wetland,the south Caspian Sea,Iran.Ecotoxicol.Environ.Saf.110,298–307.Sample,B.E.,Opresko,D.M.,Suter II,G.W.,1996.Toxicological Benchmarks for Wildlife:1996Revision,Oak Ridge National Laboratory.Spahn,S.A.,Sherry,T.W.,1999.Cadmium and lead exposure associated with reduced growth rates,poorerfledging success of Little Blue Heron Chicks (Egretta caerulea)in South Louisiana Wetlands.Arch.Environ.Contam.Toxicol.37,377–384.Suter II,G.W.,2011.Ecological Risk Assessment,second ed.Higher Education Press, Beijing(in Chinese).Tang,Q.,Liu,G.J.,Zhou, C.C.,Zhang,H.,Sun,R.Y.,2013.Distribution of environmentally sensitive elements in residential soils near a coal-fired power plant:potential risks to ecology and children’s health.Chemosphere 93,2473–2479.Tang,W.Z.,Shan, B.Q.,Zhang,H.,Mao,Z.P.,2010.Heavy metal sources and associated risk in response to agricultural intensification in the estuarine sediments of Chaohu Lake Valley,East China.J.Hazard.Mater.176,945–951. USEPA,2001.Supplemental guidance for developing soil screening levels for superfund sites(OSWER9355.4–24).US Environmental Protection Agency, Washington DC.Wiener,J.G.,Spry,D.J.,1996.Toxicological significance of mercury in freshwater fish.Environ.Contamin.Wildl.:Inter.Tissue Concent.,297–339Wu,H.P.,Zeng,G.M.,Liang,J.,Guo,S.L.,Dai,J.,Lu,L.H.,Wei,Z.,Xu,P.,Li,F.,Yuan,Y.J., He,X.X.,2015.Effect of early dry season induced by the three Gorges Dam on the soil microbial biomass and bacterial community structure in the Dongting Lake wetland.Ecol.Indic.53,129–136.Wu,H.P.,Zeng,G.M.,Liang,J.,Zhang,J.C.,Cai,Q.,Huang,L.,Li,X.D.,Zhu,H.N.,Hu,C.X.,Shen,S.,2013.Changes of soil microbial biomass and bacterial communitystructure in Dongting Lake:Impacts of50,000dams of Yangtze River.Ecol.Eng.57,72–78.Yi,Y.J.,Yang,Z.F.,Zhang,S.H.,2011.Ecological risk assessment of heavy metals in sediment and human health risk assessment of heavy metals infishes in the middle and lower reaches of the Yangtze River basin.Environ.Pollut.159, 2575–2585.Youssef,S.A.H.,El-Sanousi, A.A.,Afifi,N.A.,El-Brawy, A.M.A.,1996.Effect of subclinical Lead toxicity on the immune response of chickens to Newcastle disease virus vaccine.Res.Vet.Sci.60,13–16.Yuan,Y.J.,Zeng,G.M.,Liang,J.,Li,X.D.,Li,Z.W.,Zhang,C.,Huang,L.,Lai,X.,Lu,L.H., Wu,H.P.,Yu,X.,2014.Effects of landscape structure,habitat and human disturbance on birds:a case study in East Dongting Lake wetland.Ecol.Eng.67, 67–75.J.Liu et al./Chemosphere135(2015)14–1919。
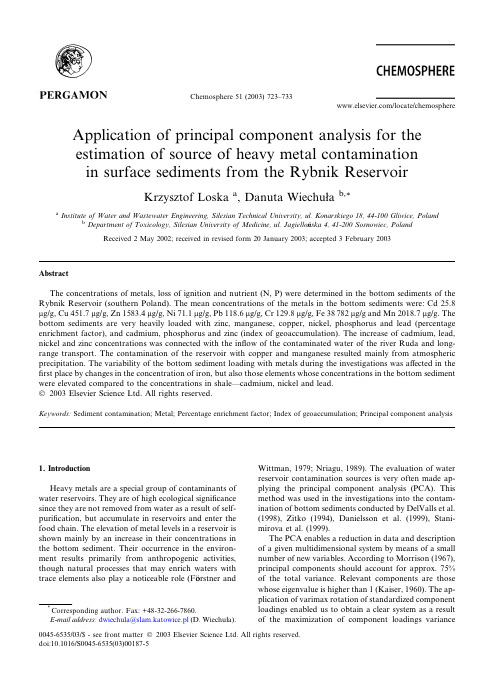
Application of principal component analysis for the estimation of source of heavy metal contamination in surface sediments from the Rybnik ReservoirKrzysztof Loska a ,Danuta Wiechułab,*aInstitute of Water and Wastewater Engineering,Silesian Technical University,ul.Konarskiego 18,44-100Gliwice,PolandbDepartment of Toxicology,Silesian University of Medicine,ul.Jagiello nska 4,41-200Sosnowiec,Poland Received 2May 2002;received in revised form 20January 2003;accepted 3February 2003AbstractThe concentrations of metals,loss of ignition and nutrient (N,P)were determined in the bottom sediments of theRybnik Reservoir (southern Poland).The mean concentrations of the metals in the bottom sediments were:Cd 25.8l g/g,Cu 451.7l g/g,Zn 1583.4l g/g,Ni 71.1l g/g,Pb 118.6l g/g,Cr 129.8l g/g,Fe 38782l g/g and Mn 2018.7l g/g.The bottom sediments are very heavily loaded with zinc,manganese,copper,nickel,phosphorus and lead (percentage enrichment factor),and cadmium,phosphorus and zinc (index of geoaccumulation).The increase of cadmium,lead,nickel and zinc concentrations was connected with the inflow of the contaminated water of the river Ruda and long-range transport.The contamination of the reservoir with copper and manganese resulted mainly from atmospheric precipitation.The variability of the bottom sediment loading with metals during the investigations was affected in the first place by changes in the concentration of iron,but also those elements whose concentrations in the bottom sediment were elevated compared to the concentrations in shale––cadmium,nickel and lead.Ó2003Elsevier Science Ltd.All rights reserved.Keywords:Sediment contamination;Metal;Percentage enrichment factor;Index of geoaccumulation;Principal component analysis1.IntroductionHeavy metals are a special group of contaminants of water reservoirs.They are of high ecological significance since they are not removed from water as a result of self-purification,but accumulate in reservoirs and enter the food chain.The elevation of metal levels in a reservoir is shown mainly by an increase in their concentrations in the bottom sediment.Their occurrence in the environ-ment results primarily from anthropogenic activities,though natural processes that may enrich waters withtrace elements also play a noticeable role (F €orstner and Wittman,1979;Nriagu,1989).The evaluation of water reservoir contamination sources is very often made ap-plying the principal component analysis (PCA).This method was used in the investigations into the contam-ination of bottom sediments conducted by DelValls et al.(1998),Zitko (1994),Danielsson et al.(1999),Stani-mirova et al.(1999).The PCA enables a reduction in data and description of a given multidimensional system by means of a small number of new variables.According to Morrison (1967),principal components should account for approx.75%of the total variance.Relevant components are those whose eigenvalue is higher than 1(Kaiser,1960).The ap-plication of varimax rotation of standardized component loadings enabled us to obtain a clear system as a result of the maximization of component loadingsvarianceChemosphere 51(2003)723–733/locate/chemosphere*Corresponding author.Fax:+48-32-266-7860.E-mail address:dwiechula@slam.katowice.pl (D.Wiechuła).0045-6535/03/$-see front matter Ó2003Elsevier Science Ltd.All rights reserved.doi:10.1016/S0045-6535(03)00187-5and elimination of invalid components(Chakrapani and Subramanian,1993;Borovec,1996).This paper presents the concentrations of13elements in the bottom sediment of the Rybnik Reservoir which is located in the centre of the Rybnik Coal Region,one of the main industrial centres of Poland.The development of industry in the Rybnik region started in the19th century.One of thefirst branches were ferrous metal-lurgy and exploration of coal deposits whichfinally re-sulted in the mining of hard coal.There were also brickyards,mills,breweries and tanyards.In the20th century,Rybnik became the centre of the Rybnik Coal Region which included several hard coal mines.It also houses numerous coking and briquetting plants,and companies producing machinery,metals,chemicals and building materials.The concentration of industry in this area places Rybnik as the third Polish city in respect of the emission of gaseous contaminants(mainly CO2,SO2and NO x) (7942.8Â103t/year,1998)and thefifth city in respect of the amount of industrial solid waste produced(4422.9Â103t/year,1998)(Environment,1999).In1972,the Rybnik Power Station and the Rybnik Reservoir were constructed in the Rybnik Coal Region.The reservoir is intended for cooling condensers and replenishing the closed cycle of the station with water(Kozłowski et al., 1981).It also became a very attractive recreational centre for local residents,and functions asflood control. The reservoir also takes in the contaminants carried by the river Ruda and its left tributary,the river Nacyna. Thus,it may be assumed that wastewater contamina-tion,apart from the direct impact of the industrial contamination caused by the Rybnik Coal Region and long-range transport from the Upper-Silesian Industrial Region and Karwin Basin in the Czech Republic,affects the loading of the reservoir.2.Materials and methodsThe research was carried out on the bottom sedi-ments from the Rybnik Reservoir taken at9sampling stations––Fig.1.The bottom sediment samples were taken over the interval of August1991–July1997,applying an Birge–Ekman sampler which was equipped with a module of metal plates which allowed separation of sediment into 2-cm layers.The0–2cm surface layer was transferred into500cm3polypropylene bottles.The samples were sieved through0.25mm sieves,dried at80°C,shredded and ground in an S-1000Retsch ball grinder.250mgÆ20%samples of the bottom sediment were mineralized applying the microwave mineralization sys-tem MLS-1200MEGA equipped with an MDR-300/S rotor and the microwave system for concentration and evaporation of acids FAM-40equipped with an MCR-6/E rotor manufactured by Milestone.The min-eralization was carried out with a mixture of3cm3of nitric acid,2cm3of hydrofluoric acid and1cm3of hydrogen peroxide solution.After the mineralization and evaporation of the acids,0.5cm3of HNO3and10cm3of water was added,transferred into50cm3measuring flasks andfilled to volume.The mineralization of the standard reference material CRM277(trace elements in estuarine sediment)was carried out simultaneously in identical way.The concentrations of the metals in the bottom sed-iment was assayed by means of theflame technique of atomic absorption spectrophotometry using an AAS-30 spectrophotometer manufactured by Carl–Zeiss Jena. The accuracy and precision of the AAS analysis were checked by testing repeatedly the certified reference materials CRM277(trace elements in estuarine sedi-ment).The results of metal concentrations determina-tion in CRM277are collated in Table1.The calculations were performed by the program Statistica ver.5.1pl.The original data set(file.xls)is available in the Institute of Water and Wastewater En-gineering,Silesian Technical University.3.Results and discussionTable2presents mean values,standard deviation, range of element concentrations and loss on ignition (LOI)in the bottom sediment.The table also shows the median,information about the distribution of the ele-ments,and bottom sediment contamination(EF%and I geo).Due to the considerable influence of anthropogenic transformations in the investigated area,the evaluation of sediment contamination was made using the per-centage enrichment factor(EF%)defined by Zonta et al. (1994)as:EF%¼CÀC minC maxÀC minÂ100%in which C is the mean element concentration in the bottom sediment,l g/g,C min,C max are the minimum and maximum concentration determined in the investigated period,l g/g.In most cases(phosphorus and cadmium were ex-ceptions)the minimum concentrations determined were lower than the values assumed for shale(Wedepohl, 1969),which confirms the observations of other authors suggesting that the concentrations of metals in shale are generally higher than the corresponding background concentrations for bottom sediments(Salomons and F€o rstner,1984).The index of geoaccumulation was calculated by the equation:724K.Loska,D.Wiechuła/Chemosphere51(2003)723–733I geo ¼log 2c n 1:5B nwhere c n is the concentration of the examined element in the examined bottom sediment,B n is the geochemical background of a given element in shale (Turekian and Wedepohl,1961).The range of cadmium concentration is 2.40–85.06l g/g,with 42%of the values from 20to 30l g/g and 10to 20l g/g (29%for all obtained values).It was present in the bottom sediment of the Rybnik Reservoir in quantities on average 86times higher than in shale.The EF%calculated for cadmium was 28.32%andtheFig.1.Location of sampling stations.Table 1Analysis of CRM277‘‘Trace elements in estuarine sediment’’by AAS,l g/g Metal Certified Measured (n ¼6)Recover %Accuracy %Cd 11.912.9108.48.4Cr 19218093.8)6.2Cu 101.799.397.6)2.4Ni 43.442.998.8)1.2Pb 14613592.5)7.5Zn54753096.9)3.1K.Loska,D.Wiechuła /Chemosphere 51(2003)723–733725index of geoaccumulation indicated extreme contami-nation of the bottom sediment with this element.The distribution of chromium concentration in the bottom sediment was far from normal;nearly half(49%) of the results obtained were within the range of0–100l g/g.Chromium,apart from calcium,belonged to the group of elements which contaminated the bottom sediment to the smallest extent.The mean lead concentration in the bottom sediment was118.55l g/g,and the EF reached35%.The most frequent lead concentrations were within the ranges of 100–150l g/g(51%for all obtained values)and50–100l g/g(26%for all obtained values).The mean iron level was lower than the level assumed for shale,and the EF reached36.8%.Half of the iron concentration belonged to the range of20000–40000l g/g,and35%were within the range of40000–60000l g/g.The distribution of calcium concentration was far from normal;as much as81%was within the range of 1–10000l g/g.This metal belonged to the group of elements which enriched the bottom sediment to the smallest extent.The EF%and index of geoaccumulation for calcium were10.12%and2.73respectively.Phosphorus concentration in the bottom sediment was elevated.Twenty-seven percent of the results ob-tained were in the range of1–2%,23%in the range of 2–3%and21%within the range of3–4%.The level of contamination of the bottom sedi-ment with zinc was also high.The EF%was64%,the index of geoaccumulation was 2.73and indicated a considerable contamination of the bottom sediment with zinc.The most frequent values being in the ranges of 1500–2000l g/g(48%for all obtained values)and1000–1500l g/g(31%for all obtained values).The loading of the bottom sediment with copper was also substantial.Its EF%was39.58%and the concen-tration ranged from16.00to1116.90l g/g,the biggest number of the determined concentrations being within the ranges of600–800l g/g(27%for all obtained values) and0–200l g/g(25%for all obtained values).The mean nickel concentration––71.08l g/g––belonged to the range of the most frequent values i.e.50–100l g/g(81%for all obtained values).Nickel concentration in the bottom sediment against shale was low(I geo¼À0:17),although EF%pointed to a substantial loading of the bottom sediment with nickel.The results for manganese were similar.Four significant components accounting for66.8%of the variance were distinguished for the analysed data––Fig.2.Component1describes the general loading of the bottom sediment with heavy metals.It accounts for 22.6%of the variance and is characterized by high levels of Cd,Ni,Pb and Zn i.e.metals of chalcophylic nature. Speciation analysis showed that in the Rybnik Reservoir they occur in the form of sulfides and carbonates (Kwapuli n ski et al.,1992;Loska et al.,2000).There was a strong correlation between the selected metals de-scribed by positive correlation coefficients ranging from 0.40for Pb–Cd to0.62for Pb–Ni––Table3.The con-tribution of those elements,especially zinc and cad-mium,to the contamination of the bottom sediment is considerable.The metallurgical industry and combustion of fossil fuels,notably coal,are main sources of lead,cadmium, nickel and zinc in water reservoirs.Substantial amounts of those elements enter reservoirs together with muni-cipal wastewater(Nriagu and Pacyna,1988).High correlations between those metals and their high con-Table2Concentrations of selected elements and LOI in the bottom sediment of the Rybnik Resevoir,n¼364Range Average Standarddeviation Median Skewness Kurtosis Percentageenrichmentfactor(EF%)Index ofgeocum-mulationLOI[%] 1.73–34.3323.79 5.3123.98)0.79 1.11N[%]0.05–3.68 1.170.48 1.110.70 2.0430.85 2.81 P[%]0.12–7.75 2.97 1.53 2.770.690.1337.32 4.60 Cd[l g/g] 2.40–85.0625.8110.6523.15 1.37 3.5428.32 5.72 Cr[l g/g]14.27–739.11129.8490.20101.29 2.7111.3515.94)0.33 Cu[l g/g]16.00–1116.90451.74260.70469.340.04)1.2839.58 2.39 Fe[l g/g]3982.00–98510.5038782.2814701.3436846.490.680.7836.81)0.99 M n[l g/g]246.61–4215.432018.71934.931831.500.41)0.7744.650.48 Ni[l g/g] 3.00–183.8071.0821.7969.540.52 3.2037.65)0.17 Pb[l g/g]11.01–315.00118.5540.99115.320.69 2.1835.38 1.88 Zn[l g/g]50.80–2441.381583.40403.091612.24)0.68 1.3064.11 3.40 Na[l g/g]118.70–5261.701419.12672.271331.55 1.22 3.4625.29)2.80 K[l g/g]498.96–5460.051882.57721.871807.92 1.26 3.5127.89)4.52 Ca[l g/g]121.50–67227.136913.909273.843389.92 2.879.9410.12)2.73 726K.Loska,D.Wiechuła/Chemosphere51(2003)723–733tribution to the first component describing the general contamination of bottom sediments point to the waste-water discharged into the reservoir and long-range transport as the sources of bottom sediment contami-nation.The investigation into the quality of surface water carried out by the National Geological Institute in the Silesian Province in 1995(Lis and Pasieczna,1995)revealed that the metal concentration in the water of the river Ruda is significantly elevated compared to non-contaminated waters––Table 4.The values given in this table showed that lead and zinc concentrations were over 10times and nickel five times higher than the values for non-contaminated waters.Cadmium concentration was also elevated.Although the metal concentration assayed in the bottom sediments of the rivers Ruda and Nacyna was lower than in the bottom sediment of the Rybnik Res-ervoir,cadmium,zinc and lead concentrations were higher compared to the levels in shale.As for the max-imum concentrations assayed in the river sediments,lead and zinc concentrations were approximately six times higher,and cadmium concentration in the bottom sed-iment of the river Ruda even 80times higher than the concentration in shale.The special impact of the wastewater on the contamination of the bottom sedi-ment is shown by the decrease in the metal concen-trations with increasing distance from the reservoir Õs backwater.The correlation coefficient describing this de-pendence was high at the significance level of p ¼0:01and ranged from )0.19for Pb to )0.51for Cd––Fig.3.It is interesting to note that zinc concentrations in the bottom sediment decreased from approx.1700mg/kg in the headwater to approx.1400mg/kg in the zone of deep water.It might have resulted from the lower pH of the bottom water in the zone of the deep water,compared to the area of the headwater,observed during the whole research cycle (unpublished data).Previous investiga-tions showed that in the bottom sediment of the Rybnik Reservoir,zinc is present mainly in the form of car-bonates (approx.40%)(Loska et al.,2000),and the ability to leach it from this type of links increases under lower pH.Component 2accounted for 20.1%of the total vari-ance.A high,positive loading occurred for LOI,nitro-gen,sodium and potassium.The high loading for LOI,corresponding closely to the concentration of organic matter in the bottom sediment,indicates the importance of the organic matter to the binding of metal ions in the bottom sediment.The concentrations of all the elements examined are positively correlated with LOI.Thus,it may be expected that the degradation of organic matter and concomitant release of metals are another source of the secondary loading of the reservoir with metals.Particularly strong correlations were found for copper––Fig.4,which confirms the characteristic occurrence of copper in the bottom sediment in the organic and sulfide fractions observed in other investigations (Rauret et al.,1991;Calmano et al.,1993;Rule and Alden,1996).As it can be seen in Fig.4,copper concentrations at stations 1,2and to some extent 3are relatively constant.Those stations are located in the headwater of the res-ervoir characterized by more oxidizing conditions in the bottom water compared to the remaining area oftheFig.2.The distribution of the elements and LOI in the space defined by two factors––F1versus the other factors,F2,F3and F4.K.Loska,D.Wiechuła /Chemosphere 51(2003)723–733727reservoir.Under oxidizing conditions,copper mobil-ity,and hence its release from the bottom sediments, increases.It results from the limited solubility of mono-valent copper compounds compared to the varied solu-bility of bivalent compounds.The increased mobility of copper causes a lack of its increase in the bottom sedi-ment,despite the increase in LOI.Component3accounted for15.0%of the total vari-ance and is characterised by high manganese and copper concentrations described by the high positive depen-dence r¼0:63.Their co-occurrence with Cd,Cr and Ni, metals characteristic of component1,was inversely pro-portional.Also copper and manganese,though to a lesser extent,were present in the bottom sediment in elevated amounts compared to shale.The inflow of copper into the reservoir with the water of the river Ruda was smaller than for Pb,Cd and Zn.Copper concentration assayed in the water of the river was2.5-fold higher in comparison to non-contaminated waters,and its con-centration in the bottom sediment was similar to the one determined in shale––Table 4.In order tofind the sources of the bottom sediment enrichment with copper, its concentration in the atmospheric precipitation in the tested area was analyzed using the data of the Sanitary and Epidemiological Station(Atmospheric Pollution, 1991,1995,1997)and the mean metal concentrations in the precipitation in Europe(Kabata-Pendias and Pen-dias,1999)––Table5.The collation of the data for the tested area and Europe shows that copper concentration in the precipi-tation in Rybnik was higher than those of the other metals––Table5.Copper concentration in the precipi-tation was gradually decreasing during the investiga-tions.However,its concentration in the precipitation in the early1990s was relatively high in comparison to the data for Europe.Taking into consideration this notice-able decreasing tendency,it may be assumed that copper concentration prior to the tests was even higher and could have accounted for the enrichment of the bottom sediment of the Rybnik Reservoir with copper.Also manganese concentration in the precipitation in the area of the reservoir was high.In the early1990s,itsTable3The co-occurrence of metals and LOI in bottom sediment(n¼364,p<0:01)N P Cd Cr Cu Fe Mn Ni Pb Zn Na K Ca LOI0.620.160.560.270.330.440.390.330.430.310.28 N)0.140.540.230.240.160.170.290.250.35 P0.340.30)0.330.250.340.250.43)0.14)0.15 Cd0.34)0.29)0.260.590.400.54)0.21 Cr)0.440.32)0.370.370.250.280.16Cu0.640.150.410.220.28 Fe0.330.280.210.16)0.22 Mn0.230.180.27 Ni0.620.610.150.26)0.15 Pb0.51)0.15 Zn0.210.19Na0.350.19 KTable4Range of metals concentrations in water and bottom sediment of the rivers Ruda and Nacyna(Lis and Pasieczna,1995),and average metals concentrations in non-contaminated waters(Kabata-Pendias and Pendias,1999)Element Bottom sediment[l g/g]Surface water[l g/dm3]Non-contaminatedwater[l g/dm3]Ruda River Nacyna River Ruda RiverP500–2730670–2670550–1530Cd0.7–16.30.8–3.8<30.02Cr3–448–24<50.1–6Cu6–3517–62<5–221–8Fe4700–1930013400–20300470–961010–1400Mn73–737212–637179–17600.02–130Ni4–379–22<8–101–2Pb10–12630–12330–1400.1–9Zn61–570100–67741–12210Ca700–58002800–15500728K.Loska,D.Wiechuła/Chemosphere51(2003)723–733concentration was even twofold compared to the aver-age precipitation in Europe––Table 5.Apart from at-mospheric precipitation,the water from the river Ruda may also be the source of manganese present intheFig.3.The change of the concentrations of metal [l g/g]in the function of the distance from the reservoir Õs backwater[km].Fig.4.Dependence between copper concentration and LOI in the bottom sediment.K.Loska,D.Wiechuła /Chemosphere 51(2003)723–733729bottom sediment of the reservoir since its concentration assayed in the river was10times higher than in non-contaminated waters.The concentration of manganese,andfirst of all copper,increased with increasing distance from the backwater of the reservoir and reached the highest val-ues at the dam.This phenomenon takes place because copper is carried with the smallest particles of the bot-tom sediment and its strong bonds with organic matter, also found in our research,result in an increased depo-sition at the dam zone which is easily reached by the smallest particles of the bottom sediment and is the place of thefinal deposition of metals carried with or-ganic particles(Loska et al.,1994,1997).Component4accounted for9.2%of the total vari-ance.It is characterized by high contribution of iron present in the largest concentrations,and negative con-tribution of calcium.The PCA was also applied to analyze the variability of the bottom sediment loading with elements against time.The initial data were re-grouped so that the matrix columns would contain particular measurement dates, and the rows would contain the concentrations of the elements in the bottom sediments at particular sampling stations.Three components whose eigenvalues were higher than1accounted for78.5%of the total variance––Table6.Component1accounted for70.1%of the total vari-ance.The high contribution of this component was found over the periods from17th July1992to27th April 1993and from2nd February1994to20th December 1994––Fig.5.During these time intervals,high levels of iron were found in the bottom sediment(iron is a metal occurring in the bottom sediment in the largest amounts)––Fig.6.The decrease in iron concentration in the bottom sediment,also reflected by the decrease in the loading of component1,correlates with the decrease in iron concentration in the atmospheric precipitation observed in the area of the reservoir––Table5.Component2accounted for5.0%of the variance.Its value was particularly high for the samples collected on 18th of May1993,27th April1995,13th December 1996––Fig.5.The high value of component2corre-sponds to the high total metal concentration in the bottom sediment.Fig.6shows that the total metal concentration in the bottom sediment from the spring of 1993to the end of1996was5–7Â105g/g,while in1991–1992it was approx.3Â105g/g.On the whole,the total metal concentrations in the bottom sediment tended to increase during the investigations.The relation metal–time was described by the correlation coefficient of0.34.A detailed analysis of the correlation coefficients de-scribing the relation between metal concentration and time showed increased concentrations of manganese (r Mn–time¼0:24),calcium(r Ca–time¼0:40),sodium and chromium(r¼0:15)in the bottom sediment.Component3,the least effective,accounted only for 3.4%of the total variance.It was characterized by high contribution during the period from22nd August1991 to21st May1992.This period was described by high concentrations of cadmium,nickel,lead and nitrogen, the elements which contaminate the bottom sediment to a large extent.The increased lead,cadmium and nickel concentrations in the surface layer of the bottom sedi-ment over1991–1992in comparison with later investi-gations were confirmed by the value of the regression coefficient.The relation between the concentrations of those metals and time was described by negative,sig-nificant coefficients of r Cd–time¼À0:31,r Pb–time¼À0:31 and r Ni–time¼À0:36.4.ConclusionsThe investigations carried out revealed a considerable loading of the bottom sediment with cadmium,lead, zinc,phosphorus and copper.The use of PCA enabled us tofind that the elevated cadmium,lead,nickel and zinc concentrations may result from the inflow of the contaminated water from the river Ruda and long-range transport.As for the contamination of the reservoir with copper and manganese,it resulted in thefirst place fromTable5Metals deposition in the tested area(Atmospheric Pollution, 1991,1995,1997)and the area of Europe(Kabata-Pendias and Pendias,1999)[mg/m2/year,Fe––g/m2/year]Metal199119951997Europe Cd0.790.710.460.2–2Cr 3.4 2.0 1.219–61Cu181142–25Fe 6.8 4.310.03–0.57 Mn49292310–20Ni 4.5 3.1 1.4 5.8–11Pb26211325–35Zn28214110921–390Table6Eigenvalues,total and cumulative%of variance in the factor analysis for variability of the bottom sediment loading with elements over timeEigen-values%totalvarianceCumula-tive eigen-valuesCumula-tive%Factor146.2670.0846.2670.08 Factor2 3.29 4.9949.5575.07 Factor3 2.24 3.4051.7978.47730K.Loska,D.Wiechuła/Chemosphere51(2003)723–733Fig.5.PCA loading plots with points marked by dates.K.Loska,D.Wiechuła /Chemosphere 51(2003)723–733731their presence in atmospheric precipitation.The increase in metal concentrations in the reservoir may also be the result of their release from the organic matter.The variability of the bottom sediment loading with metals during the investigations was affected in the first place by changes in the concentrations of iron,but also the elements which contaminated the bottom sedi-ment––cadmium,nickel and lead.The total metal con-centrations in the bottom sediment of the Rybnik Reservoir was consistently increasing during the re-search.ReferencesAtmospheric Pollution,1991,1995,1997.WSSE,Katowice (inPolish).Borovec,Z.,1996.Trace element levels in sediments of theCzech part of the Elbe River.GeoJournal 40(3),299–309.Calmano,W.,Hong,J.,F €orstner,U.,1993.Binding and mobilization of heavy metals in contaminated sediments affected by pH and redox potential.Wat.Sci.Tech.28(8–9),223–235.Chakrapani,G.J.,Subramanian,V.,1993.Heavy metal distri-bution and fractionation in sediments of the Mahanadi River basin,India.Environ.Geol.22,80–87.Danielsson,A.,Cato,I.,Carman,R.,Rahm,L.,1999.Spatialclustering of metals in the sediments of the Skagerrak/Kattegat.Appl.Geochem.14,689–706.DelValls,T.A.,Forja,J.M.,Gomez-Parra,A.,1998.The use ofmultivariate analysis to link sediment contamination and toxicity data to establish sediment quality guidelines:an example in the Gulf of Cadiz (Espana).Cienc.Mar.24(2),127–154.F €orstner,U.,Wittman,G.T.W.,1979.Metal Pollution in the Aquatic Environment.Springer-Verlag,Berlin,Heidelberg,New York (pp.1–486).Kabata-Pendias,A.,Pendias,H.,1999.Biochemics of traceelements.PWN,Warszawa (in Polish).Kaiser,H.F.,1960.The application of electronic computers tofactor c.Psychol.Measure.20,141–151.Kozłowski,W.,Kara s ,M.,Fiedler,K.,1981.The monographof Rybnik Reservoir.Wydawnictwo Komunikacji i Ła z cznos ci,Warszawa (in Polish).Kwapuli n ski,J.,Loska,K.,G o rka,P.,Wiechuła,D.,De z bkowska,Z.,1992.Changes in metal content in the water-bottom sediment system under conditions of laboratory aeration.Acta Hydrobiol.34(3),199–209.Lis,J.,Pasieczna, A.,1995.Geochemical atlas of Poland1:2500000.PIG,Warszawa (in Polish).Loska,K.,Wiechuła,D.,Pelczar,J.,Kwapuli nski,J.,1994.Occurrence of heavy metals in bottom sediments of a heated reservoir (the Rybnik Reservoir,southern Poland).Acta Hydrobiol.36(3),281–295.Loska,K.,Cebula,J.,Pelczar,J.,Wiechuła,D.,Kwapuli nski,J.,e of enrichment,and contamination factors together with geoaccumulation indexes to evaluate the content of Cd,Cu,and Ni in the Rybnik Water Reservoir in Poland.Water Air Soil Pollut.93,347–365.Fig.6.Changes in the concentrations of selected elements and the sums of metals over the interval of 1991–1997.732K.Loska,D.Wiechuła /Chemosphere 51(2003)723–733。
Heavy metals in coastal wetland sediments of thePearl River Estuary,ChinaQuSheng Li a ,*,ZhiFeng Wu b ,Bei Chu a ,Na Zhang a ,ShaSha Cai a ,JianHong Fang aa Department of Environmental Engineering,JiNan University,Guangzhou 510632,China bGuangdong Institute of Eco-environment and Soil Sciences,Guangzhou 510650,ChinaReceived 4September 2006;received in revised form 8January 2007;accepted 10January 2007We found that the sediment in coastal wetlands of the Pearl River Estuary was polluted by Cd,Zn and no longer suitable for the current wetland utilization strategies.AbstractSediment quality in coastal wetlands of the Pearl River Estuary was concerned since the wetlands were used for land reclamation,aquaculture and wildlife protection,and meanwhile served as one of the main ultimate sinks for large amount of heavy metals discharged from the rapidly developing Pearl River Delta.Total concentrations of heavy metal,such as Zn,Ni,Cr,Cu,Pb,and Cd,and their chemical speciation were in-vestigated.Results showed that the sediments were significantly contaminated by Cd,Zn and Ni with concentration ranges of 2.79e 4.65,239.4e 345.7and 24.8e 122.1mg/kg,respectively.A major portion (34.6e 46.8%)of Pb,Cd,and Zn was strongly associated with exchangeable frac-tions,while Cu,Ni and Cr were predominantly associated with organic fractions,residual,and Fe e Mn oxide.Cd and Zn would be the main potential risk and the sediment quality is no longer meeting the demand of the current wetland utilization strategies.Ó2007Elsevier Ltd.All rights reserved.Keywords:Heavy metal;Sequential extraction;Contamination;Bioavailability;Coastal wetland sediments1.IntroductionCoastal wetlands of the Pearl River Estuary are very impor-tant for land reclamation,aquaculture and wildlife protection in the Pearl River Delta.These wetlands extend seaward 60e 150m each year and provide large amount of land for reclama-tion (Huang et al.,1982).Since AD 960s,the large-scale recla-mation has developed the nowadays delta fluvial plain with area of 5.9Â105ha,which was one of the most important agricul-tural production areas in China (Lu,1988).As much as 6.0Â104ha coastal wetlands have been reclaimed since 1981(Cui,2004).Most of reclaimed wetlands were used for cropland and fishpond.Also,some of the coastal wetlands are habitats for endangered aquatic animals and bird species,such as thenational top class protected Sousa chinensis ,Acipenser sinensis ,Ciconia ciconia ,and nearly 20other second class protected spe-cies (Cui,2004;Xu et al.,2003).However,the coastal wetland is also one of the main ulti-mate sinks for heavy metals resulted from the adsorption and sedimentation Williams et al.,1994.Since 1980s,huge amount of heavy metal pollutants were discharged into the Pearl River Estuary accompanying the rapid economic growth in Pearl River Delta.For example,8293t heavy metal input came from direct fluvial transport by the Pearl River in 2003(Guangzhou Marine and Fishing Bureau,2004).Most of the river-borne metal inputs were from point sources in the big cit-ies and their suburbs such as Guangzhou,Zhongshan,Dong-guan and Foshan (Fig.1),where the electronic and metalwork industries are well developed.The potential bioavailability of heavy metal in wetland sed-iments is determined by the total content and speciation.*Corresponding author.Tel./fax:þ862085226615.E-mail address:liqusheng@ (Q.S.Li).0269-7491/$-see front matter Ó2007Elsevier Ltd.All rights reserved.doi:10.1016/j.envpol.2007.01.006Environmental Pollution 149(2007)158e164Heavy metal speciation offers a more realistic estimate of ac-tual environmental impact (Cuong and Obbard,2006).Liang and Wong (2003)and Man et al.(2004)investigated the spatial and seasonal distribution of heavy metals in Mai Po wetland,a Ramsar site located at northwestern Hong Kong,and found that the Shenzhen River and the Pearl River were the sources of the pollution.The adverse effects on some aquatic animals and birds in the reserve were observed (Connell et al.,2002;Ong Che and Cheung,1998).Tam and Wong (2000)revealed that the concentrations of heavy metals in surface sediments in mangrove swamps located in western Hong Kong were much higher than those in the east due to anthropogenic input.Li et al.(2000)reported that Pb and Zn contents were elevated in the sediments at most of the sampling sites in the Pearl River Estuary.The fractionation of some metals in coastal es-tuarine sediments in Hong Kong and in the Pearl River Estuary was also examined (Lam et al.,1997;Li et al.,2001).Very little information about the heavy metals in coastal wetland sediments of the Pearl River Estuary was known.The objectives of this study are to survey the accumulation of heavy metal Zn,Ni,Cr,Cu,Pb,and Cd in this area,and to investigate their geochemical speciation.2.Material and method2.1.Collections of sediment samplesAccording to the spatial distribution of wetland types,127surface sedi-ment or soil samples,consisting of 37reclaimed wetland soils,22mangroveswamp sediments,35mudflat sediments,12beach sand sediments and 21sed-iments from the wetlands 100e 400m far to sewage drainage outlets (Fig.1),were collected in August 2005and July 2006.The reclaimed wetlands were reclaimed during the last 20years,and planted with banana,lotus and vegeta-bles.Mangrove swamps,most of them have been planted in recent years,are mainly located at a nearby nature reserve e Qiao Island.Most of the mudflats are distributed in the western coast,and beach sand in western Hu Men.The drainage outlets discharge directly the untreated domestic and industrial sew-age into estuary from the towns with 20,000e 100,000population and widely distributed small industrial enterprises.The reclaimed wetland soils were col-lected between the depths of 0and 10cm.Each of the other wetland sediments was obtained between 0and 5cm from the intertidal zones during low tide.All samples consisting of nine subsamples were collected using PVC tubes and stored in polyethylene bags.2.2.Analytical methodsImmediately after collection,samples were air dried at room temperature and sieved through a 2-mm nylon sieve to remove coarse debris.The sediments were then ground with a pestle and mortar until all particles passed a 200-mesh nylon sieve.The total heavy metal content of the prepared soil was determined by HCl e HNO 3e HF e HClO 4extraction.A 20%of the samples was used as paral-lels for quality control.The results met the accuracy demand of Technical Spec-ification for Soil Environmental Monitoring HJ/T 166-2004(SEPAC,2004).Various sequential extraction schemes such as Tessier procedure (Tessier et al.,1979),BCR procedure (Ure et al.,1993),and GSC procedure (Hall et al.,1996)are widely used for the pollution studies.All the schemes have ad-vantages and disadvantages,and should be used depending on the properties of samples (Gleyzes et al.,2002).Considering the nature of sediments such as hav-ing a neutral pH,a high chloride ions’content,a low carbonate content,a medium organic matter and DCB extractable Fe 2O 3content,Tessier sequential extraction procedure was used in this study (SEPAC,2004;Tessier et al.,1979).Selected 45sediment samples,consisting of 12reclaimed wetland soils,11mangrove swamp sediments,11mudflat sediments,and 11sewage outlet sediments,wereanalyzedFig.1.The sketch map of sampling areas in wetlands of the Pear River estuary.159Q.S.Li et al./Environmental Pollution 149(2007)158e 164for the chemical partitioning of Cd,Zn,Cu,Cr,Ni and Pb.Each of the chemical fractions was operationally defined as follows:(1)exchangeable fraction: 2.000g soil(dry wt.)was extracted.Each1.000g soil with8.0ml of pH7, 1.0M MgCl2in a Teflon centrifuge tube for1h at25 C with continuous agita-tion;(2)carbonate bound fraction:each residue from exchangeable fraction ex-tracted with8ml of pH5,1.0M NaOAc for6h at25 C with continuous agitation;(3)Fe e Mn oxide fraction(reducible):each residue from the carbon-ate fraction extracted with20ml of0.04M NH2OH/HCl in25%acetic acid(v/v) for6h at96Æ3 C with occasional agitation;(4)organic fraction(oxidisable): each residue from the Fe e Mn oxide fraction extracted with2ml of0.02M HNO3and3ml of pH2(adjusted by conc.HNO3),30%H2O2for2h at 85Æ2 C with occasional agitation;an additional3ml of pH2,30%H2O2 for3h at85Æ2 C with occasional agitation was added;and then5ml of 3.2M NH4OAC in20%HNO3(v/v)was added and agitated continuously for 0.5h at25 C;(5)residual fraction:residues in both two tubes from the organic fraction were together digested with HF e HClO4.After each successive extraction,separation was performed by centrifuging at4000rpm for35min.The supernatants were separated with a pipette.The sed-iments were washed in8ml deionized water and again centrifuged for25min. The wash water was discarded.The supernatants from two centrifuge tubes were put together and were added with deionized water to50ml for measure-ment.The heavy metal concentration in each solution was determined by Atomic Absorption Spectrometry.Precision was monitored by running triplicates every 20samples and was generally<8%relative standard deviation.The ratios of cu-mulative concentrations offive fractions to the independent total concentrations of Cd,Cu,Cr,Ni,Pb and Zn were118,87,99,89,116and91%,respectively.The sediment properties were also analyzed.Fe2O3content was extracted by dithionite e citrate e bicarbonate(DCB)(Mehra and Jackson,1960).CaCO3 content was measured using the method of Laboratory of Analytical and Agro-chemistry(1985).Organic matter content was measured as weight loss be-tween drying the soil to constant mass at105 C and heating for6h at 450 C.The clay size distribution was determined with the pipette method (Chinese Soil Science Society,2000).Determinations were made for pH, salt content,soluble Naþ,Ca2þ,Mg2þ,Kþ,ClÀ,HCO3À,and SO42À,using methods of the Chinese Soil Science Society(2000).3.Results and discussion3.1.Sediment propertiesThe organic matter content of sediment was0.27e0.87%in beach sand,and2.29e4.7%in the other wetlands.The average content of CaCO3and Fe2O3in wetland sediment except for beach sand was0.74%and 3.0%,respectively.The clay (<0.001mm)content in beach sand and other wetlands was 0.6e0.8%and8.8e30.0%,respectively.Most of the wetlands had neutral pH of6.56e7.72.The sediment pH value in man-grove swamps also ranged from6.56to7.29.These were dif-ferent from the low pH values in most of the mangrove swamps in Hong Kong(Tam and Wong,2000).Lu(1988) also reported that most sediments of the mangrove swamps in this area had a neutral pH value since they were frequently flooded by the tide and could not become acidic in reducible condition.Another reason for neutral pH probably was that most of the mangroves at sampling sites were planted in recent years and very little litter accumulated in the sediments.The sediment salt and its main ions are shown in Table1.3.2.Heavy metal concentrations in sedimentsTable2summarizes the mean,standard deviation,median and range of Cd,Zn,Cu,Cr,Ni and Pb concentrations at differ-ent wetland types.The mean concentrations of Cd,Cu are in or-der:sewage outlet wetland>mudflat>mangrove swamp >reclaimed wetland>beach sand.For Zn,Ni,Cr,in order: sewage outlet wetland>mangrove swamp>mudflat>re-claimed wetland>beach sand.For Pb,in order:sewage outlet wetland>mangrove swamp>beach sand,mudflat>re-claimed wetland.The metal concentrations in sewage outlet wetlands were the highest,implying the wetlands received metal pollutants both from local sewage discharge and the Pearl River. The metal concentrations in reclaimed wetlands were relatively lower because they were no longerflooded by tide,and just irri-gated using the water from the Pearl River.The metal concentra-tions in beach sand were the lowest since their sediments had the lowest content of clay.The sediment heavy metal concentrations in the Pearl River Estuary wetlands were significantly higher than the background values in Hong Kong marine sediments and in Guangdong Province soils(China Environmental Monitoring Station, 1990;EPD,1992).Among them,the mean Cd concentration was as high as66times of the background values in Hong Kong marine sediments(Table2).According to the Chinese marine sediment quality criteria(National Standard of PR China,2002),thefirst class quality was suitable forfishery,na-ture reserve,endangered species reserve,and swimming;the second class quality could be used for industry and tourism site;and the third class could just be used for par-ing to this standard,the concentrations of Cd and Ni in all samples,and Zn in25e45%samples exceeded the second class criteria(Table2).All the mangrove swamps and mudflats did not meet the environmental quality demand of nature re-serve and aquaculture.According to the Chinese agricultural soil environmental quality criteria(National Standard of PR China,1995),the concentrations of Cd in all samples,Ni in 71%samples,and Zn in65%samples of the cropping re-claimed wetlands also exceeded the thresholds(Table2). The average Cd concentration was as high as12times of its threshold,suggesting that the heavy metal pollutions in coastal wetlands have resulted in serious ecological risk for the cur-rent reclamation.3.3.Heavy metal speciation in sedimentsThe chemical partitioning of Cd,Zn,Ni,Pb,Cr and Cu in reclaimed wetlands is summarized in Table3.Fig.2displays the speciation of heavy metals in mangrove swamp,mudflat, and sewage outlet wetland.These four wetland types had similar chemical fractionation distribution for each heavy metal.Table1The average and range of the salt composition in wetland sediments mg/kgSalt content ClÀHCO3ÀSO42ÀKþMg2þNaþCa2þAverage5055.91789.1280.1419.231.138.31249.8298.0 Range1350.7e13696.1347.2e5992.881.7e514.89.0e1045.127.7e109.225.7e125.0232.1e4433.688.0e528.4 160Q.S.Li et al./Environmental Pollution149(2007)158e164Cd in all sediments was strongly associated with exchange-able,residual and carbonate bound fractions.The percentage of Cd associated with different fractions was in order:ex-changeable >residual >carbonate bound >Fe e Mn oxide >organic.The average percentage of Cd exchangeable fraction was as high as 40%.This resulted from the high concentration of Cl Àin coastal sediments,which could form the compounds CdCl þ,CdCl 2and increase the mobility and bioavailability ofTable 2Heavy metal concentrations of sediment at different wetland types in the Pearl River Estuary (n.d,not detected)mg/kgCdPb Cu ZnNi CrReclaimed wetland (n ¼37)Mean,SD 3.67Æ0.6528.5Æ9.051.6Æ19.0282.7Æ93.956.1Æ11.978.3Æ23.5Median 3.6028.453.4273.055.873.1Range 2.24e 4.6514.3e 44.08.9e 87.8139.0e 478.434.3e 70.435.7e 121.5Mangrove swamp (n ¼22)Mean,SD 4.21Æ0.6335.3Æ15.664.5Æ10.4334.7Æ53.373.7Æ9.685.0Æ20.0Median 4.1028.165.4337.073.889.2Range 3.52e 5.8220.6e 65.049.6e 86.8249.3e 411.057.3e 96.547.5e 115.0Mudflat (n ¼35)Mean,SD 4.22Æ0.9432.3Æ13.668.2Æ71.4311.1Æ53.360.4Æ23.179.9Æ26.4Median 4.1432.459.3302.458.278.2Range 2.33e 5.8813.4e 58.9n.d e 351.2227.6e 406.819.4e 143.922.6e 129.4Beach sand (n ¼12)Mean,SD 2.79Æ0.9632.4Æ27.314.7Æ22.8239.4Æ104.924.8Æ17.840.2Æ29.8Median 2.3527.30.4226.018.334.3Range 1.84e 4.1412.3e 86.0n.d e 49.4120.5e 392.413.8e 60.413.5e 97.9Sewage outlet wetland (n ¼21)Mean,SD 4.65Æ1.1939.4Æ13.8141.1Æ89.7345.7Æ48.7122.1Æ76.2110.9Æ35.4Median 4.3437.1123.7347.991.6107.0Range 3.17e 6.4313.8e 59.338.8e 318.9270.4e 435.352.9e 318.364.6e 191.2Standard of marine sediment quality aI Class 0.5603515034b 80II Class 1.513010035040b 150III Class525020060040b 270Criteria of agricultural soil quality c0.330010025050200Background of marine sediments in Hong Kong d 0.06218511115Background of soils in Guangdong Province e0.05636.017.047.318.250.5a National Standard of PR China (2002)(GB 18668-2002).b Sediment quality benchmark in Hong Kong SAR (EPD,2005).c National Standard of PR China (1995)(GB 15618-1995).d EPD(1992).eChina Environmental Monitoring Station (1990).Table 3Chemical fractionation of heavy metals in reclaimed wetlands %ExchangeableCarbonate bound Reducible Oxidisable Residual CdMean,SD 38.3Æ7.918.3Æ8.6 6.9Æ3.40.8Æ2.135.7Æ6.2Median 40.018.8 6.70.037.7Range 25.0e 47.90e 27.4 1.6e 12.00e 6.625.9e 47.2ZnMean,SD 43.1Æ6.316.8Æ7.5 3.8Æ2.7 3.8Æ1.432.6Æ6.2Median 41.818.3 4.0 3.134.0Range 33.9e 55.0 3.9e 29.80e 6.9 2.7e 6.922.3e 45.0NiMean,SD 9.8Æ5.8 6.9Æ3.511.1Æ6.5 5.0Æ5.667.2Æ8.4Median 10.07.98.3 1.571.6Range 0.7e 16.60e 11.10e 22.00e 18.751.2e 78.5PbMean,SD 43.2Æ8.9 5.8Æ2.314.4Æ5.9 3.8Æ2.732.8Æ3.9Median 43.65.114.90.033.7Range 31.4e 62.3 3.7e 10.5 4.7e 24.20e 8.426.8e 38.7CrMean,SD 2.9Æ1.410.8Æ9.941.8Æ10.510.0Æ3.534.5Æ11.4Median 2.37.143.19.432.0Range 1.9e 6.30.9e 27.232.9e 67.2 6.1e 17.616.1e 50.1CuMean,SD 2.5Æ0.5 2.0Æ1.8 6.0Æ1.530.8Æ13.858.8Æ13.6Median 2.6 1.5 6.626.064.9Range1.6e 3.50e 4.73.0e 7.712.2e 61.530.8e 75.4161Q.S.Li et al./Environmental Pollution 149(2007)158e 164Cd (Norvell et al.,2000).Man et al.(2004)also found that Cd had the greatest tendency toward remobilization from the sedi-ment phase to the more bio-available pore water phase in the vicinity of the Mai Po Mangroves and the river mouths in Hong Kong.The average percentage of Cd carbonate bound fraction was about 20%.This was because the sediments con-tained high concentration of HCO 3À,which came from the karst area in the upper Pearl River and formed CdCO 3in the neutral pH condition.The chemical partitioning of Zn was similar to that of Cd.The percentage of Zn associated with different fractions distri-bution was in the order:exchangeable >residual >carbonate bound >Fe e Mn oxide and organic.This was different from the zinc partitioning in the sediment profile in the Pearl River Estuary ocean,where residual >Fe e Mn oxide >organic >exchangeable and carbonate (Li et al.,2001).Generally Zn in acidic soil had a high percentage of exchangeable fraction (Hseu,2006;Martinez and Motto,2000),but the mean per-centage of exchangeable Zn in these wetland sediments wasas much as 39%with concentration of 114.5mg/kg.Both its percentage and concentration were greater than those in 1980s,when the mean available Zn concentration (0.1mol/L HCl extracted)was 54.2mg/kg with percentage of 26%(Lu,1988).The increase in exchangeable Zn suggests that large amount of dissolved zinc from the river was incorporated into the wetland sediments and the sedimentation was not long enough for ageing.Lock and Janssen (2003)found that the zinc partitioning coefficient (total concentration/pore water concentration)of some spiked soils with pH 7still remained less than 10after the duration of his toxicity assay experiment performed following OECD Guideline,but the partitioning coefficient of the historically contaminated soils was near to 1000.Wei et al.(2005)also reported that the DTPA e Zn con-centration increased 117.4%after 17years of continuous ap-plication of ZnSO 4to soils with pH 8.2in the Loess Plateau China.The relatively higher percentage of Zn carbonated bound fraction was related to the concentration of HCO 3Àin sediments.The predominant chemical partitioning of Pb was exchange-able,residual and Fe e Mn oxide fractions.The percentage of Pb speciation distribution was in the order:exchangea-ble >residual >Fe e Mn oxide >carbonate and organic.The result is consistent with the findings in the wetland sediments with similar pH values in India (Mathew et al.,2003).Pb was associated with exchangeable fraction as high as 41.9%,indicat-ing its current anthropogenic sources.Ramos et al.(1999)re-ported high exchangeable fraction percentage of Pb in sediments from Ebro River in Spain because of human activities.The average concentration of Pb associated with Fe e Mn oxide was 10.3mg/kg,with an average of 19.7%.Pb also can form sta-ble forms with Fe and Mn dioxide (Ramos et al.,1994).Cu was predominantly associated with residual and organic fractions.Its percentage of partitioning distribution in mangrove swamp,mudflat and reclaimed wetland was in order:resi-dual >organic >Fe e Mn oxide >carbonate >exchangeable.Our finding is in agreement with the result obtained by Li et al.(2001).Fernandes (1997),Ramos et al.(1999)and Zhou et al.(1998)reported significantly high concentrations of Cu associated with organic matter in anic matter was also known to be responsible for a substantial retention of Cu in vineyard soils (Flores-Velez et al.,1996).In the sewage outlet wetland,the percentage of partitioning distribution was in order:organic >residual >carbonate >Fe e Mn oxide >exchangeable,resulted from the short sedimentation period of the current anthropogenic source.The chemical partitioning distribution of Cr was different in various wetlands.But the main fraction was Fe e Mn oxide in all the wetland types except for mudflat.The sediments had a medium Fe 2O 3content,and Cr could be strongly associated with Fe oxide and kaolinite clay (Chen,2005).The predominant partitioning of Ni was residual with a mean of 66.6%in mangrove swamp,mudflat and reclaimed wetland,but in sewage outlet wetland,the residual fraction of Ni was just 48.5%and much lower than those of the rest wet-land types.Its Fe e Mn oxide fraction was as much as 21.7%and much higher than the others.(a)CdZnPbCrCuNi(b)Cd Zn Pb Cr Cu Ni(c)Cd Zn Pb Cr Cu Nimangrove swampsewage outlet wetland3.4.Heavy metal potential bioavailability in sedimentsBased on the sequential extraction procedure,it was well documented(Chlopecka and Adriano,1996;Li et al.,1998; Maiz et al.,2000;Wang et al.,2002)that the concentration of heavy metals associated with the exchangeable plus carbon-ate fraction in soils correlated well with the contents of those elements in plants.Heavy metals in these fractions would be readily bio-available(Hseu,2006).Among the three signifi-cant contaminating metals,the range of total percentage of ex-changeable plus carbonate fraction of Cd and Zn was as much as56.6e65.9%and50.7e59.9%,respectively,suggesting their great bioavailability and potential risk to crops and ani-mals.The range of total percentage of exchangeable plus car-bonate fraction of Ni was only16.7e19.9%,and implying a relatively lower bioavailability.Among the remaining three lightly polluting metals,the total percentage of exchangeable plus carbonate fraction of Pb and Cr was43.6e52.0%and 13.7e28.4%,respectively.However,the potentially bio-avail-able fractions of Cu accounted for<6%of total sediment Cu except for sewage outlet wetland.4.ConclusionThe sediments in coastal wetlands of the Pearl River Estu-ary were significantly polluted by Cd,Zn,and Ni.The quality of sediments in mangrove swamps and mudflats was not suit-able for nature reserve,aquaculture,and reclamation.Further-more,the chemical partitioning of Cd and Zn associated predominantly with exchangeable fractions and increased the ecological risk.The current strategies of coastal wetland utili-zation in this region should be reviewed again due to the poor environmental quality in the area.AcknowledgementsWe are grateful to the Key Lab of Wetland Ecology and En-vironment Northeast Institute of Geography and Agricultural Ecology CAS(No.WELF-2004-B-011),the Natural Science Fund of JiNan University(No.51205032)and the National Natural Science Foundation of China(No.40571164)for financial support to conduct the experiment.We also acknowl-edge the contributions of the reviewers of this manuscript and Dr.Alex Tat-Shing Chow from South China University of Technology for English editing.ReferencesChen,H.M.,2005.Environmental Soil Science.Science Press,Beijing(in Chinese).China Environmental Monitoring Station,1990.Natural Background Values of Soil Elements in China.China Environmental Science Press,Beijing(in Chinese).Chinese Soil Science Society,2000.Analytical Methods for Soil Agricultural Chemistry.China Agricultural Science and Technology Press,Beijing(in Chinese).Chlopecka,A.,Adriano,D.C.,1996.Mimicked in situ stabilization of metals in a cropped soil:bioavailability and chemical forms of zinc.Environmen-tal Science and Technology30,3294e3303.Connell, D.W.,Wong, B.S.F.,Lam,P.K.S.,Poon,K.F.,Lam,M.H.W., Wu,R.S.S.,Richardson,B.J.,Yen,Y.F.,2002.Risk to breeding success of ardeids by contaminants in Hong Kong:evidence from trace metals in feathers.Ecotoxicology11(1),49e59.Cui,W.Z.,2004.Study on protection of mudflat wetland in the Pearl River Estuary.Wetland Science2(1),26e30(in Chinese).Cuong,D.T.,Obbard,J.P.,2006.Metal speciation in coastal marine sediments from Singapore using a modified BCR-sequential extraction procedure.Applied Geochemistry21(8),1335e1346.EPD,2005.Marine Water Quality in Hong Kong in2004e Sediment Qual-ity.Environmental Protection Department of Hong Kong SAR,Hong Kong.EPD,1992.Marine Water Quality in Hong Kong.Environmental Protection Department of Hong Kong,Hong Kong.Fernandes,H.M.,1997.Heavy metal distribution in sediments and ecological risk assessment:the role of diagenetic processes in reducing metal toxicity in bottom sediment.Environmental Pollution97,317e325.Flores-Velez,L.M.,Ducaroir,J.,Jaunet,A.M.,Robert,M.,1996.Study of the distribution of copper in an acid sandy vineyard soil by three different methods.European Journal of Soil Science47,523e532.Gleyzes,C.,Tellier,S.,Astruc,M.,2002.Fractionation studies of trace ele-ments in contaminated soils and sediments:a review of sequential extrac-tion procedures.Trends in Analytical Chemistry21,451e467. Guangzhou Marine and Fishing Bureau,2004.Report of Marine Environmental Quality in Guangzhou in2003.<>(in Chinese). Hall,G.E.M.,Vaive,J.E.,Beer,R.,Hoashi,M.,1996.Selective leaches revis-ited,with emphasis on the amorphous Fe oxyhydroxide phase extraction.Journal of Geochemical Exploration56,59e78.Hseu,Z.Y.,2006.Extractability and bioavailability of zinc over time in three tropical soils incubated with biosolids.Chemosphere63,762e 771.Huang,Z.G.,Li,P.R.,Zhang,Z.Y.,1982.Formation,Development and Evo-lution of the Pearl River Delta.The Guangzhou Branch of Popular Science Press,Guangzhou(in Chinese).Laboratory of Analytical and Agrochemistry,1985.Analytical Methods for Plants and Soils.State University of Ghent,Ghent.Lam,M.H.W.,Tjia,A.U.W.,Chan,C.C.,Chan,W.P.,Lee,W.S.,1997.Speci-ation study of chromium,copper and nickel in coastal estuarine sediments polluted by domestic and industrial effluents.Marine Pollution Bulletin34(11),949e959.Li,F.L.,Shan,X.Q.,Zhang,T.H.,Zhang,S.Z.,1998.Evaluation of plant avail-ability of rare earth elements in soils by chemical fractionation and multi-ple regression analysis.Environmental Pollution102,269e277.Li,X.D.,Wai,O.W.H.,Li,Y.S.,Coles,B.J.,Ramsey,M.H.,Thornton,I.,2000.Heavy metal distribution in sediment profiles of the Pearl River estuary South China.Applied Geochemistry15,567e581.Li,X.D.,Shen,Z.G.,Wai,O.W.H.,Li,Y.S.,2001.Chemical forms of Pb,Zn and Cu in the sediment profiles of the Pearl River estuary.Marine Pollution Bulletin42(3),215e223.Liang,Y.,Wong,M.H.,2003.Spatial and temporal organic and heavy metal pollution at Mai Po Marshes Nature Reserve,Hong Kong.Chemosphere 52,1647e1658.Lock,K.,Janssen,C.R.,2003.Influence of ageing on zinc bioavailability in soils.Environmental Pollution126,371e374.Lu,F.X.,1988.Soils in the Pearl River Delta.Chinese Environmental Science Press,Beijing(in Chinese).Maiz,I.,Arambarri,I.,Garcia,R.,Millan,E.,2000.Evaluation of heavy metal availability in polluted soils by two sequential extraction procedures using factor analysis.Environmental Pollution110,3e9.Man,K.W.,Zheng,J.S.,Leung,A.P.K.,Lam,P.K.S.,Lam,M.H.W.,Yen,Y.F., 2004.Distribution and behavior of trace metals in the sediment and pore-water of a tropical coastal wetland.Science of the Total Environment327, 295e314.Martinez,C.E.,Motto,H.L.,2000.Solubility of lead,zinc and copper added to mineral soils.Environmental Pollution107,153e158.163Q.S.Li et al./Environmental Pollution149(2007)158e164。
94Marine Science Bulletin Vol.18 2Figures of stanceSite of samplesFig.1Sampling Stations bitmap3Infusions and analysis3.1Index for heavy metalsCollectting and summarizing the data of heavy metals in2014for Bohai Bay, Statistical characteristics of the suspension of heavy metals contents were shown in Tab.1.Tab.1Statistical characteristics of heavy metal contents in suspension(ug/L,n=51) Project Fe Mn Si BaMaximum24291.072022.54 1.761037.06Minimum277.4248.520.2022.24Mean7945.62609.47 1.60282.14 Standard Deviation5902.52510.340.12311.34Coefficient of Variation74.2983.747.60110.35 Note:The Coefficient of Variation:CV=(SD/MN)*100%;SD is Standard deviation;MN is Mean.According to Tab.1,the average of heavy metals in the study area,the content of iron was the highest,silicon content was lowest;in descending order:Fe>Mn>Ba>Si;the coefficient of variation is between7.60and110.35;except barium greater the degree of dispersion(coefficient of variation is greater than100),the other elements of Fe,Mn and Si; the coefficient of variation of less than50;the coefficient of variation of Si was smaller, more uniform spatial distribution,discrete small;and Ba spatial variation coefficient greaterNo.1Dong Yu-bo:Distribution of heavy metals in suspension in Bohai Bay95than50,indicating that the content of Ba in the uneven distribution of space,a large degree of dispersion.Fig.2Distribution characteristics of heavy metals in different stations in suspension3.2Distribution of heavy metalsFrom Fig.2,the4kinds of heavy metals are from low to high,from the south to the north.Silicon content was the highest in51stations.The other3elements appeared in50 stations,50and51stations in the4kinds of heavy metal pollution of other stations seriously.Lowest value of Si and Mn elements appear in the6stations;Fe elements appear in the station No.1;barium element is No.10stations;this shows that in the southern Gulf of Bohai Sea seston Si,Mn,Fe contamination from light;BA element pollution in the Central Bay of Bohai Sea light.4Conclusions(1)The results showed that4heavy metals in the study area,the content of iron was the highest,silicon content was lowest;in descending order:Fe>Mn>Ba>Si;the coefficient of variation is between7.60and110.35.(2)The4kinds of heavy metals are from low to high with the sample of satations, from the south to the north in Bohai Bay.Silicon content was the highest in51stations.The96Marine Science Bulletin Vol.18 other three elements appeared in50stations.(3)Bohai Bay had potential ecological risk.AcknowledgmentsThis research is financially supported by Key Laboratory of Marine Oil Spill Identification and Damage Assessment Technology,State Oceanic Administration(201214) and Key Laboratory of Pollution Processes and Environmental Criteria(Nankai University), Ministry of Education(KL-PPEC-2013-09),and Tianjin aquatic Bureau Youth Fund (J-2014-08).Reference[1]YU Tao,ZHANG Yuan,ZHANG Yan.Distribution and bioavailability of heavy metals in differentparticle-size fractions of sediments in Taihu Lake,China[J].Chemical Speciation and Bioavailability, 2012,24(4):205-215.[2]GONG M,WU L,BI X Y,et al.Assessing heavy-metal contamination and sources by GIS-basedapproach and multivariate analysis of urban-rural topsoils in Wuha,central China[J].Environmental Geochemistry and Health,2010,32(1):59-72.[3]Bhuiyan M A H,Parvez L,Islam M A,et al.Heavy metal pollution of coal mine-affected agriculturalsoils in the northern part of Bangladesh[J].J.Hazard Mater,2010,173(1):384-392.[4]WU J R,Ember R,JIN M,et al.Isotopic evidence for the source oflead in the North Pacific abyssalwater[J].Geochimica et Cosmochimica Acta,2010,74(16):4629-4638.渤海湾悬浮物中重金属的分布特征董玉波(天津市水产研究所,天津300221)摘要:对2014年夏季渤海湾51个站位悬浮物样品中4种重金属(Fe、Mn、Si和Ba)含量进行了分析,研究了该海域悬浮物中重金属元素分布特征及其控制因素。
Libo HaoLiji SunYuyan ZhaoJilong LuDepartment of Geochemistry,Jilin University,Changchun,P.R.China Research ArticleSedimentary Records of Evolution of Heavy Metals in Songhua Lake,Northeast ChinaIn this paper,the vertical variations of heavy metal elements(including Cd,Cr,Cu,Hg, Mn,Ni,Pb,and Zn)in the sediments of Songhua Lake are analyzed using sediment cores.A70-year evolutionary history of these heavy metal elements in Songhua Lake is described and the sources of the heavy metals in the sediments are investigated by evaluating the pollution characteristics of the metals in terms of their enrichment coefficients and geoaccumulation indexes.The results indicate that Cr,Cu,Mn,Ni,Pb, and Zn in the sediments originated mainly from basin erosion and were transported to the lake by rivers.Cd and Hg in the sediments also originated from basin erosion that occurred prior to the mid-1990s,and these sediments have since been overlaid by artificial pollution.The distribution of heavy metals in the sediments of Songhua Lake is influenced by many factors,including sediment composition,the relative import-ance offluvial input,and artificial pollution.Keywords:Evolutionary history;Heavy metals;Lake sediments;Songhua LakeReceived:June17,2012;revised:December19,2012;accepted:January4,2013DOI:10.1002/clen.2012002651IntroductionSonghua Lake is a large,artificial lake located in the upper part of the Second Songhua River,which is24km southeast of Jilin City, northeast China.The lake was formed as a result of the damming of the Songhua River by the Fengman hydropower station.The lake exhibits a long and narrow shape,with a maximum width of10km, mean depth of30–40m,maximum depth of about75m,and total area of550km2.The major contributors of run-off to the lake include the trunk streams of the Songhua River,the Huifa River,and the Jiaohe River.Songhua Lake is involved in power generation,flood control,irrigation,aquaculture,and tourism,besides being an important water source for the cities of Jilin and Changchun.As the Fengman hydropower station was completed in1943,the lake presents a sedimentation history of nearly70years.The surrounding region hosts developed agriculture and industry and there are rich nonferrous metal mineral resources in the upper reaches of the basin.Previously exploited ore deposits include a gold mine in Huadian District,nickel ore in Panshi,and molybdenum ore in Jilin.Agricultural and industrial production and mining have swept heavy metal elements into the aquatic environment,threatening the ecological security of Songhua Lake.Many researchers have inves-tigated heavy metals in the lake sediments[1–3],although previous work has focused primarily on surface sediments and suspended material.Thus,no study of the evolution history of heavy metals has been conducted.Lakes act as sinks of heavy metals in the environment.Therefore, lake sediment is a collection of heavy metals from various sources (including basin erosion,airborne dust,and anthropogenic dis-charge)and records the natural geologic background levels of elements in a river basin in addition to information about the impact of human activity on the environment.Therefore,sediment characteristics provide the key to redrawing the history of soil environmental change for the lake’s catchment[4–6].The lake sedi-ment is a significant part of the aquatic ecosystem and plays an important role in the lake’s ecosystem in particular[7–10].Lake sediment cores that have been subjected to little or no human disturbance are used widely in research into various persistent pollutants(including heavy metals)in the natural environment, including pollutant history and evolution[11,12].This study ana-lyzes vertical changes in Cd,Hg,Cu,Pb,Zn,Mn,Ni,and Cr in sediment cores from Songhua Lake and constructs an evolutionary history of heavy metals in Songhua Lake sediments.Furthermore, the degree of heavy metal pollution is evaluated and the sources of heavy metals are investigated.This study aims to provide an effective reference for the environmental protection of Songhua Lake.2Materials and methods2.1Sample collectionThe sediment core(SC2006-1)was extracted from the middle of Songhua Lake(1268560300E,4383601200N)on December20,2006(see Fig.1).Waterflow at the sampling point was steady and there was no obvious human or any other kind of disturbance.Water depth was about10m.The sampling apparatus included a self-made polyvinyl chloride(PVC)tube-type portable sampler with a global positioning system used for location.The sediment core derived was intact without obvious disturbance at the surface and the interfacial water was clear.The core was about70cm in length with a distinct inter-face at61cm(the sediment surface considered to be0cm),aboveCorrespondence:Y.Zhao,Jilin University,College of GeoExploration Science and Technology,938Ximinzhu Avenue,Chaoyang District, Changchun130026,P.R.ChinaE-mail:zhaoyuyan@1010which the composition of the sediment was uniform and classified as dark gray muddy loam.X-ray analysis indicated that the main minerals present were quartz,feldspar,illite,kaolinite,chlorite,and montmorillonite.Weathered granitic sand was present below a depth of 61cm.The part of the core above this was determined to be a natural sediment of Songhua Lake according to the underlying geology and the impoundment time of the Fengman hydropower dam:the sample at 61cm corresponded to the impoundment of the dam in 1942.The sediment core was cut into segments of 1cm in length after being frozen to solid,and was then dried to measure sample weight.The samples were ground to 200grit for specific activity of 137Cs and element concentration measurement.2.2Sample analysisElementary analysis of the sediment samples was conducted by the Shenyang Mineral Resource Supervision and Inspection Center of the Ministry of Land and Resources.Quality control was imple-mented according to the technical requirements of Survey Specification of Multi-Target Regional Geochemistry at 1:250000(DD2005-1).Graphite furnace atomic absorption spectrometry was applied for analysis of Cd,atomic fluorescence spectrometry for analysis of Hg,ICP-AES (inductively coupled plasma-atomic emission spectrometry)for analysis of Cu,and X-ray fluorescence spectro-metry for analysis of other elements.The detection limits of Cd,Hg,Cu,Cr,Mn,Ni,Pb,and Zn were 0.02,0.005,1,1,10,1,1,and 1m g/g,respectively.The elementary analysis precision (RSD%)was <10.The results of analysis of the sediments of Songhua Lake are presented in Table 1.Artificial radioactive nuclide 137Cs has been widely applied in lake sediments dating,which provides a chronological basis for the study of environmental changes.In the past study,we had used the specific activity of 137Cs to date the sediment core for Songhua Lake [13].It showed that,there were three obvious 137Cs accumulation peaks in the lake sediment cores:the accumulation peak of 1964at 37cm,the 1971peak at 27cm,and the 1975peak at 23cm.This study uses the two significant time periods of 1964and 1975to determine the duration of sedimentation for the core.The top of the sediment cores and 61cm correspond to the years 2006and 1942,respectively.The sedimentation time was divided into three sections in accord-ance with four dating scales:1942–1964,1964–1975,and 1975–2006.The rate of sedimentation in Songhua Lake was then calculated for each of these intervals.The years in each time section were achieved by linear interpolation.3Results and discussion3.1Characteristics of heavy metal distribution in sedimentsThe distributions of Cd,Cr,Cu,Hg,Ni,and Zn exhibit similar trends,in that their contents increase markedly from the deeper layers to the surface.Pb content of the sediments changes little,while Mn content decreases slightly from the bottom layers toward the top (see Fig.2).In the 1940s to 1970s,Cd contents were rather low (generally below 0.1m g/g)and relatively constant.From the mid-1960s onward,Cd content began to increase rapidly,peaking in the mid-1970s and exhibiting a subsequent decrease.From the mid-1980s onward,Cd content began to rise gradually,peaked in the early 1990s,and then became fluctuated between 0.20and 0.23m g/g.After 2004,Cd con-centration showed a rapid rise to a highest value (0.32m g/g)in 2006.Cr,Cu,and Ni exhibited similar distribution characteristics to Cd.From the 1940s until the mid-1990s,their contents increased slowly and peaked in the mid-1950s,mid-1970s,and mid-1990s,respect-ively.Concentrations of all three elements began to fall from the mid-1990s.From the late 1940s to late 1960s,concentrations of Hg in the sediments of Songhua Lake rose slightly and gradually from 0.016to 0.041m g/g.In the 1970s,Hg contents began to rise rapidly,peaking in the mid-1970s.Subsequently,Hg concentrations decreased first,then increased,reaching a peak in the mid-1990s at concentrations of 0.12m g/g.Then,concentrations decreased again,and keeping fluctuating around 0.08m g/g.From the 1940s until the end of the 1960s,Zn contents increased slowly.Conversely,the rate of increase of Zn concentrations was slightly larger in the mid-1990s and 2004.Pb content did not change markedly,exhibiting only three minor peaks in 1960,1969,and 1972.Overall,Mn content decreased slowly year by year.Overall,the contents of Cd,Cr,Cu,Hg,and Ni in the sediments of Songhua Lake began to increase gradually in the 1940s and reached peak concentrations in the mid-1970s.Concentrations of Cd,Cr,Cu,Hg,and Ni increased rapidly from the mid-1980s until the mid-1990s,which coincided with a period of rapid development of the economy,overexploitation of forest resources,and severe water loss and soil erosion in China.After the mid-1990s,concentrations of Cr,Cu,Hg,and Ni in sediments decreased gradually,it was due to the fact that the implementation of a project designed to protect natural forest resources,control deforestation in the upper reaches of theSonghuaFigure 1.Sampling location of the sediment cores in SonghuaLake.Evolution of Heavy Metals in Songhua Lake 1011Table 1.Analysis results of the elements in the sediment core from Songhua LakeDepth (cm)Period Sedimentation rate (cm/a)Si Al Ti Fe Mg Ca Na K P Cd Cr Cu Hg Mn Ni Pb Zn0–1200630.977.724775 3.800.750.69 1.27 2.058180.3268.322.90.09174324.527.986.91–231.747.434649 3.390.700.75 1.44 2.077100.2561.922.70.06862423.424.4105.02–331.547.334629 3.420.680.69 1.10 2.057080.2362.423.10.08061724.127.284.83–431.507.624722 3.560.720.68 1.34 2.067300.2363.824.30.09661926.824.689.64–5200031.527.634770 3.590.730.66 1.33 2.047300.2366.124.80.08061325.726.791.05–631.277.594701 3.600.710.69 1.36 2.037860.2264.823.30.07162926.222.391.76–719980.7130.907.904818 3.860.780.63 1.22 2.037770.2068.625.80.09263429.629.297.57–829.608.304997 4.470.870.59 1.05 2.039230.2080.931.80.12067535.329.4106.08–9199529.808.184995 4.400.840.60 1.13 2.019050.2275.430.70.10067134.526.5106.09–1031.287.894727 3.850.760.61 1.21 2.028060.2168.126.30.08863429.029.593.610–1131.287.824750 3.810.750.60 1.19 2.027740.2368.426.10.07362027.626.290.711–12199031.397.874688 3.760.740.64 1.26 2.077990.1864.224.70.07064028.427.491.712–1331.267.784447 3.640.710.69 1.40 2.088370.1660.422.30.06363924.427.887.913–1431.377.844377 3.510.710.72 1.43 2.138180.1561.822.00.06264624.926.992.114–15198631.417.974464 3.610.730.69 1.37 2.168130.1660.223.30.06264725.825.288.815–16198531.247.674188 3.380.660.72 1.19 2.157760.1456.722.60.05563323.628.786.516–1731.817.884292 3.450.680.75 1.55 2.167960.1555.922.20.06166023.425.189.617–1831.197.794312 3.430.700.73 1.46 2.118110.1657.621.40.05465224.827.190.718–19198031.507.884359 3.440.700.74 1.48 2.147780.1556.322.30.06265924.826.089.119–2031.717.834393 3.380.680.73 1.51 2.167120.1659.323.10.07764625.227.091.020–2131.577.904339 3.310.690.76 1.52 2.157240.1658.521.00.05964623.026.289.921–2230.958.154686 3.630.770.66 1.24 2.097890.1967.726.40.07865128.429.798.822–23197531.047.944342 3.450.700.75 1.48 2.127760.1758.022.00.06565824.427.092.023–2431.687.914299 3.280.690.75 1.51 2.177210.1657.021.30.05963523.324.088.124–2532.197.584102 3.120.610.81 1.73 2.206990.1650.320.10.03764520.522.389.125–2632.167.634116 3.110.620.81 1.65 2.187210.1550.120.10.03864420.537.386.926–2731.637.663947 3.090.630.81 1.67 2.227420.1245.419.80.04162919.824.484.927–28 1.2731.997.723805 3.120.600.87 1.81 2.277690.0943.718.50.03666119.224.683.628–29197031.167.593847 3.250.560.91 1.47 2.178260.1342.618.70.03671517.421.485.529–3030.897.913911 3.350.610.96 1.90 2.199060.1142.316.70.03772717.621.787.730–3131.308.003856 3.360.610.97 1.93 2.229240.1140.617.10.03974018.138.088.331–3231.538.073843 3.400.610.98 1.95 2.259390.1040.616.10.04374915.525.086.332–3331.107.993794 3.370.600.99 1.97 2.229530.1040.517.30.03873916.722.989.333–3431.707.943786 3.380.57 1.01 2.06 2.238990.1037.716.40.03575416.722.388.234–3532.037.883709 3.290.55 1.01 2.11 2.278490.0936.214.80.03374515.721.185.335–36196530.907.943669 3.320.580.99 2.03 2.229230.0940.416.50.03472716.323.285.936–37196431.777.803606 3.240.53 1.01 2.17 2.278250.1034.914.50.03373814.421.283.037–3831.617.873522 3.220.55 1.01 2.14 2.288610.1035.416.30.03472014.622.083.438–3931.867.873565 3.270.54 1.01 2.16 2.318510.0833.415.30.03473914.724.282.739–4031.897.793528 3.210.53 1.01 2.17 2.328270.0731.615.30.03173513.722.280.240–41196031.817.953510 3.230.550.99 2.10 2.338880.0935.716.00.03572714.524.781.241–4231.757.873430 3.200.53 1.01 2.14 2.358700.0934.814.70.02973414.135.479.342–4332.277.583590 3.200.47 1.03 2.30 2.417670.0730.012.80.02580710.922.174.943–4431.857.823555 3.280.530.99 2.07 2.338970.0936.016.50.03278615.823.181.944–4531.447.983519 3.410.560.99 2.00 2.269920.1139.617.40.03880615.122.680.445–46195631.137.893378 3.350.55 1.00 2.06 2.279710.1037.515.70.03580016.325.681.046–47195531.527.853361 3.330.53 1.02 2.12 2.299440.0836.216.40.03583216.321.880.347–48 1.0931.117.843296 3.320.53 1.03 2.11 2.279780.0834.516.50.03284123.022.079.848–49195332.037.573147 3.080.47 1.00 2.14 2.378350.0731.114.60.02880414.620.973.849–5031.827.613094 3.040.48 1.01 2.17 2.368640.0830.913.70.02978014.423.073.450–51195131.667.723245 3.100.50 1.01 2.15 2.368970.0831.015.80.02980915.124.076.451–52195032.637.673162 2.930.47 1.01 2.15 2.518120.0829.414.00.02679612.718.569.652–5333.127.462826 2.650.420.97 2.23 2.597140.0626.214.70.02271812.622.766.053–5433.117.432962 2.770.430.98 2.21 2.527140.0725.813.70.02177013.319.567.954–5532.717.473000 2.710.43 1.01 2.31 2.566820.0725.213.10.02078510.523.265.655–5633.207.332902 2.730.410.99 2.31 2.546270.0624.312.40.01878811.221.066.056–5733.257.372703 2.580.410.96 2.26 2.616530.0623.613.20.01774211.522.663.257–58194533.837.152332 2.280.360.89 2.27 2.715890.0522.312.40.01864010.221.956.858–5933.817.252394 2.370.360.91 2.31 2.725780.0520.812.50.01664711.021.258.759–6033.597.292511 2.470.380.94 2.33 2.645850.0522.911.40.02066910.321.159.760–61194233.747.5325552.470.400.942.292.696170.0723.413.40.02365511.621.360.7Note :The content unit of Si,Al,Fe,Mg,Ca,Na,and K is 10À2;and that of others is 10À6.1012L.Hao etal.Lake basin,and mitigate water and soil loss by reforestation.It is worth noting that Cd contents of the sediments have continued to increase since the 1990s,because Cd contents have not been con-trolled effectively.The concentration of heavy metal elements in the sediments depends not only on natural transportation and anthropogenic discharge,but also on surface characteristics,organic content,mineral constituents,depositional environments,and many other factors [14].It is known that that the metal element content of sediments is correlated positively with their clay (Clay is a general term including many combinations of one or more clay minerals with traces of metal oxides and organic matter.)or silt contents under natural conditions [15–17].The influence of sediment proper-ties (e.g.grain size,mineralogy)on changes in metal element con-tents is thought to be 80–90%[18].Consequently,when analyzing the changing regularity of heavy metal content and the material sources of the sediments,it is necessary to eliminate or reduce the effects of grain size and changes in mineral composition on metal concentrations and to calibrate and normalize the heavy metal content in the sediments.In this study,Ti and clay minerals (namely,the ratios of metal content to Ti content and metal content to clay mineral content)were used for normalization of heavy metal con-centrations in the sediments.Clay mineral contents were calculated numerically [19].Normalization as described above eliminated the increasing tendencies of Cd,Cu,Hg,Ni,and Zn in the sediments of Songhua Lake from the 1940s to the 1970s (see Fig.3a and b);this indicates that the increase of Cd,Cu,Hg,Ni,and Zn concentrations in the sediments during this period likely corresponded to increasing clay mineral content in the sediments.However,Cr contents and Pb and Zn contents continued to exhibit increasing and slowly decreasing trends,respectively,even after the normalization of clay minerals and Ti.Furthermore,both the clay content and the concentrations of Cr,Cu,Ni,and Zn in the sediments were decreasing from the mid-1990s until 2006.However,Cd concen-trations in the sediments continued to increase rapidly and Hg concentrations fluctuated around a high value.Thus,it can be concluded that variation in clay content is not the only factor influencing changes in heavy metal concentrations in the sediments of Songhua Lake.3.2Evaluation of heavy metal pollution in sedimentsThe enrichment coefficient (K sef )and geoaccumulation index (I geo )were used in this study to investigate pollution levels for the sediments in SonghuaLake.Figure 3.Metal content normalized by clay and Ti content versus depth profiles for sediment core at SonghuaLake.Figure 2.Vertical distribution map of heavy metals in the sediments of SonghuaLake.Evolution of Heavy Metals in Songhua Lake 1013The following formula was used for calculation of the enrichment coefficient of the heavy metals in the lake sediments [20].K Sef ¼S n =S refn ref;(1)where S n is the concentration of the heavy metal in the sediments;S ref ,the content of the reference element in the sediments;a n ,the concentration of the heavy metal in the sediments without pollution (i.e.the background concentration of the heavy metal);and a ref ,the concentration of heavy metal in the sediments that are not polluted (i.e.the background value of the reference element).Ti was chosen as the reference element in this work,and the mean value of Ti in 2358pieces of heavy metal from the deep soil in the Songhua Lake district (an area of about 38000km 2)was used as the background value (see Table 2).The concentration factors of heavy metals in the sediments of Songhua Lake were calculated accord-ingly.The concentration factors of Cr,Cu,Mn,Ni,Pb,and Zn were all approximately 1,which can be categorized as no or slight pollution.However,the concentration factors of Cd and Hg were >2in the 1970s,indicating a moderate degree of pollution.The geoaccumulation index was calculated according to the fol-lowing equation [21]:I geo ¼log 2C n n(2)where C n is the concentration of metal n in the sediments;B n ,the background value of the elements in the sediments (ordinary shale);and k is a constant reflecting changes in the background value as a result of diagenesis (generally assumed to be 1.5).The mean value of heavy metals in the deep soil in the Songhua Lake area was used as the background value with k ¼1.5.Thus,the geological cumulative index of heavy metal elements in the lake sediments could be calculated.According to the pollution degree evaluation classification method (see Table 3),the geological cumu-lative indexes of Cu,Cr,Mn,Ni,Pb,and Zn were negative value,indicating no pollution.The index for Cd was negative value prior to the 1970s,indicating no pollution;however,from 1970to 1993,the geological cumulative index of Cd was <0.5,approaching the boundary between no pollution and moderate pollution.Since the mid-1990s,Cd pollution has increased gradually,with a geological cumulative index of 0.57–1.25(moderate pollution).Before the 1970s,the geological cumulative index of Hg was negative value;from 1973to 1994,its index was 0.26–0.70,and Hg pollution inten-sified in the mid-1990s,approaching moderate pollution.However,in contrast to Cd pollution,that of Hg was controlled and has been maintained below a certain level since the mid-1990s,with no notable increases.3.3Heavy metal contents in the sedimentsThe lake sediments originated primarily from fluvial transport and dry deposition from the atmosphere.The concentrations of heavy metals in the sediments vary considerably between the inflowing rivers (see Table 4).Cd contents were high in the Huifa River and the main trunk stream of the Second Songhua River,exhibiting con-siderable variability within the Huifa River.Conversely,Cd content was relatively low in the Jiaohe River.Concentrations of Hg and Pb were similar for all rivers.The sediment of the Second Songhua River exhibited the highest contents of Mn and Zn,while Cr,Ni,and Cu contents were higher in the Huifa River.Therefore,the mass ratio of transported substance affects the distribution of heavy metals in sediments directly.The concentrations of heavy metal elements in the clay fraction were higher than those in the sediments (see Table 5):the Hg content of the clay fraction was 7.3–13.7times that in the sediments,the Cd content of the clay fraction was 2.5–8.9times that in the sediments,and the Cu content of the clay fraction was 3.9–4.4times that in the sediments.The contents of other heavy metal elements in the clay were generally more than twice those in the sediments,indicating that an increase of the clay component will increase the heavy metal content of sediments.The continuous deposition of sediments in Songhua Lake was affected by the construction of the Baishan and Hongshi hydropower station in the upper reaches of the Second Songhuajiang River in the 1980s.This would have influenced the relative input of major materials entering the lake and the ratio of sand and clay in the imported materials.Previous research has indicated that,in the mid-1970s,the sand content of the Huifa River was 3.6times greater than that of the Second Songhua River [22].Study of suspended matter in the Second Songhuajiang River in 2006indicated that the suspended matter content in the Huifa River in dry season was 15times that in the trunk stream of the Second Songhuajiang River.Furthermore,the suspended material content of the Huifa River in the wet season is known to be 269times that of the trunk stream of the Second Songhuajiang River,reflecting an increase in input from the Huifa River basin to Songhua Lake.The concentrations of Mn and Zn in the Huifa River sediments are rather low,and Zn contents were lower inTable 2.Evaluation criteria for the background value and pollution of heavy metals in the sediments of Songhua LakeElement Background value (m g/g)Pollution degree evaluation classification method [17,18]K SefPollution I geo PollutionCd 0.09<2None or slight <0No pollution Cr 62.22–5Moderate0–1None or mid Cu 21.75–20Relatively high 1–2ModerateHg 0.0320–40High degree 2–3Moderate to high degree Mn 772>40Extremely high3–4High degreeNi 28.14–5High or Extremely high Pb 25.4>5Extremely highZn 68.8Ti 44681014L.Hao etal.Table 3.The calculation results of enrichment coefficient (K sef )and geoaccumulation index (I geo )Depth (cm)K sefI geoCd Cr Cu Hg Mn Ni Pb Zn Cd Cr Cu Hg Mn Ni Pb Zn 0–1 3.3 1.0 1.0 2.80.90.8 1.0 1.2 1.25À0.45À0.51 1.02À0.64À0.78À0.45À0.251–2 2.7 1.0 1.0 2.20.80.80.9 1.50.89À0.59À0.520.60À0.89À0.85À0.640.022–3 2.5 1.0 1.0 2.60.80.8 1.0 1.20.77À0.58À0.490.83À0.91À0.81À0.49À0.283–4 2.4 1.0 1.1 3.00.80.90.9 1.20.77À0.55À0.42 1.09À0.90À0.65À0.63À0.204–5 2.4 1.0 1.1 2.50.70.9 1.0 1.20.77À0.50À0.390.83À0.92À0.71À0.51À0.185–6 2.3 1.0 1.0 2.20.80.90.8 1.30.70À0.53À0.480.66À0.88À0.69À0.77À0.176–7 2.1 1.0 1.1 2.80.8 1.0 1.1 1.30.57À0.44À0.34 1.03À0.87À0.51À0.38À0.087–8 2.0 1.2 1.3 3.60.8 1.1 1.0 1.40.57À0.21À0.03 1.42À0.78À0.26À0.370.048–9 2.2 1.1 1.3 3.00.8 1.10.9 1.40.70À0.31À0.08 1.15À0.79À0.29À0.520.049–10 2.2 1.0 1.1 2.80.8 1.0 1.1 1.30.64À0.45À0.310.97À0.87À0.54À0.37À0.1410–11 2.4 1.0 1.1 2.30.80.9 1.0 1.20.77À0.45À0.320.70À0.90À0.61À0.54À0.1911–12 1.9 1.0 1.1 2.20.8 1.0 1.0 1.30.42À0.54À0.400.64À0.86À0.57À0.48À0.1712–13 1.8 1.0 1.0 2.10.80.9 1.1 1.30.25À0.63À0.550.49À0.86À0.79À0.45À0.2313–14 1.7 1.0 1.0 2.10.90.9 1.1 1.40.15À0.59À0.570.46À0.84À0.76À0.50À0.1614–15 1.8 1.0 1.1 2.10.80.9 1.0 1.30.25À0.63À0.480.46À0.84À0.71À0.60À0.2215–16 1.7 1.0 1.1 2.00.90.9 1.2 1.30.05À0.72À0.530.29À0.87À0.84À0.41À0.2516–17 1.70.9 1.1 2.10.90.9 1.0 1.40.15À0.74À0.550.44À0.81À0.85À0.60À0.2017–18 1.8 1.0 1.0 1.90.90.9 1.1 1.40.25À0.70À0.610.26À0.83À0.77À0.49À0.1918–19 1.70.9 1.1 2.10.90.9 1.0 1.30.15À0.73À0.550.46À0.81À0.77À0.55À0.2119–20 1.8 1.0 1.1 2.60.90.9 1.1 1.30.25À0.65À0.490.77À0.84À0.74À0.50À0.1820–21 1.8 1.0 1.0 2.00.90.8 1.1 1.30.25À0.67À0.630.39À0.84À0.87À0.54À0.2021–22 2.0 1.0 1.2 2.50.8 1.0 1.1 1.40.49À0.46À0.300.79À0.83À0.57À0.36À0.0622–23 1.9 1.0 1.0 2.20.90.9 1.1 1.40.33À0.69À0.570.53À0.82À0.79À0.50À0.1723–24 1.8 1.0 1.0 2.00.90.9 1.0 1.30.25À0.71À0.610.39À0.87À0.86À0.67À0.2324–25 1.90.9 1.0 1.30.90.8 1.0 1.40.25À0.89À0.70À0.28À0.84À1.04À0.77À0.2125–26 1.80.9 1.0 1.40.90.8 1.6 1.40.15À0.90À0.70À0.24À0.85À1.04À0.03À0.2526–27 1.50.8 1.0 1.50.90.8 1.1 1.4À0.17À1.04À0.72À0.13À0.88À1.09À0.64À0.2827–28 1.20.8 1.0 1.4 1.00.8 1.1 1.4À0.58À1.09À0.82À0.32À0.81À1.13À0.63À0.3028–29 1.70.8 1.0 1.4 1.10.7 1.0 1.4À0.05À1.13À0.80À0.32À0.70À1.28À0.83À0.2729–30 1.40.80.9 1.4 1.10.7 1.0 1.5À0.30À1.14À0.96À0.28À0.67À1.26À0.81À0.2330–31 1.40.80.9 1.5 1.10.7 1.7 1.5À0.30À1.20À0.93À0.21À0.65À1.220.00À0.2231–32 1.30.80.9 1.7 1.10.6 1.1 1.5À0.43À1.20À1.02À0.07À0.63À1.44À0.61À0.2632–33 1.30.80.9 1.5 1.10.7 1.1 1.5À0.43À1.20À0.91À0.24À0.65À1.34À0.73À0.2133–34 1.30.70.9 1.4 1.20.7 1.0 1.5À0.43À1.31À0.99À0.36À0.62À1.34À0.77À0.2334–35 1.20.70.8 1.3 1.20.7 1.0 1.5À0.58À1.37À1.14À0.45À0.64À1.42À0.85À0.2735–36 1.20.80.9 1.4 1.10.7 1.1 1.5À0.58À1.21À0.98À0.40À0.67À1.37À0.72À0.2636–37 1.40.70.8 1.4 1.20.6 1.0 1.5À0.43À1.42À1.17À0.45À0.65À1.55À0.85À0.3137–38 1.40.7 1.0 1.4 1.20.7 1.1 1.5À0.43À1.40À1.00À0.40À0.69À1.53À0.79À0.3138–39 1.10.70.9 1.4 1.20.7 1.2 1.5À0.75À1.48À1.09À0.40À0.65À1.52À0.65À0.3239–40 1.00.60.9 1.3 1.20.6 1.1 1.5À0.95À1.56À1.09À0.54À0.66À1.62À0.78À0.3640–41 1.30.70.9 1.5 1.20.7 1.2 1.5À0.58À1.39À1.02À0.36À0.67À1.54À0.63À0.3541–42 1.30.70.9 1.3 1.20.7 1.8 1.5À0.58À1.42À1.15À0.63À0.66À1.58À0.11À0.3842–43 1.00.60.7 1.0 1.30.5 1.1 1.4À0.95À1.64À1.35À0.85À0.52À1.95À0.79À0.4643–44 1.30.7 1.0 1.3 1.30.7 1.1 1.5À0.58À1.37À0.98À0.49À0.56À1.42À0.72À0.3344–45 1.60.8 1.0 1.6 1.30.7 1.1 1.5À0.30À1.24À0.90À0.24À0.52À1.48À0.75À0.3645–46 1.50.8 1.0 1.5 1.40.8 1.3 1.6À0.43À1.31À1.05À0.36À0.53À1.37À0.57À0.3546–47 1.20.8 1.0 1.6 1.40.8 1.1 1.6À0.75À1.37À0.99À0.36À0.48À1.37À0.81À0.3647–48 1.20.8 1.0 1.4 1.5 1.1 1.2 1.6À0.75À1.44À0.98À0.49À0.46À0.87À0.79À0.3748–49 1.10.7 1.0 1.3 1.50.7 1.2 1.5À0.95À1.58À1.16À0.68À0.53À1.53À0.87À0.4849–50 1.30.70.9 1.4 1.50.7 1.3 1.5À0.75À1.59À1.25À0.63À0.57À1.55À0.73À0.4950–51 1.20.7 1.0 1.3 1.40.7 1.3 1.5À0.75À1.59À1.04À0.63À0.52À1.48À0.67À0.4351–52 1.30.70.9 1.2 1.50.6 1.0 1.4À0.75À1.67À1.22À0.79À0.54À1.73À1.04À0.5752–53 1.10.7 1.1 1.2 1.50.7 1.4 1.5À1.17À1.83À1.15À1.03À0.69À1.74À0.75À0.6453–54 1.20.6 1.0 1.1 1.50.7 1.2 1.5À0.95À1.85À1.25À1.10À0.59À1.66À0.97À0.6054–55 1.20.60.9 1.0 1.50.6 1.4 1.4À0.95À1.89À1.31À1.17À0.56À2.01À0.72À0.6555–56 1.00.60.90.9 1.60.6 1.3 1.5À1.17À1.94À1.39À1.32À0.56À1.91À0.86À0.6456–57 1.10.6 1.00.9 1.60.7 1.5 1.5À1.17À1.98À1.30À1.40À0.64À1.87À0.75À0.7157–58 1.10.7 1.1 1.1 1.60.7 1.7 1.6À1.43À2.06À1.39À1.32À0.86À2.05À0.80À0.8658–59 1.00.6 1.1 1.0 1.60.7 1.6 1.6À1.43À2.17À1.38À1.49À0.84À1.94À0.85À0.8159–60 1.00.70.9 1.2 1.50.7 1.5 1.5À1.43À2.03À1.51À1.17À0.79À2.03À0.85À0.7960–611.40.71.11.31.50.71.51.5À0.95À2.00À1.28À0.97À0.82À1.86À0.84À0.77Evolution of Heavy Metals in Songhua Lake 1015。
Distribution of heavy metals in sediments of MwanzaGulf of Lake Victoria,TanzaniaM.A.Kishe a,*,J.F.Machiwa baTanzania Fisheries Research Institute,P .O.Box 475,Mwanza,TanzaniabDepartment of Zoology and Marine Biology,University of Dar es Salaam,P .O.Box 35064,Dar es Salaam,TanzaniaAbstractSediment samples were analyzed for Cd,Cr,Cu,Pb,Hg and Zn by AAS.The highest concentrations (ppm)for Cu (26.1F 4.8),Hg (0.2F 0.05),Pb (30.7F 5.6)and Zn (45.4F 13.1)were found at approximately 25m from the shoreline.Generally,heavy metals concentration in the sediment decreased with increasing distance from the shoreline except for Cd and Cr whose highest concentrations were found at approximately 2000m from the shoreline.The data also indicated that sediment samples which were collected at the shores within the urban area of Mwanza showed elevated levels of Pb (54.6F 11.1ppm)and Zn (83.7F 21.5ppm).However,the highest concentrations of Cd (7.0F 2.1ppm),Cr (12.9F 1.0ppm)and Hg (2.8F 0.8ppm)were recorded at sampling stations which were adjacent to river mouths.D 2002Elsevier Science Ltd.All rights reserved.Keywords:Sediment;Heavy metals;Mwanza Gulf;Lake Victoria;Tanzania1.IntroductionBottom sediments serves as a reservoir for heavy metals and therefore deserve special consideration in the planning and design of aquatic pollution research studies.An un-disturbed sediment column contains a historical record of geochemical characteristics in the watershed.If a suffi-ciently large and stable sediment sink can be located and studied,it will allow an investigator to evaluate geochemical changes over time,and possibly,to establish baseline levels against which current conditions can be compared and con-trasted.Heavy metals such as cadmium,mercury,lead,copper and zinc are regarded as serious pollutants of aquatic ecosystems because of their environmental persistence,tox-icity and ability to be incorporated into food chains (Fo ¨rstner and Wittman,1983).In Lake Victoria,industrial,agricultural and domestic waste discharges have increased the levels of heavy metals in the lake (Mpendazoe et al.,1993;Muli,1996).A study conducted by NEMC (1994)on heavy metal pollution in open pits in gold mining areas in the lake zonerevealed that mercury levels were significantly higher than the permissible level of 1A g l À1in drinking water.Kahatano et al.(1995)also found high levels of Pb,Cu,Cr,Zn and Hg in water,sediments and soil of some streams and rivers in goldfield.These metals possibly end up in the lake.Previous studies (Hamza,1996;Kondoro and Mikidadi,1998;Mohammed,2000)showed wide variation of heavy metal contamination in water,sediment,fish and flora within Mwanza urban area (Mwanza South,Central and North)of Lake Victoria.A significant difference was found between concentrations of heavy metals in urban and rural areas (Mohammed,2000).The industrial area located in Mwanza north was found to contain relatively higher levels of heavy metals.Apart from mining activities,municipal and industrial discharges are contributing on heavy metal pollution in Lake Victoria.Other possible sources of heavy metals include water and road traffic.Heavy metals that are mostly a result of technological development (e.g.Cu and Zn)occur at significant concentrations in the lake sediments (Onyari and Wandiga,1989;Mwamburi and Oloc,1997).Generally,the sediments of Lake Victoria,are rich in Pb,Cu and Mn compared to values reported in sediments collected from other areas within the East African sub-region (FAO/CIFA,1994;Mwamburi and Oloc,1997).In this paper,the concentrations of heavy metals obtained from sites adjacent to possible point sources in Mwanza Gulf0160-4120/02/$-see front matter D 2002Elsevier Science Ltd.All rights reserved.PII:S 0160-4120(02)00099-5*Corresponding author.Tel.:+255-744-467911;fax:+255-28-2550036.E-mail address:maria _kishe@ (Mary Alphoce Kishe)./locate/envintEnvironment International 28(2003)619–625of Lake Victoria are reported.The variations of levels of heavy metals in sediment with increasing distance from the shoreline towards deep water are discussed.2.Materials and methods2.1.Study areaLake Victoria is the second largest freshwater body in the world with an area of68,800km2.It is situated at latitude 1j N and4j S and longitude31j E and35j E at an elevation level of1134m above sea level(Van Densen and Witte, 1995).The rocks underlying the Lake basin are either Precambrian or Tertiary volcanoes depending on the loca-tion.Pleistocene and Holocene fine grained sediments overly these basement rocks(Scholz et al.,1990;Wakeham, 1990).The recent sedimentary regime of the lake is com-plex,however,deposition rates range from zero to about1 mm per annum in bays(Scholz et al.,1990)or more than1 cm per millennium in the open lake(Hecky et al.,1996). Surface sediments are dominated with biogenic remains and the organic carbon content is between10%and20%in bays and depositional basins.Non-depositional areas arecharac-Fig.1.Map Mwanza Gulf,showing the sampling stations.M.A.Kishe,J.F.Machiwa/Environment International28(2003)619–625620teristically sandy,containing low organic carbon(Mother-sill,1976;Wakeham,1990).Lake Victoria is shared by three riparian states,Kenya, Uganda and Tanzania.On the Tanzanian side,Mwanza City and two other major towns(Musoma and Bukoba)are located at the lake shore with a population of about5 million people(LVEMP,1999).Mwanza Gulf is one of the largest gulf at the southern end of Lake Victoria(Fig.1). The gulf extends60km southward with an average width of 5km and a surface area of approximately500km2(Van Densen and Witte,1995;LVEMP,1999).2.2.Sample collection and analysisSelection of sampling stations for sediment samples considered the outlets for canals,streams and rivers which drain residential,commercial(garages,metal works and markets),industrial and mining areas into the lake.Thirty-one sampling stations were selected to provide information on the impact of natural and anthropogenic inputs of heavy metals into Mwanza Gulf of Lake Victoria.At each sampling station,sediment samples were collected at three sampling points that were located in the lake at approximately25,500 and2000m from the shoreline,i.e.at an increasing distance toward the deep water.For convenience purposes,the31 sampling sites were categorized into three groups.The first category was sampling stations adjacent to beaches within the city(CA)which included stations1,2,3,4and5.The selected beaches within the city were in close proximity to commercial areas,such as market places,small-scale metal works,manufacturing industries,factories and ports. Streams within the city and storm water outfalls were also included.The second were stations adjacent to river mouths (RM)which included stations6,7,10,15,16,19,21,25,26, 31and third one were stations adjacent to fish landing beaches(FB)which included stations8,9,11,12,13,14, 17,18,20,22,23,24,27,28,29,and30.All beaches were in the suburbs and rural areas.Bottom sediment samples were collected during March and April2000,using a box corer aboard an outboard engine fiberglass boat.Surface sediment(<5cm)samples were transferred into labeled polyethylene bags and stored in the laboratory atÀ20j C until analysis.Sediment samples were thawed,then transferred into acid washed plastic containers and freeze-dried for72h(Machiwa,1992).The samples were sieved through a2-mm sieve so as to remove any large debris and were then thoroughly homogenized using a pestle and mortar.An extensive quality assurance/quality control procedure was followed.Quality control samples that were analyzed included methods blanks,sample replicates,ana-lyte spikes and surrogate spikes.Duplicate sub samples of approximately0.5g of well homogenized sediment samples were accurately weighed on an analytical balance and then transferred into glass diges-tion tubes.Concentrated sulphuric(1ml)and nitric(1ml) acids(AnalaR R)were used to leach the samples.The extracts were diluted to a final volume of10ml using de-ionized water.The concentrations of Cd,Cr,Cu,Hg,Pb and Zn were determined in the supernatant using an Atomic Absorption Spectrophotometer(AAS),Varian model Spec-tra A55.All heavy metals except Hg were analyzed in the flame mode.Mercury was analyzed by cold vapour techni-que with an automatic hydride generator.Sub-samples of freeze-dried sediment(d>0.0125mm) were placed on mechanical shaker and grain size was deter-mined using a series of sieves while the small particle sizes (d<0.125mm)were determined by sedimentation.The two results were combined to one particle size distribution curve.3.Results3.1.Heavy metal levels in sediments from selected locationsHeavy metal concentrations in bottom sediments from stations adjacent to urban beaches(CA)revealed remarkable differences from other sampling stations.The highest mean levels of Zn(83.7F21.5ppm)and Pb(54.6F11.1ppm) were found at sampling stations that were located adjacent to beaches within the city area.‘‘Hot spots’’for Zn pollution were noted at station3(244.7ppm)and station4(254.4 ppm).Station3was Mirongo area while station4was Mwanza South.The highest Pb concentration(189.0ppm) was recorded at station4.The mean concentrations of Cr (11.2F1.2),Cu(17.9F2.3)and Hg(0.1F0.03)were gen-erally low(Fig.2a and b).Heavy metal concentrations in bottom sediments from stations adjacent to fish landing beaches(FB)had relatively low mean concentrations of all the analyzed metals except Cd (Fig.2a and b).The mean concentration of Cu was22.3F3.0 ppm,the highest concentration of Cu(136.8ppm)was recorded at station12(Kigongo area).The mean concen-tration of Pb was23.0F1.2ppm,Zn was22.0F0.7ppm and Cr was10.9F1.0ppm.Highest concentration of Zn was found at station18(Mbalika),the value was32.2ppm. Cadmium concentration(4.0F0.02ppm)in FB sampling station was rather higher than its mean concentration (3.7F1.1ppm)that was obtained at CA station category. Stations20(Kaningu),22(Mulaga),23(Busisi)and24 (Nyamasale)had Cd concentration below detection limit (0.01ppm).Mercury concentration in the sediment samples from stations near fish landing beaches was mostly below the detection limit(0.1ppm),the mean concentration was 0.1F0.03ppm.Heavy metal concentrations in bottom sediments from stations adjacent to river mouths(RM)were almost similar to values obtained at FB.The concentration of Cr was 12.9F1.0ppm and Cu was22.5F2.9ppm.The highest concentration of Cu(89.1ppm)was found at station10 (Nyashishi river mouth).Chromium and copper levels were more or less uniform at the three categories of sampling stations(Fig.2a).The concentration of Pb(26.5F1.5ppm)M.A.Kishe,J.F.Machiwa/Environment International28(2003)619–625621was almost equal to that of Zn (27.1F 2.5ppm)obtained from RM sampling stations.The levels of Zn and Pb were very high at CA compared to other station categories of sampling.Highest Zn concentration (61.4ppm)was recorded in sediment samples from station 6(Mkuyuni river mouth).Fig.2b shows that RM category of stations had the highest mean concentrations of Cd (7.0F 0.2ppm)and Hg (2.8F 0.8ppm).Only stations 19(Isanga river mouth)and 21(Nyaruhwa)had Cd level below detection limit.3.2.Variation of heavy metal content in lake sediments with distance from shoreline3.2.1.Chromium,copper,lead and zincChromium concentrations in the lake sediments were 10.6F 1.7,11.4F 2.1and 12.8F 0.8ppm at approximate-ly 25,500and 2000m from the shoreline,respectively (Fig.3a).Friedman test indicated a significant difference (Fr =6.000,P =0.0498)in Cr concentration with increas-ing distance from the shoreline.Dunn’s multiple compa-rison test confirmed that the difference was significant (P <0.05)for the levels of Cr at 25and 2000m from the shoreline.The highest concentration of copper (26.1F 4.8ppm)was found at about 25m from the shoreline.The concen-tration of Cu was 18.9F 2.1ppm at 500m and 19.7F 1.2ppm at 2000m (Fig.3a).Statistically,the difference in concentration of Cu with increasing distance from the shoreline was not significantly different (P >0.05).The highest concentration of Pb (30.7F 5.6ppm)was found close to the shore at approximately 25m.Lead concentration was 30.5F 6.0ppm at 500m and 27.6F 1.3ppm at 2000m from the shoreline (Fig.3a).Friedman test and Dunn’s multiple comparison test (Zar,1984)wereusedFig.3.(a)Variation of mean (F SEM)concentrations (ppm,dry weight)of Cr,Cu,Pb and Zn in lake sediments with increasing distance from the shoreline (n =31per sampling distance).(b)Variation of mean (F SEM)concentrations (ppm,dry weight)of Cd and Hg in lake sediments with increasing distance from the shoreline (n =31per samplingdistance).Fig.2.(a)Mean (F SEM)concentrations of Cr,Cu,Pb and Zn (ppm,dry weight)in sediment samples collected at different locations at Mwanza Gulf.UA =Stations adjacent to Urban beaches (n =5);FB =stations adjacent to Fish landing beaches (n =10)and RM =stations adjacent to river mouths (n =16).(b)Mean (F SEM)concentrations of Cd and Hg (ppm,dry weight)in sediment samples collected at different locations at Mwanza Gulf.UA=Stations adjacent to Urban beaches (n =5);FB =sta-tions adjacent to fish landing beaches (n =10)and RM =stations adjacent to river mouths (n =16).M.A.Kishe,J.F .Machiwa /Environment International 28(2003)619–625622to compare level of heavy metals at25,500and2000m from the shoreline.However,the difference in the concentrations of Pb with increasing distance from the shoreline was not statistically significant(P>0.05).Zinc levels were45.4F13.1,36.4F9.5and28.2F1.9 ppm at approximately25,500and2000m from the shore-line,respectively.Statistical analysis indicated that levels of Zn in the sediment from all sampling stations did not change significantly(P>0.05)with increasing distance from shore-line.3.2.2.Cadmium and mercuryCadmium levels showed slight variations with increasing distance from shoreline(Fig.3b).The concentrations were 4.3F1.5ppm at25m, 3.6F1.4ppm at500m and 2.6F1.2ppm at2000m from shoreline.However,statis-tical analysis indicated that levels of Cd in sediment did not change significantly(P>0.05)with increasing distance from the shoreline.Mercury,the most toxic metal in the aquatic environ-ment,was below detection limit(0.01ppm)in sediments from the majority of the sampling stations.The mean concentrations were0.2F0.02,0.1F0.04and0.1F0.02 ppm at approximately25,500and2000m from the shore-line,respectively(Fig.3b).The mean concentrations did not differ(P>0.05)with increasing distance from the shoreline.3.3.Grain size distributionThe percentage distribution of clay,silt and sand in the sediments of Mwanza Gulf is shown in Table1.Depending on the sampling stations,the highest amounts of clay (28.2F11.5%)and sand(31.3F20.5%)were found at sampling stations that were adjacent to river mouths.The highest amount of silt(61.9F20.7%)was in sediments that were collected at stations adjacent to beaches within the city. Statistically,the differences in grain size composition of the sediments from the different station categories were not significant(P>0.05).The highest clay content in the sediment(25.5F10.5%) was found at2000m from the shoreline(Table1).Silt content(61.8F19.4%)was highest in sediments taken from 500m and sand content(42.5F26.2%)was highest at25m from the shoreline.The differences in grain size content of sediments collected at increasing distance from the shoreline was not statistically significant(P>0.05).4.Discussion4.1.Spatial distribution of heavy metals in Mwanza GulfSediment samples that were collected from stations adjacent to beaches within Mwanza City(CA)generally had higher concentrations of Pb and Zn than stations that were adjacent to rural beaches(FB)and river mouths(RM). The city area sampling stations comprised a number of places that were considered as point sources of pollution to the lake.For instance,Mirongo River,which is considered highly polluted,discharges industrial and domestic wastes from Mwanza City into the Mwanza Gulf.A number of activities,including fish processing industries,chemical industries(soap and oil),breweries,tanneries,beverages, metal works,oil depots,hospitals,hotels and restaurants are located in the city area.Such industrial and municipal wastes are discharged into the lake,either untreated or partially treated.The high levels of Pb and Zn in sediments from the city area sampling stations reflect the presence of lake polluting activities in the city.The most likely sources of Zn at the shores within the city are the Mirongo River and discharges from the Mwanza North harbour.The grain size distribution(Table1)and mineralogy of the sediments of the three categories of stations(CA,FB and RM)were almost similar and cannot account for differences in the levels of Pb and Zn.Domestic and industrial effluents,municipal runoffs and atmospheric deposition may be the major sources of the observed high level of Pb.The contribution of Pb from the use of leaded petrol in outboard boat engines and automo-biles and car batteries is possibly significant.Previous studies also have indicated elevated levels of heavy metals in aquatic systems receiving effluents from urban areas (Talbot and Chegwidden,1983;Mohammed,2000).The sources of the heavy metals were mainly industrial and domestic waste discharges.In some cases,the disposal of untreated sewage has been reported to contribute signifi-cantly to the level of heavy metals in the aquatic environ-ment(Talbot and Chegwidden,1983;Mohammed,2000). The more or less uniform concentrations of Cr and Cu in lake sediment reflect their natural background levels in the local soils.Cd and Hg were highest in sediments that were collected at stations adjacent to river mouths.Some of these rivers and streams drain gold mining areas(Mpenda-zoe et al.,1993;NEMC,1994;Kahatano et al.,1995).The occurrence of highest Hg content in sediments of the RMTable1Percentage grain size distribution(mean F SD)in sediments samples collected from Mwanza Gulf(n=12)Sediment type Sampling station Distance from the shore(m)CA FB RM255002000Clay16.1F11.017.3F8.628.2F11.517.6F10.718.5F12.625.5F10.5 Silt61.9F20.754.4F18.941.0F17.041.5F19.561.8F19.454.0F18.4 Sand23.7F26.628.1F20.731.3F20.542.5F26.221.4F15.520.0F17.7M.A.Kishe,J.F.Machiwa/Environment International28(2003)619–625623category suggests an anthropogenic origin,for instance,use of mercury by small scale gold miners to extract gold from sand (Kahatano et al.,1995)from early 1990s.River Isanga and its tributaries drain the mining areas of Geita goldfield (NEMC,1994).Apart from the RM sediments,Cd was also high in sediments that were collected at stations adjacent to rural beaches (FB).The results possibly suggest an anthropogenic input of Cd contained materials directly to the lake or through rivers that pour their water to the Lake Victoria.The most likely source is a result of land degradation and/or the use of inorganic fertilizers in agri-culture.The results of the present study show that heavy metals content of sediments in Mwanza Gulf on the Tanzanian side of Lake Victoria is generally lower than those reported in the Kenyan and Ugandan sides of Lake Victoria (Table 2).The concentrations of Cd,Cu and Pb obtained in this study are higher than those reported in Lake Kariba and River Kali Nadi in 1977and 1988,respectively (Table 2).4.2.Variation in heavy metal levels in lake sediments with increasing distance from the shorelineIt was assumed that point sources of heavy metals in the lake are located on beaches at the shoreline.All heavy metals,except Cr,did not show any significant variation in their concentrations in the sediment with increasing distance from the shoreline.The levels of Cr in the sediment at 25and 2000m from the shoreline varied significantly.The highest mean Cr concentration was recorded at 2000m from the shoreline.The difference in the spatial distribution of heavy metals in an area can be due to several factors,for instance,the differences in chemical composition of sedi-ment,grain size distribution in the sediment and organic matter content of the sediment.Grain size distribution in the lake sediments was almost uniform with increasing distance from the shoreline (Table 1).There was no clear reason for having relatively high Cr concentration at 2000m than at 25m from the shoreline.In conclusion,this study has shown that sediments of Mwanza Gulf,especially in the urban area,are polluted with heavy metals.Interventions should be made to reduce anthropogenic discharges in Lake Victoria basin;otherwise,heavy metals may increase in the lake,resulting in the elevated concentration in fish and humans.AcknowledgementsThe authors are grateful to the Lake Victoria Environ-mental Management Project (LVEMP)for funding this study.We are also grateful for logistic support from the Director General of Tanzania Fisheries Research Institute,Prof.P.O.J.Bwathondi,Mr.S.Mahongo (LVEMP Compo-nent Coordinator)and Mr.Gowele of SEAMIC who helped with analysis of heavy metals.ReferencesAjmal M,Uddin R,Khan AU.Heavy metals in water,sediments,plants and fish of Kali Nadi U.P (India).Environ Int 1988;14:515–23.Berg H,Kautsky N.Persistent pollutants in the Lake Kariba ecosystem—a tropical man-made lake.In:Remane K,editor.African inland fisheries,aquaculture and environment.Oxford:Blackwell;1997.p.115–35.FAO/CIFA (Food and Agriculture Organization/Canadian Food Inspection Agency).Technical Paper of Canadian Food Inspection Agency on re-view of pollution in the Africa aquatic environment.Calamari;1994.Fo ¨rstner U,Wittman GTW.Metal pollution in the aquatic environment.Berlin:Springer-Verlag;1983.Hamza MM.Determination of heavy metal pollution in Lake Victoria using energy dispersive X-ray fluorescence analysis.MSc dissertation,Uni-versity of Dar es Salaam,Tanzania;1996.Hecky RE,Bootsma HA,Mugidde RM,Bugenyi FWB.Phosphorus pumps,nitrogen sinks,and silicon drains:plumbing nutrients in the African Great Lakes.In:Johnson IC,Odada EO,editors.The limnol-ogy,climatology and paleontology of the east African lakes.Amster-dam:Gordon &Breach;1996.p.205–34.Kahatano JM,Mutakyahwa MKD,Mnali S,Kinabo C,Kaaya CZ,Ikingura JR.Report on the environmental aspects of mining and industrialization in ke Victoria goldfields geochemical.University of Dar Es Salaam,Department of Geology;1995.Kondoro JWA,Mikidadi MH.Heavy metal pollution in Lake Victoria.Tanzan J Sci 1998;24:9–21.LVEMP (Lake Victoria Environmental Management Project).Importance of Lake Victoria.In:Mwambungu B,editor.Nyanza Review 1,vol.2.Tanzania:Dar es Salaam;1999.Machiwa JF.Heavy metal content in coastal sediments of Dar es Salaam,Tanzania.Environ Int 1992;18:409–15.Mohammed NK.The optimization of energy dispersive X-ray fluorescent (EDXRF)spectrometer for the study of heavy metal pollution.MSc thesis,University of Dar es Salaam,Tanzania;2000.Table 2Comparison of mean concentrations (A g/g À1,dry weight)of heavy metals in sediments from Mwanza Gulf,Lake Victoria and other literature values Study areaCd Cr Cu Hg Pb Zn ReferenceKali Nadi River (India)0.37.30.2nd 2.490.4Ajmal et al.,1988L.Kariba (Zimbabwe);(n =33;mean F SD)0.06F 0.0129.3F 1.616.1F 0.8nd 9.4F 0.642.4F 2.6Berg and Kautsky,1997L.Victoria (Uganda)nd 6741nd nd 86.0Mothersill,1976L.Victoria (Kenya)0.5nd39.8nd37.7133.8Onyari,1985L.Victoria (Tanzania);(n =93;mean F SD) 2.5F 0.511.0F 1.421.6F 2.40.1F 0.029.6F 1.636.4F 1.8Present studynd =Not determined.M.A.Kishe,J.F .Machiwa /Environment International 28(2003)619–625624Mothersill JS.The mineralogy and geochemistry of the sediments of North-western Lake Victoria.Sedimentology1976;23:553–65. Mpendazoe MTF,Kibogoya M,Rutagemwa KD,Kayombo S,Rugasira M, Marwa P.Report on the evaluation of point source discharge treatment options in the Lake Victoria area in Tanzania.World Bank,Dar es Salaam,Tanzania;1993.Muli JR.Environmental problems of Lake Victoria(East Africa):what the international community can do?Land Resour Manage1996;2:47–53. Mwamburi J,Oloc FN.The distribution and concentration levels of trace metals in water and sediments of Lake Victoria,Kenya.Afr J Trop Hydrobiol Fish1997;7:37–48.NEMC(National Environmental Management Council).Report of National Environmental Management Council and working group on monitoring of mercury and other heavy metals pollution in gold mining areas around Lake Victoria,Tanzania;1994.Onyari JM.The concentration of Mn,Fe,Cu,Zn,Cd and Pb in sediments and fish from the Winam Gulf of Lake Victoria bought in Mombasa town markets.MSc thesis,University of Nairobi,Kenya;1985.Onyari JM,Wandiga SO.Distribution of Cr,Pb,Cd,Zn,Fe and Mn in Lake Victoria sediments.Bull Environ Toxicol1989;42:807–12. Scholz CA,Rosendahl BR,Versfelt JW,Rach N.Results of high resolution eco-sounding of Lake Victoria.J Afr Earth Sci1990;11:25–32. Talbot V,Chegwidden A.Heavy metals in the sediment of Cockbun Sound, Western Australia and its surrounding area.Environ Pollut1983;5: 187–92.Van Densen WLT,Witte F.Introduction.In:Witte F,Van Densen F,editors.Fish stocks and fisheries of Lake Victoria.A handbook for field obser-vations.Canada:Samara Publishing;1995.p.1–10.Wakeham SG.Algal and bacterial hydrocarbons in particulate matter and interfacial sediments of Cariaco Trench.Geochim Cosmochim Acta 1990;54:1325–36.Zar JH.Biostatistical analysis.2nd ed.Englewood Cliffs(NJ):Prentice-Hall;1984.M.A.Kishe,J.F.Machiwa/Environment International28(2003)619–625625。