财务报表分析(英文版)标准答案
- 格式:doc
- 大小:630.00 KB
- 文档页数:39


一.经营活动产生的现金流量cash flows from operating activities 销售商品,提供劳务收到的现金现金流量表cash flows statement项目items金额amountcash received from sales of goods or rendering of services收到的税费返还refund of taxes收到的其他与经营活动有关的现金other cash received relating to operating activities现金流入小计sub-total of cash inflows购买商品接受劳务支付的现金cash paid for goods and services支付给职工以及为职工支付的现金cash paid to and on behalf of employees支付的各项税费taxes paid支付的其他与经营活动有关的现金other cash paid relating to operating activities现金流出小计sub-total of cash outflows经营活动产生的现金流量净额net cash flows from operating activities二.投资活动产生的现金流量cash flows from investing activities收回投资所收到的现金cash received from return of investments取得投资收益所得到的现金cash received from income of investments处置固定资产,无形资产和其他长期资产而收到的现金净额net cash received from disposal of fixed assets,intangible assets and other long-term assets 收到的其他与投资活动有关的现金other cash received relating to investing activities现金流入小计sub-total of cash inflows购建固定资产,无形资产和其他长期资产所支付的现金cash paid to acquire fixed assets,intangible assets and other long-term assets 投资所支付的现金cash paid to acquire investments支付的其他与投资活动有关的现金other cash paid relating to investing activities现金流出小计sub-total of cash outflows投资活动产生的现金净额net cash flows from investing activities三.筹资活动产生的现金流量cash flows from finacing activities吸收投资所收到的现金proceeds from invested assets借款所收到的现金proceeds from borrowings收到的其他与筹资活动有关的现金other proceeds relating to financing activities现金流入小计sub-total of cash inflows偿还债务所支付的现金cash repayments of amounts borrowed分配股利,利润或偿付利息所支付的现金cash payments for distribution of dividends,profit or interest expenses支付的其他与筹资活动有关的现金other cash payments relating to finacing activities现金流出小计sub-total of cash outflows筹资活动产生的现金流量净额net cash flows from finacing activities四.汇率变动对现金的影响effect of foreign exchange rate changes on cash五.现金及现金等价物净增加额net increase in cash and cash equivalents补充资料supplemental information1.将净利润调节为经营活动的现金流量reconciliation of net profit to cash flows from operating activities净利润net profit加:计提的资产减值准备add:assets shrink provision固定资产折旧depreciation of fixed assets无形资产摊销amortization of intangible assets长期待摊费用摊销amortization of long term deferred expenses待摊费用的减少(减:增加)decrease in prepaid and deferred expenses(less:increase)预提费用的增加(减:减少)increase in accrued expenses(less:decrease)处置固定资产,无形资产和其他长期资产的损失(减:收益)losses on disposal of fixed assets,intanglble assets and other long-term assets(less:gains)固定资产报废损失losses on scrapping of fixed assets财务费用financial expenses投资损失(减:收益)income on investment(less:losses)递延税款贷项(减:借项)deferred tax credit(less:debit)存货的减少(减:增加)decrease in inventories(less:increase)经营性应收项目的减少(减:增加)decrease in operating receivables (less:increase)经营性应付项目的增加(减:减少)increase in operating payables(less:decrease)其他others经营活动产生的现金流量净额net cash flows from operating activities2.不涉及现金收支的投资和筹资活动investing and financing activities that do not involve in cash receipts and payments:债务转为资本liabilities to be transfer captial一年内到期的可转换公司债券matured convertible bonds within a year融资租入固定资产fixed assets under finacing leasing3.现金及现金等价物净增加情况net increase in cash and cash equivalents现金的期末余额cash at the end of the period减:现金的期初余额less:cash at the beginning of the period加:现金等价物的期末余额plus:cash equivalents at the beginning of the period 减:现金的期初余额less:cash equivalents at the beginning of the period 现金及现金等价物净增加额net increase in cash and cash equivalents。
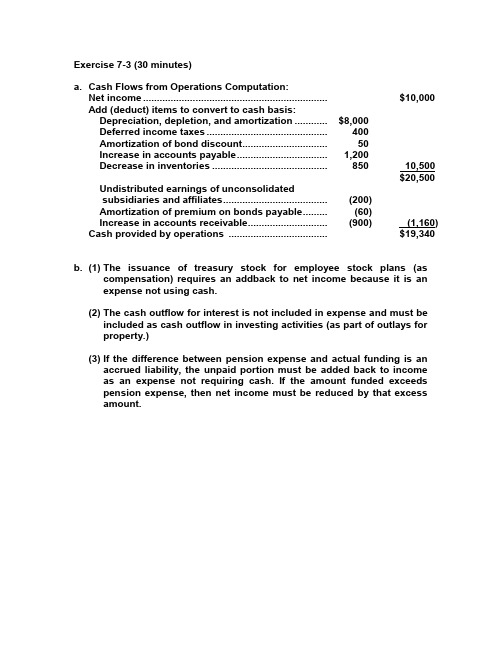
a. Cash Flows from Operations Computation:Net income ................................................................... $10,000 Add (deduct) items to convert to cash basis:Depreciation, depletion, and amortization ............ $8,000Deferred income taxes (400)Amortization of bond discount (50)Increase in accounts payable ................................. 1,200Decrease in inventories .......................................... 850 10,500$20,500 Undistributed earnings of unconsolidatedsubsidiaries and affiliates (200)Amortization of premium on bonds payable (60)Increase in accounts receivable ............................. (900) (1,160) Cash provided by operations .................................... $19,340 b. (1) The issuance of treasury stock for employee stock plans (ascompensation) requires an addback to net income because it is anexpense not using cash.(2) The cash outflow for interest is not included in expense and must beincluded as cash outflow in investing activities (as part of outlays forproperty.)(3) If the difference between pension expense and actual funding is anaccrued liability, the unpaid portion must be added back to incomeas an expense not requiring cash. If the amount funded exceedspension expense, then net income must be reduced by that excessamount.a. Beginning balance of accounts receivable ........ $ 305,000Net sales ............................................. 1,937,000Total potential receipts $2,242,000Ending balance of accounts receivable ............. - 295,000Cash collected from sales $1,947,000b. Ending balance of inventory ................................ $ 549,000Cost of sales ......................................................... +1,150,000Total ............................................. $1,699,000Beginning balance of inventory .......................... - 431,000Purchases ............................................................. $1,268,000 Beginning balance of accounts payable $ 563,000Purchases (from above) ....................................... 1,268,000Total potential payments ..................................... $1,831,000Ending balance of accounts payable .................. - 604,000Cash payments for accounts payable ................ $1,227,000c. Issuance of common stock.................................. $ 81,000Issuance of treasury stock .................................. 17,000Total nonoperating cash receipts ....................... $ 98,000d. Increase in land .................................................... $ 150,000Increase in plant and equipment ......................... 18,000Total payments for noncurrent assets ............... $ 168,000 Exercise 7-5 (20 minutes)b. X Fc. X Fd. X Ie. X Ff. NCNg. X Ih. NCSi. X Fj. X X Ob. X Fc. NCNd. X Ie. NCSf. NCNg. X Ih. NCSi. NE j. NE Exercise 7-7 (30 minutes)Net Cash from Cash2. NE NE +3. + + +4a. - NE NE4b. NE(1)+(2)+(2)4c. - +(2)+(2)5. NE + +6. - + (long-run -) + (long-run -)7. - -(5)+8. + NE NE9. +(3)+(4)+(4)10. NE + +11. + + +12. NE NE +13. NE NE +(1) Deferred tax accounting.(2) Depends on whether tax savings are realized in cash.(3) If profitable.(4) If accounts receivable collected.(5) Depends on whether interest is paid or accrued.Further explanations (listed by proposal number):1. Substituting payment in stock for payment in cash for its dividends will not affectincome or CFO but will increase cash position.2. In the short run, postponement of capital expenditures will save cash but have noeffect on income or CFO. In the long term, both income and CFO may suffer due to lower operating efficiency.Exercise 7-7—continued3. Cash not spent on repair and maintenance will increase all three measures. However,the skimping on necessary discretionary costs will adversely impact future operating efficiency and, hence, profitability.4. Managers advocating an increase in depreciation may have spoken in the mistakenbelief that depreciation is a source of cash and that consequently increasing it would result in a higher cash inflow. In fact, the level of depreciation expense has no effect on cash flow—the same amount of depreciation deducted in arriving at net income is added back in arriving at CFO. On the other hand, increasing depreciation for tax purposes will in all cases result in at least a short-term savings.5. Quicker collections will not affect income but will increase CFO because of loweraccounts receivable. Cash will also increase by the speedier conversion of receivables into cash. In the longer run this stiffening in the terms of sale to customers may result in sales lost to competition.6. Payments stretched-out will lower income because of lost discounts but doespositively affect CFO by increasing the level of accounts payable. Cash conservation will result in a higher cash position. Relations with suppliers may be affected adversely. Note: Long-term cash outflow will be higher because of the lost discount. 7. Borrowing will result in interest costs that will decrease income and CFO. Cashposition will increase.8. This change in depreciation method will increase income in the early stages of anasset's life. The opposite may hold true in the later stages of the asset's life.9. In the short term, higher sales to dealers will result in higher profits (assuming we sellabove costs) and, if they pay promptly, both CFO and cash will increase. However, unless the dealers are able to sell to consumers, such sales will be made at the expense of future sales.10. This will lead to less income from pension assets in the future which could causefuture pension expense to increase.11. The cost of funding inventory will be reduced in the future. In the current period netincome may also be increased by a LIFO liquidation from reduced inventory levels. 12. The current period decline in the value of the trading securities has been reflected incurrent period income, as has the previous gain. Although the sale will increase cash, it will have no effect on current period income. If the current period decline is deemed to be temporary, the company is selling a potentially profitable security for a short-term cash gain.13. Reissuance of treasury shares will increase cash, but will have no effect on currentperiod income as any “gain” or “loss” is reflected in additional paid in capital, not income. If the stock price is considered to be temporarily depressed, the company is foregoing a future sale at a greater market price and is, thus, suffering current dilution of shareholder value.Exercise 7-9 (60 minutes)Notes:[a] Balance at 7/29/Year 10 ........................................... $624.5 [33]Less: increase in Year 10 ........................................ (60.4) [61]$564.1[b]This amount is overstated by the provision for doubtful accounts expense that is included in another expense category.Note [a]: Item [89] represents dividends declared, not dividends paid (see also Item [77]).d. The entry for the income tax provision for Year 11 is:Income tax expense [27] ...................................... 265.9Deferred income tax (current) plug .................. 12.1Income tax payable ............................................ 230.4Deferred income tax (noncurrent) [a] .............. 23.4Notes:(1) The entry increases current liabilities by $12.1 since deferred income tax (current)is credited by this amount. It also increases current liabilities by $230.4 [124A], the amount of income taxes payable.(2) The [a] is the difference in the balance of the noncurrent deferred income tax item[176] = $258.5 - $235.1 = $23.4.(3) Also, $23.4 + $12.1 = $35.5, which is total deferred tax [59] or [127A]Exercise 7-9—continuede. Depreciation expense has no effect on cash from operations. The credit,when recording the depreciation expense, goes to accumulated depreciation, a noncash account.f. These provisions are added back because they affect only noncashaccounts, the charge to earnings must be removed in converting it to the cash basis.g. The “Effect of exchange rate changes on cash” represents translationadjustments (differences) arising from the translation of cash from foreign currencies to the U.S. dollar.h. Any gain or loss is reported under "other, net"—Item [60].i. Free cash flows =Cash flow from operations –Cash used for capital additions –Dividends paidYear 11: $805.2 – $361.1 – $137.5 = $306.6Year 10: $448.4 – $387.6 – $124.3 = $(63.5)Year 9: $357.3 – $284.1 – $86.7 = $(13.5)j. Start-up companies usually have greater capital addition requirements and lower cash inflows from operations. Also, start-ups rarely pay cash dividends. Free cash flow earned by start-up companies is usually used to fund the growth of the company, especially if successful.k. During the launch of a new product line, the statement of cash flows can be affected in several ways. First, cash flow from operations is lower because substantial advertising and promotion is required and sales growth has not yet been maximized. Second, substantial capital additions are usually necessary to provide the infrastructure for the new product line. Third, cash flow from financing can be affected if financing is obtained to launch this new product line.。

会计英语报表试题及答案1. 单项选择题A. 资产负债表的英文表达是什么?a) Balance Sheetb) Income Statementc) Cash Flow Statementd) Statement of Changes in Equity答案:a) Balance Sheet2. 填空题B. 在会计英语中,“流动资产”通常被翻译为________。
答案:Current Assets3. 判断题C. 利润表通常用来展示一个企业在一定时期内的财务状况。
(对/错)答案:错4. 简答题D. 请简述资产负债表和利润表的主要区别。
答案:资产负债表展示了企业在某一特定时间点的财务状况,包括资产、负债和所有者权益。
而利润表则展示了企业在一定时期内的经营成果,包括收入、成本和利润。
5. 翻译题E. 将以下会计术语翻译成英文:1) 存货2) 长期债务3) 营业收入答案:1) Inventory2) Long-term Debt3) Operating Revenue6. 计算题F. 假设某公司年初资产总额为$100,000,年末资产总额为$120,000,年初负债总额为$50,000,年末负债总额为$60,000。
请计算该公司年末所有者权益总额。
答案:年末所有者权益总额 = 年末资产总额 - 年末负债总额 = $120,000 - $60,000 = $60,0007. 案例分析题G. 阅读以下财务报表摘要,并回答以下问题:- 公司名称:XYZ公司- 销售收入:$500,000- 销售成本:$300,000- 营业费用:$50,000- 净利润:$100,000- 请计算XYZ公司的毛利润和营业利润。
答案:- 毛利润 = 销售收入 - 销售成本 = $500,000 - $300,000 = $200,000- 营业利润 = 毛利润 - 营业费用 = $200,000 - $50,000 = $150,0008. 论述题H. 讨论现金流量表在企业财务管理中的重要性。

财务报表分析相关知识概述(英文版Exercise 7-3 (30 minutes)a. Cash Flows from Operations Computation:Net income ................................................................... $10,000 Add (deduct) items to convert to cash basis:Depreciation, depletion, and amortization ............ $8,000Deferred income taxes (400)Amortization of bond discount (50)Increase in accounts payable ................................. 1,200Decrease in inventories .......................................... 850 10,500$20,500 Undistributed earnings of unconsolidatedsubsidiaries and affiliates (200)Amortization of premium on bonds payable (60)Increase in accounts receivable ............................. (900) (1,160) Cash provided by operations ................................... $19,340 b. (1) The issuance of treasury stock for employee stock plans (ascompensation) requires an addback to net income because it is anexpense not using cash.(2) The cash outflow for interest is not included in expense and must beincluded as cash outflow in investing activities (as part of outlays forproperty.)(3) If the difference between pension expense and actual funding is anaccrued liability, the unpaid portion must be added back to income asan expense not requiring cash. If the amount funded exceeds pensionexpense, then net income must be reduced by that excess amount.a. Beginning balance of accounts receivable ........ $ 305,000Net sales ............................................ 1,937,000Total potential receipts $2,242,000Ending balance of accounts receivable ............. - 295,000Cash collected from sales $1,947,000b. Ending balance of inventory ................................ $ 549,000Cost of sales ......................................................... +1,150,000Total ............................................. $1,699,000Beginning balance of inventory .......................... - 431,000Purchases ............................................................. $1,268,000 Beginning balance of accounts payable $ 563,000Purchases (from above) ....................................... 1,268,000Total potential payments ..................................... $1,831,000Ending balance of accounts payable .................. - 604,000Cash payments for accounts payable ................ $1,227,000c. Issuance of common stock.................................. $ 81,000Issuance of treasury stock .................................. 17,000Total nonoperating cash receipts ....................... $ 98,000d. Increase in land .................................................... $ 150,000Increase in plant and equipment ......................... 18,000Total payments for noncurrent assets ............... $ 168,000 Exercise 7-5 (20 minutes)b. X Fc. X Fd. X Ie. X Ff. NCNg. X Ih. NCSi. X Fj. X X Ob. X Fc. NCNd. X Ie. NCSf. NCNg. X Ih. NCSi. NE j. NE Exercise 7-7 (30 minutes)Net Cash from Cash2. NE NE +3. + + +4a. - NE NE4b. NE(1)+(2)+(2)4c. - +(2)+(2)5. NE + +6. - + (long-run -) + (long-run -)7. - -(5)+8. + NE NE9. +(3)+(4)+(4)10. NE ++11. + ++12. NE NE +13. NE NE +(1) Deferred tax accounting.(2) Depends on whether tax savings are realized in cash.(3) If profitable.(4) If accounts receivable collected.[a] B alance at 7/29/Year 10 ........................................... $624.5 [33]Less: increase in Year 10 ........................................ (60.4) [61]$564.1[b]This amount is overstated by the provision for doubtful accounts expense that is included in another expense category.Note [a]: Item [89] represents dividends declared, not dividends paid (see also Item [77]).d. The entry for the income tax provision for Year 11 is:Income tax expense [27] ...................................... 265.9Deferred income tax (current) plug ................ 12.1Income tax payable ............................................ 230.4Deferred income tax (noncurrent) [a] .............. 23.4Notes:(1) The entry increases current liabilities by $12.1 since deferred income tax (current) iscredited by this amount. It also increases current liabilities by $230.4 [124A], the amount of income taxes payable.(2) The [a] is the difference in the balance of the noncurrent deferred income tax item[176] = $258.5 - $235.1 = $23.4.(3) Also, $23.4 + $12.1 = $35.5, which is total deferred tax [59] or [127A]Exercise 7-9—continuede. Depreciation expense has no effect on cash from operations. The credit,when recording the depreciation expense, goes to accumulated depreciation, a noncash account.f. These provisions are added back because they affect only noncashaccounts, the charge to earnings must be removed in converting it to the cash basis.g. The “Effect of exchange rate changes on cash” represents translationadjustments (differences) arising from the translation of cash from foreign currencies to the U.S. dollar.h. Any gain or loss is reported under "other, net"—Item [60].i. Free cash flows =Cash flow from operations –Cash used for capital additions –Dividends paidYear 11: $805.2 – $361.1 – $137.5 = $306.6Year 10: $448.4 – $387.6 – $124.3 = $(63.5)Year 9: $357.3 – $284.1 –$86.7 = $(13.5)j. Start-up companies usually have greater capital addition requirements and lower cash inflows from operations. Also, start-ups rarely pay cash dividends. Free cash flow earned by start-up companies is usually used to fund the growth of the company, especially if successful.k. During the launch of a new product line, the statement of cash flows can be affected in several ways. First, cash flow from operations is lower because substantial advertising and promotion is required and sales growth has not yet been maximized. Second, substantial capital additions are usually necessary to provide the infrastructure for the new product line. Third, cash flow from financing can be affected if financing is obtained to launch this new product line.。
Financial Statement AnalysisTo develop techniques for evaluating firms using financial statement analysis for equity and credit analysis.Integrates financial statement analysis with corporate finance, accounting and fundamental analysis.Adopts activist point of view to investing: the market may be inefficient and the statements may not tell all the truth.What Will You Learn From the Course• How statements are generated• The role of financial statements in determining firms’ values• How to pull ap art the financial statements to get at the relevant information• How ratio analysis aids in valuation• The relevance of cash flow and accrual accounting information • How to calculate what the P/E ratio should be ?• How to calculate what the price-to-book ratio ?Need for financial statement analysisGAAP – ComplexEconomic events about the firm to be reported to the public Relevance vs ReliabilityReporting: Recognition vs Disclosure (where)Users of Firms’ Financial InformationEquity InvestorsInvestment analysisLong term earnings powerManagement performance evaluationAbility to pay dividendRisk – especially marketDebt InvestorsShort term liquidityProbability of defaultLong term asset protectionCovenant violationsUsers of Firms’ Financ ial InformationManagement: Strategic planning; Investment in operations;Performance EvaluationLitigants - Disputes over value in the firmCustomers - Security of supplyGovernments: Policy making and Regulation– Taxation– Government contractingEmployees: Security and remunerationInvestors and management are the primary users of financial statementsFundamental AnalysisStep 1 - Knowing the Business•The Products; The Knowledge Base•The Competition’ The Regulatory ConstraintsStep 2 - Analyzing Information•In Financial Statements•Outside of Financial StatementsStep 3 - Forecasting Payoffs•Measuring Value Added•Forecasting Value AddedStep 4 - Convert Forecasts to a ValuationStep 5 - Trading on the Valuation•Outside Investor: Compare Value wi th Price to; BUY, SELL, or HOLD•Inside Investor: Compare Value with Cost to; ACCEPT orREJECT StrategyA valuation model guides the process: Forecasting is at the heartof the process and a valuation model specifies what is to be forecasted (Step 3) and how a forecast is converted to a valuation (Step 4). What is to be forecasted (Step 3) dictates the information is implied?Balance Sheet•Assets (SFAC6): “probable future economic benefits obtained or controlled by a particular entity as a resultof past transaction or events-- no reference to risk (eg, assets sold but in which entityretains a risk)•Liabilities (SFAC6): ‘probable future sacrifice of economic benefits arising from present obligations of a particularentity to transfer assets or provide services to other entities in the future as a result of past transactions or events”-- not always followed (eg, certain leases and, until recently, pension benefits)•Equity (SFAC6): the residual interest in the net assets of an entity that remains after deducting its liabilities”-- does not handle situations where a source of capitalhas elements of debt & equity (eg, convertibles)•Classified by liquidityCA : converted to cash or used within 1-year oroperating cycle (if longer)CL: obligations expected to be settled within 1-year oroperating cycle•Tangible A&L reported above intangibles (goodwill, contingent liabilities)Measurement of Assets & Liabilities•Historical Cost, for most components of Balance Sheet •May be at market under “lower of cost or market rule”•Reversals of prior write downs allowed for marketable equity securities but not for inventories•Financial service firms (banks, brokerage, insurance) report certain A&L at market•A&L of foreign affiliates reported at end-of-period X-rate or a combination of it and specified historicalX-rates•Intangible assets have uncertain and hard to measure benefits and are reported only when acquired via a“purchase method” acquisition-- brand names-- when reported, called Goodwill, Patents, etc.Two Fundamental shortcomings of the Balance Sheet Elusiveness of valueValue cannot be assigned to all assetsOther Balance Sheet issues: Book Value vs. Market ValueInflation: The correct way to think about inflation is that inflation represents a decline in the value of one good – the currency of denomination (i.e., the U.S. dollar in our case). When the value of the currency declines, prices of all other goods & services rise because those prices are measured in terms of dollarsWeakness of Historical Cost Accounting: it ignores the impact of changes in the purchasing power of the currency. The net impact of not considering inflation is that book value understates the market value.Obsolescence causes book value to overstate market valueHow to Measure Effect of Obsolescencea. Observe difference between market value & book value (after adjustingfor inflation)b. Estimate the value of the asset’s earning power. But this is simply thediscounted cash flow approach & thus it represents circular reasoning.Inflation & ObsolescenceInflation causes book value to understate market valueObsolescence causes book value to overstate market valueThe effect of inflation & obsolescence may not be apparent in an examination of book values because they offset one anotherOrganizational Capitala. The whole is worth more than the sum of the partsb. Returns to Entrepreneurshipc. Difficult to separate from the firm as a going concernd. Can be estimated only by examining the earning power of the companySources of Organizational Capital Valuesa. Long-term relationshipsb. Reputational “brand name” capitalc. Growth optionsd. Network of suppliers and distributorsMore on Organizational Capitala. It is difficult to separate the firm’s organizational capital from the firm as anongoing concernb. The value of a brand name is not reflected in the replacement cost of assetsc. Can only be estimated by examining the earning power of the company (DCF)Adjustments to Book ValueEstimate Replacement CostEstimate Liquidation ValueDrawbacksDo adjusted book values reflect market values?Adjusted book values do not consider organizational capital Drawbacks of AdjustmentsIt is often difficult to determine if we have made the correct adjustments Adjustments often fail to consider the value of off-balance sheet itemsReplacement CostNo universal agreementCan use price indexCPI, PPI, GDP implicit deflatorIgnores organizational capitalLiquidation ValueSecondary markets do not existAsset specificityContestable marketsIncome statementNet SalesCost of Goods SoldGross ProfitSelling & Administrative expensesAdvertisingLease paymentsDepreciation and amortizationRepairs and maintenanceOperating ProfitOther income (expense)Interest incomeInterest expenseEarnings before Income taxesIncome taxesNet earningsStatement of Consolidated Retained Earnings Retained earnings at beginning of yearNet earningsCash DividendsRetained earnings at end of yearIncome Statement•Based on Accrual accounting•Based on Matching Principle•Revenues(SFAC6) “inflows of an entity from delivering or producing goods, rendering services, or carrying out otheractivities that constitute the entities ongoing major or centraloperations”•Expenses(SFAC6) “outfl ows from delivering or producing goods, rendering services, or carrying out other activities thatconstitute the entities ongoing major or central operations”•COMPREHENSIVE INCOME CONCEPT“the change in equity from transactions from non-owner sources. It includes all changes in equity during a period except those resulting frominvestments by owners and distributions to owners”•Gains“Increases in equity from peripheral or incidental transactions of an entity except those that result from revenuesor invest ment by owners.”•Losses“Decreases in equity from peripheral or incidental transactions of an entity except those that result from revenuesor investment by owners.”Revenues+ Other income and revenues- E xpenses= Income from CONTINUING OPERATIONS∀Unusual or infrequent events= Pre tax earnings from continuing operations- I ncome tax expense= After tax earnings from continuing operations*∀Discontinued operations (net of tax)*∀Extraordinary operations (net of tax)*∀Cumulative effect of accounting changes (net of tax) * = Net Income ** Per share amounts are reported for each of these itemsHigh quality income statement reflect repeatable income statementGain from non-recurring items should be ignoredwhen examining earningsHigh quality earnings result from the use of conservative accounting principles that do not overstate revenues or understate costsLow Quality of Earnings Indicators1.Unstable Income Statement Elements unrelated to normalbusiness operations2 Earnings that reflect dubious adjustments to estimatedliability accounts3 Earnings that have been determined using liberal accountingpolicies (methods and estimates) because of the resultingoverstatement of net income. Such overstatement alsoresults in the overstatement of future earnings projections income based on ultraconservative accounting policiessince the resulting net income is misleading as a basis forpredicting future earningsWhat to do?Compare the company’s accounting polices to theprevalent accounting policies in the industry5.Unreliable and inaccurate accounting estimatesWhat to watch for?Prior estimates materially differ from actualexperience, such as where the company’s assumed interest rate onpension fund assets significantly differs from the actual interestrate earned as reflected by significant actuarial gains and losses.What to do?Restate net income as if realistic accounting estimateswere used.6. Earnings that have been artificially smoothed or managed.What to watch for?a. Revenue reflected earlier or later than the realistic time periodb. Shifting of expense among reporting periodsc. Smoothly rising earnings trendd. Sharp increase or decrease in sales in the last quarter of the yearsas reflected in the 4th quarter income statemente. Trading of investment securities among affiliated companiesf. Significant modification in estimated liability accounts in the lastquarterg. Writing down a good asset (inventory) and selling it next year toshow higher earningsh. The “big bath”, in whic h everything is written off in a really badyear so that it will be easier to show good profits in the followingyears. This sometimes occurs when new management takes overand wishes to blame old management for poor profits or whenearnings are already so low that their further reduction my nothave significant impactWhat to do?Look at the functional relationship of sales and netincome over time. An inconsistent relationship may be a manipulator indicator. Restate earnings by taking out profit increments orreductions due to income management ploys7.Deferral of costs that do not have future economic benefitWhat to watch fora. Inventory of unsalable items in view of current environment (8track tapes, typewriters, large automobiles during oil shortage)b. Sudden write-offs of inventoryc. Goodwill on the balance sheet but the company has none(operating at losses, significant decline in market share, badpublicity)d. Costs that are currently capitalized when in prior years, they wereexpensed (e.g. Tooling costs in inventory)What to doRestate net income as if the unrealistic deferral had not been made.8. Unjustified Changes in Accounting Principles and EstimatesWhat to watch fora. A firm has a past history of making frequent accounting changesb. Accounting changes that create earnings growthc. The company fires the auditor and hires another one because of adisagreement over a proposed accounting change.What to doa. Determine whether the accounting change is justified by seeing if itconfirms to requirements in FASB statements, Industry Audit Guides& IRS regulationsb. Ascertain whether the accounting change is preferable, given nature ofbusiness (e.g., decreasing the life of a computer because of newtechnological advances in the industry)c. Does change make sense? (Lowering bad debt expense as % ofaccounts receivable does NOT make sense when customer defaultsare rising)d. If accounting change results in increasing net income, restate earningsas they would have been if the old method had been retained.9.Premature or Belated Revenue RecognitionWhat to watch fora. Accruing unbilled salesb. Is there a sufficient provision for future losses in connection withthe recognition of revenue?c. Improper deferral of revenue to a later periodd. Reversal of previously recorded profitsWhat to do- Restate revenue as if proper revenue recognition were made10.Underaccrual or Overaccrual of ExpensesWhat to watch fora. Failure to incur necessary maintenance expendituresb. Inadequate warranty provisionWhat to do- Adjust net income for difference between expenseprovided & normal expense11.Improper Accounting PoliciesWhat to watch fora. Reduction of expense for overly anticipated recoveries of excesscosts due to modifications in government contractsb. Substantial provision for future costs in present year (e.g.warranties) because firm was remiss in making sufficientprovisions in prior yearsWhat to do-restate earning of years affected so can determineproper earnings trend12.Modification in Loan Agreements Due to FinanciallyWeak BorrowersWhat to watch for - lowering of interest on loanWhat to do - downwardly adjust net income for inclusion ofaccrued interest income on risky loans13.Change in corporate policy for the current year, whichimpacts earnings (e.g., writing insurance renewal contracts in the 4th quarter of the current year rather than the 1stquarter of the next year).14.Unjustified Cutback in Discretionary CostsWhat to watch fora. Declining tend in discretionary costs as a % of net sales or toassets to which they applyb. Vacillation in the ratio of discretionary costs to sales over theyears as this may indicate management of earningsWhat to doa. Determine trend in discretionary costs over time throughuse of index numbersb. Determine ratio of discretionary costs to sales over last 5years. An example is ratio of repairs & maintenance tosales and/or to fixed assets15.Book Income Substantially Exceeds Taxable IncomeWhat to watch for - A continual, significant rise in deferred income tax credit account due to liberal accounting policies16.Residual Income that is Substantially less than Net IncomeResidual Income may be determined by deducting the imputedcost of capital (weighted average cost of capital time total assets)from net income.What to do - Determine ratio over time of residual income to netincome17. A High Degree of Uncertainty Associated with IncomeStatement ComponentsWhat to watch fora. Firm engaged in long-term activities requiring many estimates inincome measurement processb. Significant future loss provisionsc. Estimates have been consistently materially different from actualexperienceWhat to doa. Compare over time firm’s estimated liability provisions withactual losses occurring. – e.g., warranty cost sb. Determine what percent of total assets are intangible, which bytheir nature require material estimates to be made18.Unreliably Reported EarningsWhat to watch fora. Poor system of internal control because it infers possibleerrors in reporting systemb. High turnover rate in auditorsc. Company has reputation for managing earnings and/or usingliberal accounting policiesd. Indications of lack of management integrity as evidenced bysuch things as bribesWhat to doa. Determine trend in audit fees over timeb. Examine for disclosure made by company related toadjustments due to prior years' accounting errorsc. Look at accounting, financial and brokerage researchpublications that note and give examples of companies withquestionable accounting policies.High Quality of Earnings Indicators: Income Backed up by Cash Income not involving the Inclusion of amortizationcosts related to questionable assets, such as deferredcharges Income that reflects Economic Reality4.Income Statements Components that are RecognizedClose to the Point of Cash Inflow and Cash OutflowPolicies that lower quality of earnings1. reduce expense for expected recovery of excess costs resultingfrom changes in government contract – only collected 65%2. unrealistic decline in percentage of sales allowance to sales3. provision for future costs (warranties) high becauseunderprovided in past4. “Big Bath”5. re-negotiate terms of loan with weak borrower6. transfer from 1 sub to another7. sell securities at a gain and buy them back at higher price- haveto recognize lossHow company smoothes earnings Check list1Does level discretionary cost conform to past2Is there a drop in trend of discretionary costs as percentage of sales3Does cost cutting program involve significant cut in discretionary costs4Does cost cutting program eliminate fat?5Do discretionary costs show fluctuations relative to sales 6Is there a sizable jump in discretionary costs?Summary checklist of key pointsA. No single “real” net income figure existsB. The analyst must adjust reported net income to anearnings figure that is relative to him/her.C. Earnings quality evaluation is important in investment,credit, audit & management decision making.D. Appraising the quality of earnings requires anexamination of accounting, financial, economic andpolitical factors.E. Earnings quality elements are both quantitative andqualitativeCash flow statement1. SCF (Statement of Cash Flows) adds in situations where Balance Sheetand Income Statement provide limited insight2. SCF helps identify the categories into which companies fit3. Financial flexibility is a useful weapon to gain a competitiveadvantage and is best measured by studying the SCFThe key analytical lessonsThe cash flow statement – not the income statement – provides the best information about a highly leveraged firm’s financial healthThere is no advantage in showing an accounting profit, the main consequence of which is incurring taxes, resulting, in turn, in reduced cash flowsCash Flow and Company Life CycleCash Flow and Start-up CompaniesLittle or no operating cash flowsLarge cash outflows for investing activitiesLarge need for external financing (mostly from issuing common stock, issue long term debt)Cash Flows and Emerging Growth CompaniesSome operating cash flow (not enough to sustain growth)Large cash outflows to expand activitiesRequires cash flows from financingPay back some short-term debt, issue some common stockCash Flows and Established Growth CompaniesFund growth from operating cash flowDepreciation is substantialRepayment of long term debt, begin to pay dividendCash Flows and Mature Industry Companies Modest capital requirementsDepreciation and amortization is significantNet negative reinvestmentLarge dividend payout, reduction in long term debt Cash Flows and Declining Industry Companies Net cash user (similar to emerging growth)Lower dividends, Slim operating cash flowssell assetsCash Flows and Financial FlexibilitySafety of dividendFinance growth with internal fundsMeet other financial obligationsFinancial Ratios Analysis:Ratios are more informative than raw numbers1. Ratios provide meaningful relationships between individual values inthe financial statements2. Ratios help investors evaluate management3. Enable comparison of a firm’s performance toThe aggregate economyIts industry or industriesIts major competitorsIts past performanceRatios and Financial AnalysisComparability among firms of different sizesProvides a profile of the firmCaution:Economic assumption of Linearity – ProportionalityNonlinearity can cause problems:Fixed costs, EOQ for inventoriesBenchmarks; Is high Current ratio good? For whom?Industry-wide norms.Accounting Methods; Timing & Window DressingLIMITATIONS1. No theory to define ‘good’2. Historical, not economic3. Most as of a single point in time4. Seasonal operations5. One-time effects6. Designed for manufacturersLiquidity Ratios: attempt to measure the ability to pay obligations such as current liabilities and the pool of assets available to cover the obligations. Liquidity is the ability of an asset to be converted to cash quickly at low cost. Converting an asset to cash occurs in one of two ways. Sell the asset, hoping it has reasonable liquidity, or in the case of a financial asset, like accounts receivable or Treasury bill, maturity brings cash. Working capital circulates from inventory to accounts receivable to cash, etc. Accounting value estimates of liquid assets are reasonable estimates of their value.Current assets (the pool of circulating cash assets available to be allocated to pay bills) minus current liabilities (the pool of obligations the business must pay in the near future) is an analytical amount called net working capital (NWC).NWC = current assets - current liabilitiesNWC/total asset ratio = net working capital / total assetsThe current ratio is the classic liquidity ratio, but is merely a variation of the idea above—what pool of circulating assets is available relative to the pool of current obligations:Current ratio = current assets / current liabilitiesQuick ratio =(cash + marketable securities + accounts receivable) /current liabilitiesCash ratio = (cash + marketable securities) / current liabilitiesCash flow from operation ratio = OCF / current liabilitiesLeverage ratios are two types: balance sheet ratios comparing leverage capital to total capital or total assets, and coverage ratios which measure the earnings or cash-flow times coverage of fixed cost obligations.Balance sheet ratiosLong-term debt ratio = long-term debt / ( long-term debt + equity)Debt-equity ratio = long-term debt/equityTotal debt ratio = total liabilities / total assetsA coverage ratio, such as the times interest earned ratio, measures an amount available relative to amount owed. How many times is the obligation covered?Times interest earned = EBIT / interest expense= (EAT+Tax+Interest Exp)/ interest expenseTimes Cash flow coverage =(OCF+Tax+Interest Exp)/ interest expenseTotal assets turnover = Sales / Total assetsAccounts Receivable turnover = Sales / AR[Days A/R outstanding = 365 / Accounts Receivable turnover]Inventory turnover = Sales / Average Inventory, orCOGS / Average Inventory[Inventory Conversion = 365 / Inventory turnover]Payable turnover (deferral) = Purchase (or COGS) / AP[Days A/P outstanding = 365 / Payable turnover]Note: Cash Cycle = Inventory Conversion + Days A/R outstanding –Days A/P outstandingProfitability Ratios: refers to some measure of profit relative to revenue or an amount invested.The net profit margin measures the proportion of sales revenue that is profit available for sources of funds (EBIT-tax).Gross profit margin = gross profit / salesOperating profit margin = EBIT / salesNet profit margin = net income / salesReturn on assets = (net income + interest )/ average total assetsReturn on equity = net income/ average equityPayout ratio = dividends / net earningsPlowback ratio = 1 - payout ratio= (earnings – dividends)/(net earnings) = (earnings retained in period)/( net earnings)Growth in equity = plowback ratio x ROEMarket Based Ratios•For pricing an IPO if business going public•P/E RatioWhat investors are willing to pay for a $ of earnings (Current/ Forecast)What creates a high P/E?•Market/BookUsually much different than 1.•Price/Cash FlowThe Du Pont System is a process of analyzing component ratios, (also called decomposition) of the ROA and ROE to explaintheir level or changesRatio Pr 1 Leverage Turnover Asset y ofitabilit Equity Debt ROA EquityTA TA Sales Sales NI EquityTA TA NI Equity NI ROE ⨯⨯=⎪⎪⎭⎫ ⎝⎛+⨯=⨯⨯=⨯==Industry analysis:Definition of an industry: the group of firms producing products that are close substitutes for each other.Forces driving industry competition: There are five forces in determining the competitive structure of an industry, they are: (1)Entry, (2)Threats of substitutions, (3)bargaining power of buyers, (4)Bargaining power of suppliers, and (5)rivalry among current competitors, and can be pictured as:Five forces model:Potential EntrantsThreats of new entrants(Suppliers) (Buyers )0 bargaining power Industry competitors bargaining powerRivalry among existing firmsThreats of substitutesSubstitutesThreats of entry: new entrants bring to an industry new capacity, the desire to gain market share, and often substantial resources. Price can bid down or incumbent’s costs inflated as a result, reducing profitability.Barriers to entry:A. Economics of scales deter entry by forcing the entrants to come in at alarge scale and risk strong reaction from existing firms or come in at a small scale and accept a cost disadvantage.B. Product differentiation: product differentiation means that establishedfirms have brand identification and customer loyalties. Differentiation creates a barrier to entry by forcing entrants to spend heavily toovercome existing customer loyalties.C. Capital requirement: the need to invest large financial resources inorder to compete creates a barrier to entry, particularly if the capital is required for risky or unrecoverable up-front advertising or R&D.Capital requirement maybe also needed for customer credit, inventory start-up cost, as well as production cost.D. Switching costs: A barrier to entry is created by the switching cost,that is, one-time cost facing the buyer of switching from one supplier’s product to another’s.E. Access to distribution channels: the more limited the wholesale orretail channels for a product are and the more existing competitors have these tied up, obviously the tougher entry into the industry.F. Cost disadvantages independent of scale: proprietary producttechnology, favorable access to raw materials, favorable locations,government subsidy, and learning or experience curve.G. Government policy:Expected retaliation: conditions that signal the strong likelihood of retaliation to entry and hence to deter it are the following:A. A history of vigorous retaliation to entrants.B. Established firms with substantial resources to fight back.C. Established firms with great commitments to the industryand highly illiquid assets employed in it.D. slow industry growth, which limits the ability of the industryto absorb a new firm without depressing the sales andfinancial performance of established firms.。
Exercise 7-3 (30 minutes) a. Cash Flows from Operations Computation: Net income ................................................................... $10,000 Add (deduct) items to convert to cash basis: Depreciation, depletion, and amortization ............ $8,000 Deferred income taxes ............................................ 400 Amortization of bond discount ............................... 50 Increase in accounts payable ................................. 1,200 Decrease in inventories .......................................... 850 10,500 $20,500 Undistributed earnings of unconsolidated subsidiaries and affiliates ...................................... (200) Amortization of premium on bonds payable ......... (60) Increase in accounts receivable ............................. (900) (1,160) Cash provided by operations .................................... $19,340
Chapter 1Page 81.Classify following items as either an expense (E),a revenue(R),an asset(A),or a liability( L);Cash, buildings, salaries of the sales force, $5 owed to a company for work performed, Mortgage to a bank, sales.Answer:Cash—A Buildings—A Salaries of the sales force—E$5 owed—L Mortgage to a bank—L Sales—R2. Classify each of the following as n operating (O), bank (I) , or financing (F) in a statement of cash flows; Wage paid to workers, Cash received form a bank in the form of a mortgage, cash dividends paid to a supplier of inventory, Cash paid to purchase a new machine.Answer:Wage paid—O Cash of mortgage-- F Cash dividends paid -- FCash paid to supplier of inventory—O Cash paid to purchase a machine—IPage111.List several economic decisions that rely on accountinginformation.Answer:·Whether to grant a loan·How much to pay for a share of common stock.·Whether to grant a rate increase to an electric utility·How much in damages the loser of a lawsuit must pay·How much of a bonus to pay a plant manager·Whether to enter a new market2. Why do financial statements have footnotes, and what kinds of information might you find in them?Answer:Financial statements have footnotes because financial disclosure is a complex business. The notes tell us some of the specifics about the company environment , what accounting methods the company has used, what the accounting numbers might be if alternative methods had been used, and some of the major contingencies that are not formally included in the statement proper.Page 201.Describe the process of setting accounting standards. What are the roles of all the parties you mention?Answer:The FASB, a private, not-for-profit organization ,sets GAAP in the U.S. It publicly declares an agenda, promulgates "ExposureDrafts" of proposed standards, holds open meetings, and invites input from interested parties. The FASB has been delegated this authority by the SEC, a government agency with legal authority to determine GAAP.2.Think of an example, like the executive compensation example in the chapter, where incentives might exist to bias accounting numbers one way or another.Answer:There are other examples, but here is one that is different. A taxpayer has incentives to bias reported income downward in order to minimize income tax payments. However, it is important to understand that tax accounting rules are different from GAAP, and this book is about GAAP. Chapter 14 covers GAAP for taxes in more detail.Other examples include:·An entrepreneur seeking a loan from a bank or funding from a venture capitalist might have incentives to bias accounting numbers to look favorable.·A firm that is subject to scrutiny for earning excess profits(e.g.,an oil company)might have incentives to bias accounting numbers to look less favorable.·A utility subject to rate regulation might have an incentive tobias accounting numbers to look less favorable in order to gain more generous increases in its rates. (At this writing, there is a rather severe controversy about whether electric utilities in California are genuinely in financial difficulty and should be allowed to continue to impose large rate increase.)Chapter 2Page 381 Define assets, liabilities, and equities.Gave an example of each.How are assets valued? How are liabilities valued? Answer:An asset is a probable future economic benefit obtained or controlled by an entity as a result of a past transaction. Cash marketable securities, accounts receivable, inventories, prepaid expenses, patents, copyrights, trademarks, and property, plant and equipment are all examples of assets. A liability isa probable future sacrifice of economic benefits arising frompresent obligations of an entity to transfer assets or provide services as a result of a past transaction or event. Accounts payable, accrued liabilities, unearned revenues, warranties, and bonds payable are all examples of liabilities.Accounting valuation of assets uses several different methods, includingmarket value, expected realizable value, lower of cost or market, present value of future cash flows, and historical cost. Accounting valuation of liabilities is the expected amount that will be paid, perhaps adjusted for the time value of money.2. Explain what is meant by the entity concept.Answer:The entity is the person or organization about which accounting's financial history is being written.3 .A company signs a ten-year employee contract with a vicepresident. The salary is $500000 per year, guaranteed. Is this contract an asset? W ould it appear on the balance sheet?Explain.Answer:The rights conveyed by the contrat may be an asset from an economic point of view, but they are not an asset under GAAP. The contract would not appear on the balance sheet as an asset, because GAAP does not record executory contracts, which are contracts that require future performance form both parties. That is ,GAAP views the contract as determining what services will be provided, no asset is recognized under GAAP.(Neither is a liability for payment recognized until services have beenperformed.)4 .A company purchased a parcel of land 10 years ago at a cost of $300000.The land has recently been appraised at $900000. At what value is the land carried in the balance sheet? How does the appraisal affect the carrying value in the balance sheet? Answer:The land is on the balance sheet at its historical cost of $300000.The carrying value of the land is unaffected by the appraisal.Page 421、Define debit and credit .What kind of balance ,debit or credit ,would you expect to find in the inventory T-account?In the Common Stock T-account?Answer:A debit is an entry on the left side of a T-account. A credit is an entry on the right side of a T-account. We would except to find a debit balance in Inventory, and credit balances in Bonds Payable and Common Stock. The reason is the convention that increases in assets are debits and increases in liabilities and equities are credits.2、If the trial balances, it means that you have analyzed all theeffects of transactions correctly. True or false?Explain. Answer:False. A balanced means that the trial balance is consistent, not necessarily correct. For example. If an arbitrary entry is made that debits Cash and credits Common Stock for an equal amount, the trial balance will balance but it will be wrong. An accounting can receipt of cash and the issuance of common stock, but it alone can not make cash or additional common shares.3﹑Suppose Web sell leases a portion of its space to another company. Web sell’s accounts are debited and credited to record this transaction?Answer:Web sell would debit Cash and a liability, Rent Received in Advance, for the prepayment.Chapter 3Page 571. Define revenue and expense. How does one decide to list an item as revenue in an income statement? What is matching? Answer:Revenues are increases in net assets resulting from operations over a period of time .Expense are decreases in net assets resulting from operations over a period of time .Revenue isrecognized the earnings process is substantially complete , a transaction2. Give an example not found in the text , of an expense that is paid for in cash in a prior accounting period .In a subsequent accounting period.Answer:There are many allowable responses . An example is a patent that is purchased and paid for in one year and used in next .3. Give an example, not found in the text , of a revenue that is received in cash in a prior accounting period . In a subsequent accounting period .Answer:An example is a house painting contractor that receives payment for one-third of the contract price before beginning the painting .4. Explain why it is right to think of an asset as a cost and an expense as an expired cost .Answer:An asset is a future benefit . And there is an opportunity cost associated with not selling it for cash or exchanging it to settleChapter 6Page 120:1.The following table lists the adjustments and has an X in thecolumn indicating the approach:2. We first take adjustment for prepaid insurance and insurance expense. It would be easy to think of this adjustment as focusing on how much of the insurance coverage remained, as opposed to how much was used. In fact, the same type of logic could be used---computing a monthly rate for the coverage and applying that to the months reminding, instead of the months used.Now take adjustment for depreciation expense and accumulated depreciation. Estimating the value of the equipment at year end might be easy, for example, if there is a market for used equipment, or very difficult, for example, if the equipment was specially designed for Websell. Once a value estimate for the equipment at year end is obtained, depreciation expense would be the change in value over the year.Page 1231.$5000×(1+0.06)^10=$5000×1.79085=$8954.242.$5000×(1+0.06/2)^(10×2)=$5000×(1+0.03)^20=$5000×1.80611=$9030.563. $1000×(1.05)^3+$1000×(1.05)^2+$1000×(1.05)^1=$3310.134. ($1000×0.05/5)^13+$1000×(1+0.05/5)^10+$1000×(1+0.05/5)^5=($1000×(1.01)^15)+($1000×(1.01)^10)+($1000×(1.01)^5) =$1160.97+$1104.62+$1051.01=$3316.6Page 1241.x×.(1.07)^3=$3000 x=$3000/(1.07)^3=$2448.892. Calculate the present value at 10% of $1300 received two years from now. If that is greater than $1000, you are better offwith the $1300 to be received in two years. If its present value is less that $1000, you better off with $1000 now. $1300/(1.10)^2=$1074.38Therefore, you are better off receiving $1300 two years from now.Another way to do this problem is to take the future value at 10% of $1000. At the end of two years, the $1000 would compound up to:$1000×(1.10)^2=$1210,Which is less than you would have at that point if you took the $1300.3.The most I would be willing to pay is the present value at 8% of the stream of $1000 payment:$1000/(1.08)^1+$1000/(1,08)^2+$1000/(1,08)^3=$925.926+857.339+793.832=$ 2577.1(rounded)Chapter 8Page 1681.Aging takes the balance in accounts receivable at the end of the year, and sorts it by how long ago the transaction occurred that gave rise to that receivable. Experience has shown that ―older‖ accounts have less likelihood of ever being collected.Percentages of likely uncollectibles for each category are applied to the totals in that category , and the results added to obtain an estimate of the allowance for uncollectibles required to value properly the estimated amount that will be collected from the accounts receivable. The bad debts expense then falls out as a ―plug‖ in the allowance for uncollectibles.The percentage-of-sales method just estimates bad debt expense as a percent of sales, and plug the balance in the allowance account.2. Cash (118)Accounts receivable (118)12/31/2003(to recognize collection of cash from companies owing service co. from 2002 sales)Allow ance for doubtful accounts (7)Accounts receivable (7)12/31/2003(to write off accounts we know will not be collected) Ac counts receivable (125)Sales reven ue (125)12/31/2003(to recognize revenue and to anticipate collection of the receivable)If we focus on recording the bad debts expense that is associated with billings for 2003, we would record.06×$125000=$7500 inbad debts expense.B ad debts expense………………………………………7.5 Allowan ce for doubtful accounts…………………………7.5 12/31/2003(to record bad debt expense in anticipation of not collecting 100% of receivables)Method one: focus on the percentage of sales expected not to be collected.Allowance for doubtful accounts(10.5 is the ―plug”,i.e., the number that drops out)Now we move to 2004, where events now proceed as expected . Collections are $117.5 thousand. Cash………………………………………………..117.5 Accounts receivable…………………………………117.512/31/2004(to recognize collection of cash form companies owing service co. from 2003 sales)Allowance for doubtful ac counts………………………7.5 Accounts receivable………………………………….7.512/31/2004(to write off accounts we know will not be collected)Accounts receivable (125)Sales revenue (125)12/31/2004(to recognize revenue and to anticipate collection of the receivable)If we focus on recording the bad debts expense that is associated with billings for 2004, we would record.06×$125000=$7500 in bad debts expense.Bad debts expense……………………………………7.5 Allowance for doubtful accounts…………………………7.5 12/31/2003(to record bad debt expense in anticipation of not collecting 100% of receivables)The allowance for doubtful accounts using the peentage-of-sales method looks like this:Method one: focus on the percentage of sales expected not to be collected.Allowance for doubtful accountsOnly the entries recording bad debt expense are different using the aging method. Instead of the above entries recording bad debt expense, we would have the following analysis: Each year, we would adjust the balance in the allowance for doubtful accounts so that the net receivable ends up at $117500. That is, we would solve $125000-X=$117500,and find that the ending balance in the allowance for doubtful accounts must be $7500.Analyzing the account, we would determine that at 12/31/2003 we must add $4500 to the allowance for doubtful accounts: Bad debts expense………………………………..4.5 Allowanc e for doubtful accounts…………………….4.512/31/2004(to record bad debt expense in anticipation of not collecting 100% of receivables)At 12/31/2004, we must add $7500 to the allowance for doubtful accounts:Bad debts expense………………………………..7.5 Allowan ce for doubtful accounts…………………….7.512/31/2004(to record bad debt expense in anticipation of not collecting 100% of receivables)Using aging, the allowance for doubtful accounts T-accountlooks like this:Method two: focus on the ending balance in the allowance for doubtful accounts.Allowance for doubtful accountsChapter 9Page 1831.LIFO is last-in first-out. It means that in computing ending inventoryand cost of goods sold, the cost of items sold is assigned in reverse chronological order of their purchase, beginning from the most regent items purchased in a period. FIFO is first-in, first-out .It means that in computing ending inventory and cost of goods sold, the cost of items sold is assigned in chronological order of their purchase, beginning from the goods on hand at the beginning of the period. Average cost means that in computing ending inventory and cost of goods sold, the average unit cost of the beginning inventory and items purchased in aperiod is used to determine the cost of goods sold and remaining inventory.2.Y es, it is still a positive net present value project. In fact, its netpresent value is higher than when the purchase was made at$1.05 per unit, since the cash outflow is reduced but the cash inflow remains the same. The cash outflow on 12/31/01 when purchases are at $0.95 per unit is $114.This means the net cash flow at 12/31/01 is ($4) instead of ($16),and the NPV for Widget Company is:NPV=-100-$4/1.1+$10/ (1.1^2) +$144/ (1.1^3) =$12.82First, we redo the case of FIFO. The inventory T-account is:Widget Co. Inventory Account under FIFO Flow AssumptionInventory (FIFO)Ending inventory values can be read from the above T-account. Netincomes are:Widget Incomes using FIFONow we redo the case of FIFO. First, the inventory T-account is: Widget Co. Inventory Account under FIFO Flow AssumptionInventory (FIFO)Ending inventory values can be read from the above T-account. Net incomes are:Page 186To calculate the market-to-book ratios and accounting returns on equity: Market-to-book Ratios under Average CostAccounting Rates of Return under Average CostCollecting the results for FIFO from the chapter and these results for average cost, we have:Market-to-book Ratios under V arious Cost Flow AssumptionAccounting Rates of Return under V arious Cost Flow AssumptionAs is apparent, the market-to-book ratios and accounting rates of return for average cost are between for LIFO and FIFO.2. Because it has more recent costs on the balance sheet in the inventory account, FIFO has market-to-book ratios closer to 1regardless of whether prices rise or fall.Chapter 10Page 1961. The total profit on the transaction is the sales price of $880.00 less the original cost of $734.03:Sales price of securities $880.00Less : original cost ($735.03)Profit on transaction $144.97The cash flows were: $735.03 out on January1, 2001, and $880.00 in on January 3, 2003.There were profit in 2001, 2002, and 2003.In 2001, there was a profit of $81.17.In 2003,there was a profit of $5.00.2. The unadjusted book value of the security on December 31,2002 was $793.83.If the market value of the security on that date was $790.00,an adjustment reducing its carrying value by $3.83 is required to write it down to its market value: Unrealized loss on market value securities-trading ……3.83 Marketable securities –trading ………… 3.83 If the security were sold for $810.00 on January 3, 2003, the entry would be:Cash ………………………………810.00Marketable securities –trading ………………790.00Gain on marketable securities-trading …………20.001/03/2003(To record the sale of the Marketable securities—trading )Page 1981. When a securities is classified as trading security, profits or losses show up on the income statement in every period from when the security is purchased until when it is sold. when a security is classified as available-for-sale ,profits or losses only show up on the income statement in the period in which the security is sold.2. the unadjusted book value of the security on December 31,2002 was $793.83.If the market value of the security on that date was $790.00,an adjustment reducing it’s carrying value by $3.83 is required to write it down to it’s market value. however unlike the trading security case ,the unrealized loss is an equity account ,not a temporary account:Unrealized loss on marketable securities-available-for-sale 3.38 Marketable securities –trading ………………3.83To record the sale of the security for $810.00 on January 3,2003: Cash ………810.00Unrealized gain on marketable securities-available-for-sale(58.80-3.83) ………54.97Marketable securities-trading …………790.00Realized gain on marketable securities-available-for-sale ……………74.9712/31/2002(To mark-to-market the Marketable securities—available-for-sale)Chapter 111.a. Under straight-line depreciation, the depreciation expense each year is$600-$100/5 years=$100 per year.b. Under double-declining balance depreciation, the depreciation expense each year is given in the following table:c. Under sum-of-year’-digits depreciation, the depreciation expense each year is given in the following table:Sum-of years’-digits depreciation2. Intangible assets are most often shown in one line that is cost net of amortization. Tangible assets are sometimes shown in three lines: cost , accumulated depreciation, and net .3. Economic depreciation is the change in the economic value of the asset. Economic depreciation can be appreciation when the asset increases in value. We seen this already withmarketable debt securities, which sometimes increase in value because of unpaid interest4.It is easy and fulfills the requirement of GAAP to provide depreciation using a systematic and rational method. No GAAP depreciation method likely correctly reflects economic depreciation anyway ,so a simple expedient may be good enough.1.Sraight-line depreciation is $100 per year ($300/3 years).Double-declining balance depreciation is given in the following table:2.For straight-line depreciation,the entry is the same each year: Depreciation expense (100)Accumulateddepreciation (100)For double-declining balance depreciation,the entries are: Year1Depr eciation expense (200)Accu mulated depreciation (200)Year2Depreciation expense………………………………66.67 Acc umulated depreciation………………………66.67 Year3.declining balance because depreciation expense under straight-line is only $100,while under double-declining balance depreciation expense is $200.4.If the company buys one asset every year and each asset lasts three years,then in year 4 it will have three assets.Under straight-line depreciation,each of those assets generates a depreciation expense of $100;therefore total depreciation expense would be 3*$100,or $300.Under double-declining balance depreciation,total depreciation expense depends on the age of each asset.The company would have one asset in its first year of life,one in itssecond year of life,and one in its third year.Therefore,total depreciation expense would be:$200+$66.67+$33.33=$300,the same as under straight-line.Both depreciation methods give the same total depreciation because:1.Both methods fully depreciate the assets over their lives.2.The cost of the assets has remained constant.3.The company is in a steady state in which the number ofnew assets purchased in a period equals the number ofold assets being retired in that period.。
Financial Statement AnalysisIntroductionFinancial statement analysis is a crucial tool for assessing the financial performance and stability of a company. By analyzing a company’s financial statements, investors and other stakeholders can gain insights into its profitability, liquidity, solvency, and overall financial health. This document provides an overview of financial statement analysis, including the different types of financial statements, key financial ratios used in analysis, and the importance of using a systematic approach for analyzing financial statements.Types of Financial StatementsFinancial statements are a collection of reports that provide a snapshot of a company’s financial position and performance over a specific period. The three main types of financial statements include:1. Balance SheetThe balance sheet is a statement that shows the financial position of a company at a given point in time. It provides information about a company’s assets, liabilities, and shareholders’ equity. The balance sheet is divided into two main se ctions: the left side shows the company’s assets, while the right side shows its liabilities and shareholders’ equity.2. Income StatementThe income statement, also known as the profit and loss statement, reports a company’s revenues, expenses, and net in come over a specific period. It provides insights into a company’s profitability and helps identify trends in its revenue and expenses. The income statement follows a simple equation: revenues minus expenses equal net income.3. Cash Flow StatementThe cash flow statement shows the inflows and outflows of cash in a company over a specified period. It provides information about a company’s operating, investing, and financing activities. The cash flow statement helps assess a company’s ability to generate cash and its liquidity.Key Financial RatiosFinancial ratios are used to analyze the relationships between different items in a company’s financial statements. They help evaluate a company’s financialperformance, efficiency, liquidity, and solvency. Some key financial ratios used in financial statement analysis include:1. Profitability RatiosProfitability ratios measure a company’s ability to generate profits. Common profitability ratios include gross profit margin, operating profit margin, and net profit margin.2. Liquidity RatiosLiquidity ratios assess a company’s ability to meet its short-term obligations. These ratios include the current ratio and quick ratio.3. Solvency RatiosSolvency ratios evaluate a company’s long-term financial stability and ability to meet its long-term obligations. Examples of solvency ratios include the debt-to-equity ratio and the interest coverage ratio.4. Efficiency RatiosEfficiency ratios measure a company’s ability to utilize its assets and resources effectively. Examples include the inventory turnover ratio and the accounts receivable turnover ratio.Systematic Approach for Financial Statement AnalysisTo conduct an effective financial statement analysis, it is important to follow a systematic approach. The key steps in this approach include:1. Gathering Financial StatementsCollect the company’s financial statements, including the balance sheet, income statement, and cash flow statement.2. Analyzing Financial RatiosCalculate the relevant financial ratios and analyze them to assess the company’s financial performance and condition.3. Comparing RatiosCompare the calculated financial ratios with industry averages or with the company’s historical performance to identify trends and benchmark the company’s performance.4. Conducting a Trend AnalysisAnalyze the company’s financial statements over multiple periods to identify any significant changes or trends in its financial performance.5. Making Informed DecisionsBased on the analysis of the financial statements and ratios, make informed decisions about the company’s financial health, investment potential, and future prospects.ConclusionFinancial statement analysis is an important tool for assessing a company’s financial performance and stability. By analyzing a comp any’s financial statements and calculating key financial ratios, investors and stakeholders can make informed decisions about the company’s financial health, stability, and investment potential. Following a systematic approach for financial statement analysis ensures a comprehensive evaluation and helps identify trends and benchmarks for comparison.。
Chapter 8Return On Invested Capital And Profitability AnalysisReturn on invested capital is important in our analysis of financial statements. Financial statement analysis involves our assessing both risk and return. The prior three chapters focused primarily on risk, whereas this chapter extends our analysis to return. Return on invested capital refers to a company's earnings relative to both the level and source of financing. It is a measure of a company's success in using financing to generate profits, and is an excellent measure of operating performance. This chapter describes return on invested capital and its relevance to financial statement analysis. We also explain variations in measurement of return on invested capital and their interpretation. We also disaggregate return on invested capital into important components for additional insights into company performance. The role of financial leverage and its importance for returns analysis is examined. This chapter demonstrates each of these analysis techniques using financial statement data.•Importance of Return on Invested CapitalMeasuring Managerial EffectivenessMeasuring ProfitabilityMeasuring for Planning and Control •Components of Return on Invested CapitalDefining Invested CapitalAdjustments to Invested Capital and IncomeComputing Return on Invested Capital•Analyzing Return on Net Operating AssetsDisaggregating Return on Net Operating AssetsRelation between Profit Margin and Asset TurnoverProfit Margin AnalysisAsset Turnover Analysis•Analyzing Return on Common EquityDisaggregating Return on Common EquityFinancial Leverage and Return on Common EquityAssessing Growth in Common Equity•Describe the usefulness of return measures in financial statement analysis. •Explain return on invested capital and variations in its computation.•Analyze return on net operating assets and its relevance in our analysis. •Describe disaggregation of return on net operating assets and the importance of its components.•Describe the relation between profit margin and turnover.•Analyze return on common shareholders' equity and its role in our analysis. •Describe disaggregation of return on common shareholders' equity and the relevance of its components.•Explain financial leverage and how to assess a company's success in trading on the equity across financing sources.1. The return that is achieved in any one period on the invested capital of a companyconsists of the returns (and losses) realized by its various segments and divisions. In turn, these returns are made up of the results achieved by individual product lines and projects. A well-managed company exercises rigorous control over the returns achieved by each of its profit centers, and it rewards the managers on the basis of such results. Specifically, when evaluating new investments in assets or projects, management will compute the estimated returns it expects to achieve and use these estimates as a basis for its decision to invest or not.2. Profit generation is the first and foremost purpose of a company. The effectiveness ofoperating performance determines the ability of the company to survive financially, to attract suppliers of funds, and to reward them adequately. Return on invested capital is the prime measure of company performance. The analyst uses it as an indicator of managerial effectiveness, and/or a measure of the company's ability to earn a satisfactory return on investment.3. If the investment base is defined as comprising net operating assets, then netoperating profit (e.g., before interest) after tax (NOPAT) is the relevant income figure to use. The exclusion of interest from income deductions is due to its being regarded asa payment for the use of money from the suppliers of debt capital (in the same waythat dividends are regarded as a payment to suppliers of equity capital). NOPAT is the appropriate amount to measure against net operating assets as both are considered to be operating.4. First, the motivation for excluding nonproductive assets from invested capital isbased on the idea that management is not responsible for earning a return on non-operating invested capital. Second, the exclusion of intangible assets from the investment base is often due to skepticism regarding their value or their contribution to the earning power of the company. Under GAAP, intangibles are carried at cost.However, if their cost exceeds their future utility, they are written down (or there will be an uncertainty exception regarding their carrying value in the auditor's opinion).The exclusion of intangible assets from the asset base must be based on more substantial evidence than a mere lack of understanding of what these assets represent or an unsupported suspicion regarding their value. This implies that intangible assets should generally not be excluded from invested capital.5. The basic formula for computing the return on investment is net income divided bytotal invested capital. Whenever we modify the definition of the investment base by, say, omitting certain items (liabilities, idle assets, intangibles, etc.) we must also adjust the corresponding income figure to make it consistent with the modified asset base.6. The relation of net income to sales is a measure of operating performance (profitmargin). The relation of sales to total assets is a measure of asset utilization or turnover—a means of determining how effectively (in terms of sales generation) the assets are utilized. Both of these measures, profit margin as well as asset utilization,determine the return realized on a given investment base. Sales are an important factor in both of these performance measures.7. Profit margin, although important, is only one aspect of the return on invested capital.The other is asset turnover. Consequently, while Company B's profit margin is high, its asset turnover may have been sufficiently depressed so as to drag down the overall return on invested capital, leading to the shareholder's complaint.8. The asset turnover of Company X is 3. The profit margin of Company Y is 0.5%. Sinceboth companies are in the same industry, it is clear that Company X must concentrate on improving its asset turnover. On the other hand, Company Y must concentrate on improving its profit margin. More specific strategies depend on the product and industry.9. The sales to total assets (asset turnover) component of the return on invested capitalmeasure reflects the overall rate of asset utilization. It does not reflect the rate of utilization of individual asset categories that enter into the overall asset turnover. To better evaluate the reasons for the level of asset turnover or the reasons for changes in that level, it is helpful to compute the rate of individual asset turnovers that make up the overall turnover rate.10. The evaluation of return on invested capital involves many factors. Theinclusion/exclusion of extraordinary gains and losses, the use/nonuse of trends, the effect of acquisitions accounted for as poolings and their chance of recurrence, the effect of discontinued operations, and the possibility of averaging net income are justa few of many such factors. Moreover, the analyst must take into account the effectsof price-level changes on return calculations. It also is important that the analyst bear in mind that return on invested capital is most commonly based on book values from financial statements rather than on market values. And finally, many assets either do not appear in the financial statements or are significantly understated. Examples of such assets are intangibles such as patents, trademarks, research and development activities, advertising and training, and intellectual capital.11. The equity growth rate is calculated as follows:[Net income – Preferred dividends – Common dividend payout] / Average common equity.This is the growth rate due to the retention of earnings and assumes a constant dividend payout over time. It indicates the possibilities of earnings growth without resort to external financing. The resulting increase in equity can be expected to earn the rate of return that the company earns on its assets and, thus, further contribute to growth in earnings.12. a. The return on net operating assets and the return on common stockholders' equitydiffer by the capital investment base (and its corresponding effects on net income).RNOA reflects the return on the net operating assets of the company whereas ROCE reflects the perspective of common shareholders.b. ROCE can be disaggregated into the following components to facilitate analysis:ROCE = RNOA + Leverage x Spread. RNOA measures the return on net operating assets, a measure of operating performance. The second component (Leverage x Spread) measures the effects of financial leverage. ROCE is increased by adding financial leverage so long as RNOA>weighted average cost of capital. That is, if the firm can earn a return on operating assets that is greater than the cost of the capital used to finance the purchase of those assets, then shareholders are better off adding debt to increase operating assets.13. a. ROCE can be disaggregated as follows:equitycommon Average Sales Sales dividends Preferred - income Net ⨯ This shows that “equity turnover” (sales to average common equity) is one of the two components of the return on common shareholders' equity. Assuming a stable profit margin, the equity turnover can be used to determine the level and trend of ROCE. Specifically, an increase in equity turnover will produce an increase in ROCE if the profit margin is stable or declines less than the increase in equity turnover. For example, a common objective of discount stores is to lower prices by lowering profit margins, but to offset this by increasing equity turnover by more than the decrease in profit margin.b. Equity turnover can be rewritten as follows:equitycommon Average assets operating Net assets operating Net Sales ⨯ The first factor reflects how well net operating assets are being utilized. If the ratio is increasing, this can signal either a technological advantage or under-capacity and the need for expansion. The second factor reflects the use of leverage. Leverage will be higher for those firms that have financed more of their assets through debt. By considering these factors that comprise equity turnover, it is apparent that EPS cannot grow indefinitely from an increase in these factors. This is because these factors cannot grow indefinitely. Even if there is a technological advantage in production, the sales to net operating assets ratio cannot increase indefinitely. This is because sooner or later the firm must expand its net operating asset base to meet rising sales or else not meet sales and lose a share of the market. Also, financing new assets with debt can increase the net operating assets to common equity ratio. However, this can only be pursued to a point —at which time the equity base must expand (which decreases the ratio).14. When convertible debt sells at a substantial premium above par and is clearly held byinvestors for its conversion feature, there is justification for treating it as the equivalent of equity capital. This is particularly true when the company can choose at any time to force conversion of the debt by calling it in.Exercise 8-1 (35 minutes)a. First alternative:NOPAT = $6,000,000 * 10% = $600,000Net income = $600,000 – [$1,000,000*12%](1-.40) = $528,000Second alternative:NOPAT = $6,000,000 * 10% = $600,000Net income = $600,000 – [$2,000,000*12%](1-.40) = $456,000b. First alternative:ROCE = $528,000 / $5,000,000 = 10.56%Second alternative:ROCE = $456,000 / $4,000,000 = 11.40%c. First alternative:Assets-to-Equity = $6,000,000 / $5,000,000 = 1.2Second alternative:Assets-to-Equity = $6,000,000 / $4,000,000 = 1.5d. First, let’s compute return on assets (R NOA):First alternative: $600,000 / $6,000,000 = 10%Second alternative: $600,000 / $6,000,000 = 10%Second, notice that the interest rate is 12% on the debt (bonds). More importantly, the after-tax interest rate is 7.2% (12% x (1-0.40)), which is less than RNOA. Hence, the company earns more on its assets than it pays for debt on an after-tax basis. That is, it can successfully trade on the equity—use bondholders’ funds to earn additional profits.Finally, since the second alternative uses more debt, as reflected in the assets-to-equity ratio in c, the second alternative is probably preferred. The shareholders would take on additional risk with the second alternative, but the expected returns are greater as evidenced from computations in b.Exercise 8-2 (40 minutes)a. NOPAT = Net income = $10,000,000 x 10% = $1,000,000b. First alternative:NOPAT = $1,000,000 + $6,000,000*10% = $1,600,000Net income = $1,600,000 – ($2,000,000 ⨯ 5% x [1-.40]) = $1,540,000Second alternative:NOPAT = $1,000,000 + $6,000,000*10% = $1,600,000Net income = $1,600,000 – ($6,000,000 ⨯ 6% x [1-.40]) = $1,384,000c. First alternative: ROCE = $1,540,000 / ($10,000,000 + $4,000,000) = 11%Second alternative: ROCE = $1,384,000 / ($10,000,000 + $0) = 13.84%d. ROCE is higher under the second alternative due to successful use ofleverage—that is, successfully trading on the equity. [Note: Asset-to-Equity is1.14=$16 mil./$14 mil. (1.60=$16 mil./$10 mil.) under the first (second)alternative.] The company should pursue the second alternative in the interest of shareholders (assuming projected returns are consistent with current performance levels).a. RNOA = 2 x 5% = 10%b. ROCE = 10% + 1.786 x 4.4% = 17.86%c. RNOA 10.00%Leverage advantage 7.86%Return on equity 17.86%Exercise 8-4 (30 minutes)a. Computation and Interpretation of ROCE:Year 5 Year 9Pre-tax profit margin .......................................................... 0.112 0.109 Asset turnover .................................................................... 0.46 0.44 Assets-to-equity ................................................................. 3.25 3.40 After-tax income retention * .............................................. 0.570 0.556 ROCE (product of above) .................................................. 9.54% 9.07% * 1-Tax rate.ROCE declines from Year 5 to Year 9 because: (1) pre-tax margin decreases by approximately 3%, (2) asset turnover declines by roughly 4.3%, and (3) the tax rate increases by about 3.8%. The combination of these factors drives the decline in ROCE—this is despite the slight improvement in the assets-to-equity ratio.b. The main reason EPS increases is that shareholders had a large amount ofassets and equity working for them. Namely, the company grew while return on assets and return on equity remained fairly stable. In addition, the amount of preferred stock declined, as did the amount of preferred dividends. With this decline in the cost of carrying preferred stock, earnings available to common stock increased.(CFA Adapted)a. RNOA = 3 x 7% = 21%b. ROCE = RNOA + LEV x Spread = 21% + (1.667 x 8.4%) = 35%c. Net leverage advantage to common equityReturn on net operating assets .................................. 21%Leverage advantage .................................................... 14%Return on common equity (rounding difference) ..... 35%Exercise 8-6 (30 minutes)a. At the present level of debt, ROCE = $157,500 / $1,125,000 = 14%.In the absence of leverage, the noncurrent liabilities would be substituted with equity. Accordingly, there would be no interest expense with all-equityROCE without leverage = $184,500 / $1,800,000 = 10.25%.14% with leverage but only 10.25% without leverage.b. NOPAT = $157,500 + [$675,000 x 8% x (1-.50)] = $184,500RNOA = $184,500 / ($2,000,000-$200,000) = 10.25%c. The company is utilizing borrowed funds in its capital structure. Since theROCE is greater than RNOA, the use of financial leverage is beneficial to stockholders. Specifically, the after cost of debt is 4% and the financial leverage (NFO/Equity) is $675,000 / $1,125,000 = 60%. Therefore,ROCE = RNOA + LEV x Spread = 10.25% + 0.60 x (10.25% - 4%) = 14%, as before. The favorable effect of financial leverage is given by the term [0.60 x (10.25% - 4%)] = 3.75%.1. c2. a3. cExercise 8-8 (20 minutes)(Assessments of profit margin and asset turnover are relative to industry norms.)a. Higher profit margin and lower asset turnover.b. Higher asset turnover and lower profit margin.c. Higher profit margin and similar/lower asset turnover.d. Higher asset turnover and similar/lower profit margin.e. Higher asset turnover and lower/similar profit margin.f. Higher asset turnover and similar/higher profit margin.g. Higher asset turnover and lower profit margin.Exercise 8-9 (20 minutes)The memorandum to Reliable Auto Sales President would include the following points:•Both Reliable and Legend Auto Sales are perpetually investing $100,000 in automobile inventory.•Legend Auto Sales is able to generate more profit than Reliable because it is turning over its inventory (10 cars) more often. Specifically, Legend is turning its inventory over 10 times per year while Reliable is turning its inventory over only 5 times per year. Hence, given the same investment in automobile inventory, Legend is twice as profitable as Reliable.•Encourage Reliable to sacrifice some return on each sale to increase the inventory turnover. By slightly reducing price, relative to that charged by Legend, Reliable predictably will find that overall profitability increases. This is because while profit per sale declines, the number of units sold and, therefore, inventory turnover will increase. These factors predictably yield increased return on assets.Computation of Asset (PP&E) Turnover [computed as Sales / PP&E (net)]: Northern: $12,000 / $20,000 = 0.60Southern: $6,000 / $20,000 = 0.30This implies that Northern generates $0.60 in sales per year for each $1 investment in PP&E. In contrast, Southern generates $0.30 in sales per year for each $1 investment in PP&E. This shows that Northern is able to generate twice the return for each $1 invested in PP&E. Assuming equal profit margins, Northern will report a higher return on assets because of the volume of sales that the company is able to generate with its investment in PP&E (at least in the short run).Exercise 8-11 (15 minutes)Low volume operations mean that fixed costs, which in the case of automakers are substantial, must be absorbed by a low number of units produced. Since the lower of cost or market rule implies that inventory cannot be priced higher than expected sales price less costs of disposal plus a normal profit margin, much of that excess cost must be charged to the period incurred. In this case, that means the fourth quarter financial statements absorb much of this cost. This is probably the most likely accounting-based reason for the fourth quarter losses described in the news release.Problem 8-1 (30 minutes)a. 1. Quaker Oats does not reveal its computation of this return. Accordingly, wemake some simple computations and assumptions: (i) For simplicity, focus on one share, (ii) The dividend is $1.56 for Year 11, (iii) The average stock price is $55 and the price increase for Year 11 is $14—based on the beginning price of $48 and the ending price of $62. Using this information, we compute return to a share of stock as follows:= [Dividend per share + Price increase per share] / Average price per share = [$1.56 + $14] / $55= 28.3%However, if we use the beginning price of $48 per share, we get closer to the company's 34% return:= [$1.56 + $14] / $48= 32.4%2. The return on common equity is based on the relation between net incomeand the book value of the equity capital. In contrast, Quaker Oats’ “return t o shareholders” uses dividends plus market value change in relation to the market price per share (cost of investment to shareholders.)b. The company must have derived the 3.6% from price, market, and otherfactors that are not disclosed. Conceptually, this 3.6% should reflect the added risk of an investment in Quaker Oats’ stock vis-à-vis a risk-free security such as a U.S. Treasury bond.c. Quaker does not reveal its computations. It may disclose a variety of interestrates on long-term debt that it carries in the notes to financial statements.Based on data available to it, but not to the financial statement reader, it probably computed a weighted-average interest rate from which it deducted the tax benefit in arriving at the 6.4% cost of debt.a. Computation of Return on Invested Capital Measures:As a first step, we construct the company’s income statement.Sales (500,000 units @ $10). ................................................ $5,000,000 Fixed costs ....................................................................... 1,500,000 Variable costs (500,000 units @ $4). ............................. 2,000,000 Labor costs (20 employees x $35,000). ......................... 700,000 Income before taxes .......................................................... 800,000 Taxes (50% rate) ................................................................. 400,000 Net income .......................................................................... $ 400,000(1) RNOA = [$400,000 + ($2,000,000 x 7.5%)(1-0.50)] / ($8,000,000-$2,00,000)= $475,000 / $6,000,000 = 7.92%(2) ROCE = [$400,000 - ($1,000,000 x 6%)] / $3,000,000 = 11.33%Fixed costs ($1,500,000 x 1.06) ......................................................... 1,590,000 Variable costs ($550,000 units @ $4) .............................................. 2,200,000 Income before labor costs and taxes ............................................. $1,710,000 To obtain a 10% return on long-term debt and equity capital, Zear will need a numerator of $600,000 given an invested capital base of $6,000,000. The required operating income to yield this $600,000 amount is computed as: Net income + Interest expense x (1 - 0.50) = $600,000Net income + ($2,000,000 x 7.5%) x (1-0.50) = $600,000Net income = $525,000Assuming taxes at a 50% rate, Zear needs pre-tax income of $1,050,000, computed as:Income before labor and taxes ............ $1,710,000Labor costs ........................................... ?Pre-tax income ...................................... $1,050,000This implies:Labor costs = $660,000 orAverage wage per worker = $660,000 / 22 employees = $30,000 per employee Since the current salary level is $35,000, Zear cannot achieve its target return level and give a salary raise to its employees.(CFA Adapted)a. ROCE = $1,650 / $3,860 = 42.7%b. NOPAT = ($2,550 + $10) x (1-0.35) = $1,664NOA = $7,250-$3,290 = $3,960RNOA (using year-end NOA balance) = $1,664 / $3,960 = 42%The effect of financial leverage, thus, is only 0.7% as NFO/NFE are insignificant. Most of Merck’s ROCE in this year is derived from operating results.Pre-tax income to sales 0.36Net income to sales 0.23Sales/current assets 1.47Sales / fixed assets 2.97Sales / total assets 0.98Total liabilities / equity 0.88L-T liabilities / equity 0.03a. 1. RNOA = NOPATAvg. NOANOPAT = [$186,000 + $2,000 - $120,000 - $37,000 + $1,000] x 50% = $16,000 Note: we include income from equity investments under the assumptions that these are operating rather than financial investments. We also include the cumulative effect as operating in the absence of information to the contrary. Minority interest and discontinued operations are nonoperating (minority interest is therefore, treated as equity in the ROCE computation).NOA Year 6 = $138,000 - $29,000 - $7000 - $3,600 = $98,400 NOA Year 5 = $105,000 - $23,000 - $2,000 - $2,000 = $78,000RNOA = $16,000 / ([$98,400 + $78,000]/2) = 18.14%2. ROCE = Net income - Preferred dividendsAverage common equityROCE = ($10,000 –$0) /[($55,400* + $47,800*)/2] = 19.38% *Note: minority interest is treated as equity. If Minority interest is ignored, the ROCE is 19.8%b. NFO = NOA - EquityYear 6: $43,000; Year 5: $30,200LEV = Avg. NFO / Ave Equity = ([$43,000 + $30,200] / 2) / ([$55,400* + $47,800*] /2)= 0.71NFE = NOPAT – Net incomeYear 6: $6,000NFR = NFE / Avg. NFO = $6,000 / ([$43,000 + $30,200] / 2) = 16.4%Spread = RNOA – NFR = 18.14% - 16.4% = 1.74%ROCE = RNOA + LEV x Spread = 18.14 + 0.71 x 1.74% = 19.38%94% (18.14%/19.38%) of Zeta’s ROCE is derived for m operating activities. The company is effectively using leverage, however, as indicated by the positive spread, but the leverage does not contribute significantly to Zeta’s return on equity and may not be worth the added risk.a. ROCE = [Net income –preferred dividends] / stockholders’ equity**end of year in this problemROCE Year 5: [$14 – $0] / $125 = 11.2%ROCE Year 9: [$34 - $0] / $220 = 15.5%RNOA Year 5 = ($35 x 0.50) / ($52 + $123) = 10.0%RNOA Year 9 = ($68 x 0.50) / ($63 + $157) = 15.5%ROCE = RNOA + Leverage x SpreadYear 5: 10.0% + 1.2% = 11.2%Year 9: 15.5% + 0 = 15.5%b. Texas Talcom’s ROCE has increased form years 5 to 9. The source is thisincrease, however, has been an increase in RNOA as the leverage effect is zero in Year 9 since its long-term debt has been retired. Given the RNOA increase, additional leverage might be explored as a way to increase shareholder returns.Selling price per unit ...................... $6.00 $5.00 $50.00 $50.00 Unit cost ........................................... $5.00 $4.00 $32.50 $30.00Analysis of Variation in Product A SalesIncreased quantity at Yr 6 prices (3,000 x $5) ........................ $ 15,000 Price increase at Yr 6 quantity (7,000 x $1) ........................... 7,000 Quantity increase x price increase (3,000 x $1) .................... 3,000 Analysis of Variation in Product A Cost of SalesIncreased quantity at Yr 6 cost (3,000 x $4) ........................... (12,000) Increased cost at Yr 6 quantity (7,000 x $1) ........................... (7,000) Cost increase x quantity increase (3,000 x $1) ...................... (3,000) Net Variation (Increase) in Gross Margin for Product A ............. $ 3,000Analysis of Variation in Product B SalesDecreased quantity at Yr 6 prices (300 x $50) ....................... $ (15,000) Analysis of Variation in Product B Cost of Sales:Decreased quantity at Yr 6 cost (300 x $30) .......................... 9,000 Increased cost at Yr 6 quantity (900 x $2.50) ......................... (2,250) Cost increase x quantity decrease (300 x $2.50) . (750)Net Variation (Decrease) in Gross Margin for Product B ............ $ (7,500)Summary of Net Variation in Margins for Products A and BNet increase from product A ......................................................... $ 3,000 Net decrease from product B ........................................................ (7,500) Net Decrease in Gross Margin ...................................................... $ (4,500)a.SPYRES MANUFACTURING COMPANYComparative Common-Size Income StatementsYear Ended December 31 IncreaseYear 9 Year 8(Decrease)Net sales ............................. 100.0% 100.0% 20.0% Cost of goods sold ............ 81.7 86.0 14.0 Gross margin on sales ...... 18.3 14.0 57.1 Operating expenses .......... 16.8 10.2 98.0 Income before taxes .......... 1.5 3.8 (52.6) Income taxes ...................... 0.4 1.0 (52.0) Net income ......................... 1.1 2.8 (52.9)b. Performance in Year 9 is poor when compared with Year 8. One bright spot isthe percentage of Cost of Goods Sold to Sales, which decreased in Year 9.However, Operating Expenses climbed sharply. This sharp climb in operating expenses is unexpected since there is usually a larger fixed cost component comprising these costs compared with that for Cost of Goods Sold.Management should further check operating expenses. If operating expenses had remained at the Year 8 level of 10.2%, income would have been up favorably for Year 9. Operating expenses may have included a future-directed component such as advertising or training costs. Also, management would want to follow up on the change in gross margin. The sharp improvement in gross margin may have been due to factors such as the liquidation LIFO inventory layers or, alternatively, to something more fundamental with the activities of the firm.。