曼昆经济学原理第七章(第七版)
- 格式:ppt
- 大小:474.00 KB
- 文档页数:11
(完整)曼昆-经济学原理(微观)-第7版-概念归纳-打印版编辑整理:尊敬的读者朋友们:这里是精品文档编辑中心,本文档内容是由我和我的同事精心编辑整理后发布的,发布之前我们对文中内容进行仔细校对,但是难免会有疏漏的地方,但是任然希望((完整)曼昆-经济学原理(微观)-第7版-概念归纳-打印版)的内容能够给您的工作和学习带来便利。
同时也真诚的希望收到您的建议和反馈,这将是我们进步的源泉,前进的动力。
本文可编辑可修改,如果觉得对您有帮助请收藏以便随时查阅,最后祝您生活愉快业绩进步,以下为(完整)曼昆-经济学原理(微观)-第7版-概念归纳-打印版的全部内容。
经济学原理名词解释归纳一、经济学十大原理稀缺性:社会资源的有限性。
经济学:研究社会如何管理自己的稀缺资源。
效率:社会能从其稀缺资源中得到最大利益的特性。
平等:经济成果在社会成员中公平分配的特性.机会成本:为了得到某种东西所必须放弃的东西。
理性人:系统而有目的地尽最大努力实现其目标的人。
边际变动:对行动计划微小的增量调整.激励:引起一个人做出某种行为的某种东西。
市场经济:当许多企业和家庭在物品与服务市场上相互交易时,通过他们的分散决策配置资源的经济.产权:个人拥有并控制稀缺资源的能力市场失灵:市场本身不能有效配置资源的情况。
外部性:一个人的行为对旁观者福利的影响.市场势力:单个经济活动者(或某个经济活动小群体)对市场价格有显著影响的能力。
生产率:每单位劳动投入所生产的物品与服务数量。
通货膨胀:经济中物价总水平的上升.经济周期:就业和生产等经济活动的波动菲利普斯曲线:通货膨胀与失业之间的短期权衡取舍。
二、像经济学家一样思考循环流向图:一个说明货币如何通过市场在家庭与企业之间流动的直观经济模型.生产可能性边界:表示在可得到的生产要素与生产技术既定时,一个经济所能生产的产品数量的各种组合的图形。
微观经济学:研究家庭和企业如何做出决策,以及它们如何在市场上的相互交易的学科.宏观经济学:研究整体经济现象,包括通货膨胀、失业和经济增长的学科。
微观经济学原理(第七版)-曼昆-名词解释(带英文)微观经济学原理曼昆名词解释1. 需求价格弹性(price elasticity of demand):2. 蛛网模型():对于生产周期较长的商品供给的时滞性,需求的不是动态模型分类,画图3. 边际效用递减(diminishing marginal utility)――基数效用论不违反边际效用递减规律。
因为边际效用是指物品的消费量每增加(或减少)一个单位所增加(或减少)的总效用的量。
这里的“单位”是指一完整的商品单位,这种完整的商品单位,是边际效用递减规律有效性的前提。
比如,这个定律适用于一双的鞋子,但不适用于单只的鞋子。
对于四轮车而言,必须是有四个轮子的车才成为一单位。
三个轮子不能构成一辆四轮车,因而每个轮子都不是一个有效用的物品,增加一个轮子,才能使车子有用。
因此,不能说第四个轮子的边际效用超过第三个轮子4. 无差异曲线(indifference curve):一条表示给消费者相同满足程度的消费组合的曲线。
(2)特征:凸向原点越远越大不相交5. 边际替代率(marginal rate of substitution.MRS):――序数效用论6. 预算线(Budget line/ budget constraint)7. 吉芬物品(Giffen good):价格上升引起需求量增加的物品。
8. 柯布道格拉斯生产函数稀缺性(scarcity):社会资源的有限性。
经济学(economics):研究社会如何管理自己的稀缺资源。
效率(efficiency):社会能从其稀缺资源中得到最多东西的特性。
平等(equality):经济成果在社会成员中公平分配的特性。
机会成本(opportunity cost):为了得到某种东西所必须放弃的东西。
理性人(rational people):系统而有目的地尽最大努力实现起目标的人。
边际变动(marginal change):对行动计划微小的增量调整。
曼昆《经济学原理》第七版课后习题的答案(中文版)!!30曼昆《经济学原理》第七版课后习题的答案(中文版)!!练习题1、任何一个所得税表都体现了两种税率——平均税率和边际税率。
(题中的表见课本12章)a、平均税率定义为支付的总税收除以收入。
对表12—7中的比例税制来说,赚5万美元、10万美元和20万美元的人,其平均税率分别是多少?在累退税制和累进税制中相对应的平均税率是多少?答:从表12—7中很容易看出,赚5万美元、10万美元和20万美元的人,其平均税率都是25%。
在累退税制中,赚5万美元、10万美元和20万美元的人,其平均税率分别是30%,25%,20%。
在累进税制中,赚5万美元、10万美元和20万美元的人,其平均税率分别是20%,25%,30%。
b、边际税率定义为额外收入支付的税收除以增加的额外收入。
计算比例税制下,收入从5万美元增加到10万美元的边际税率。
计算收入从10万美元增加到20万美元的边际税率。
计算累退税制和累进税制下相对应的边际税率答:(1)比例税制。
当收入从5万美元增加到10万美元时,税收量增加了1.25万,因此边际税率为1.25/5=0.25,即25%。
当收入从10万美元增加到20万美元时,税收量增加了2.5万,因此边际税率为2.5/10=0.25,即25%。
(2)累退税制。
当收入从5万美元增加到10万美元时,税收量增加了1万,因此边际税率为1/5=0.2,即20%。
当收入从10万美元增加到20万美元时,税收量增加了1.5万,因此边际税率为1.5/10=0.15,即15%。
(3)累进税制。
当收入从5万美元增加到10万美元时,税收量增加了1.5万,因此边际税率为1.5/5=0.3,即30%。
当收入从10万美元增加到20万美元时,税收量增加了3.5万,因此边际税率为3.5/10=0.35,即35%。
c、描述这三种税制中每一种的平均税率和边际税率之间的关系。
一般来说,某人在决定是否接受工资比目前工作略高一点的工作时,哪一种税率更适用?在判断税制的纵向平等时,哪一种税率更适用?答:在比例税制下,平均税率和边际税率相等,且都不随收入变动而变动。


复习题1.解释买者的支付意愿、消费者剩余和需求曲线如何相关。
答:需求曲线反映了买者的支付意愿。
在任何一种数量时,需求曲线给出的价格表示边际买者的支付意愿。
需求曲线以下和价格以上的总面积是一种物品或劳务市场上所有买者消费者剩余的总和。
2.解释卖者的成本、生产者剩余和供给曲线如何相关。
36答:供给曲线的高度与卖者的成本相关。
在任何一种数量时,供给曲线给出的价格表示边际卖者的成本。
价格之下和供给曲线以上的面积衡量市场的生产者剩余。
3.在供求图中,标出市场均衡时的生产者剩余和消费者剩余。
答:APE 的面积代表消费者剩余;PBE 的面积代表生产者剩余。
图7-1 供求图4.什么是效率?它是经济决策者的唯一目标吗?答:效率是指资源配置使社会所有成员得到的总剩余最大化的性质。
除了效率外,经济决策者还应该关心平等。
实际上,市场交易的好处很像在市场参与者之间分割一块蛋糕,经济决策者不仅要关心如何将经济蛋糕做大,即效率;还要考虑如何在市场参与者之间分这块蛋糕,这就涉及公平问题。
5.看不见的手有什么作用?答:每一个市场参与者都会尽力追求自己的利益,看不见的手指引他们在相互竞争中达到一个并非他们本意想要达到的目的,这就是市场均衡点。
在均衡点上,消费者剩余和生产者剩余总和最大化,整个社会福利达到最大。
6.说出两种市场失灵的名称。
解释为什么每一种都可能使市场结果无效率。
答:市场失灵包括市场势力和外部性。
如果某一市场上存在市场势力,即只有极少部分(可能是一个)买者或卖者可以控制市场价格,他们就会使价格趋向于对他们这一小部分人有益的水平。
于是,市场价格和数量背离供求平衡,社会福利达不到最大,市场失去效率。
外部性是某些市场参与者的行为对旁观者福利的影响。
它使市场福利还要取决于买者评价和卖者成本之外的其他因素。
由于买者和卖者在决定消费和生产时并没有考虑这种负作用。
所以,从整个社会角度来看,市场均衡可能是无效率的。
问题与应用1.Melissa用120美元购买了一个iPod,并得到了80美元的消费者剩余。


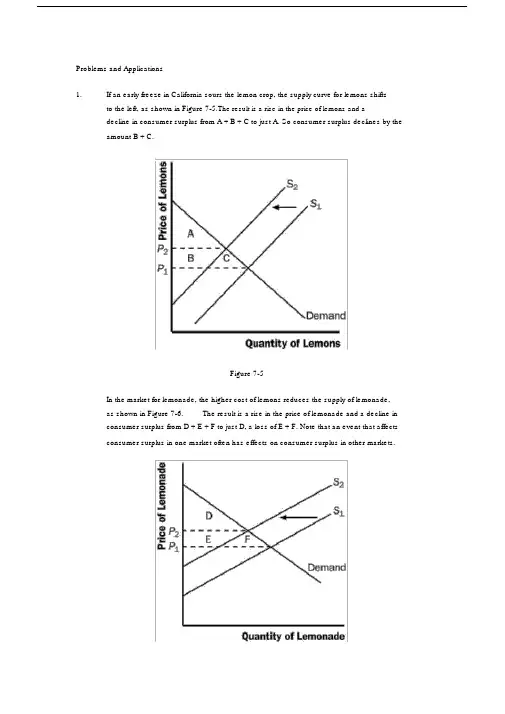
Problems and Applications1.If an early freeze in California sours the lemon crop, the supply curve for lemons shiftsto the left, as shown in Figure 7-5.The result is a rise in the price of lemons and adecline in consumer surplus from A + B + C to just A. So consumer surplus declines by the amount B + C.Figure 7-5In the market for lemonade, the higher cost of lemons reduces the supply of lemonade,as shown in Figure 7-6.The result is a rise in the price of lemonade and a decline inconsumer surplus from D + E + F to just D, a loss of E + F. Note that an event that affectsconsumer surplus in one market often has effects on consumer surplus in other markets.Figure 7-62. A rise in the demand for French bread leads to an increase in producer surplus in themarket for French bread, as shown in Figure 7-7.The shift of the demand curve leads to an increased price, which increases producer surplus from area A to area A + B + C.Figure 7-7The increased quantity of French bread being sold increases the demand for flour, asshown in Figure 7-8.As a result, the price of flour rises, increasing producer surplusfrom area D to D + E + F. Note that an event that affects producer surplus in onemarket leads to effects on producer surplus in related markets.Figure 7-83. a.Bert’ s demand schedule is:Price Quantity DemandedMore than $7 0$5 to $7 1$3 to $5 2$1 to $3 3$1 or less 4Bert’ s demand curve is shown in Figure 7 -9.Figure 7-9b.When the price of a bottle of water is $4, Bert buys two bottles of water.Hisconsumer surplus is shown as area A in the figure.He values his first bottle ofwater at $7, but pays only $4 for it, so has consumer surplus of $3.He valueshis second bottle of water at $5, but pays only $4 for it, so has consumersurplus of $1.Thus Bert’ s total consumer surplus is $3 + $1 = $4, which isthe area of A in the figure.c.When the price of a bottle of water falls from $4 to $2, Bert buys three bottlesof water, an increase of one. His consumer surplus consists of both areas Aand B in the figure, an increase in the amount of area B. He gets consumersurplus of $5 from the first bottle ($7 value minus $2 price), $3 from thesecond bottle ($5 value minus $2 price), and $1 from the third bottle ($3 valueminus $2 price), for a total consumer surplus of $9. Thus consumer surplusrises by $5 (which is the size of area B) when the price of a bottle of water fallsfrom $4 to $2.4. a. Ernie ’ s supply schedule for water is:Price Quantity SuppliedMore than $7 4$5 to $7 3$3 to $5 2$1 to $3 1Less than $1 0Ernie’ s supply curve is shown in Figure 7 -10.Figure 7-10b.When the price of a bottle of water is $4, Ernie sells two bottles of water.Hisproducer surplus is shown as area A in the figure.He receives $4 for his firstbottle of water, but it costs only $1 to produce, so Ernie has producer surplusof $3.He also receives $4 for his second bottle of water, which costs $3 toproduce, so he has producer surplus of$1. Thus Ernie’ s total producersurplus is $3 + $1 = $4, which is the area of A in the figure.c.When the price of a bottle of water rises from $4 to $6, Ernie sells three bottlesof water, an increase of one.His producer surplus consists of both areas Aand B in the figure, an increase by the amount of area B.He gets producersurplus of $5 from the first bottle ($6 price minus $1 cost), $3 from the secondbottle ($6 price minus $3 cost), and $1 from the third bottle ($6 price minus $5price), for a total producer surplus of $9.Thus producer surplus rises by $5(which is the size of area B) when the price of a bottle of water rises from $4to $6.5. a. From Ernie ’ s supply schedule and Bert ’ s demand schedule, the quantitydemanded and supplied are:Price Quantity Supplied Quantity Demanded$ 2 1 34 2 26 3 1Only a price of $4 brings supply and demand into equilibrium, withan equilibrium quantity of 2.b.At a price of $4, consumer surplus is $4 and producer surplus is $4, as shownin problems 3 and 4.Total surplus is $4 + $4 = $8.c.If Ernie produced one fewer bottle, his producer surplus would decline to $3,as shown in problem 4.If Bert consumed one fewer bottle, his consumersurplus would decline to $3, as shown in problem 3. So total surplus would declineto $3 + $3 = $6.d.If Ernie produced one additional bottle of water, his cost would be $5, but theprice is only $4, so his producer surplus would decline by $1.If Bertconsumed one additional bottle of water, his value would be $3, but the priceis $4, so his consumer surplus would decline by $1.So total surplus declinesby $1 + $1 = $2.6. a.The effect of falling production costs in the market for stereos results in a shiftto the right in the supply curve, as shown in Figure 7-11.As a result, theequilibrium price of stereos declines and the equilibrium quantity increases.b.The decline in the price of stereos increases consumer surplus from area A to A+ B + C + D, an increase in the amount B + C + D.Prior to the shift in supply,producer surplus was areas B + E (the area above the supply curve and belowthe price).After the shift in supply, producer surplus is areas E + F + G.Soproducer surplus changes by the amount F + G - B, which may be positive ornegative.The increase in quantity increases producer surplus, while thedecline in the price reduces producer surplus.Since consumer surplus risesby B + C + D and producer surplus rises by F + G - B, total surplus rises by C+ D+F+G.c.If the supply of stereos is very elastic, then the shift of the supply curvebenefits consumers most.To take the most dramatic case, suppose thesupply curve were horizontal, as shown in Figure 7-12.Then there is noproducer surplus at all.Consumers capture all the benefits of fallingproduction costs, with consumer surplus rising from area A to area A + B.Figure 7-11Figure 7-127. Figure 7-13 shows supply and demand curves for haircuts. Supply equals demand ata quantity of three haircuts and a price between $4 and $5. Firms A, C, and D shouldcut the hair of Sally Jessy, Jerry, and Montel. Oprah ’ s willingness to pay is too low and firm B ’ s costs are too high, so they do not participate. The maximum total surplus isthe area between the demand and supply curves, which totals $11 ($8 value minus$2 cost for the first haircut, plus $7 value minus $3 cost for the second, plus $5 valueminus $4 cost for the third).Figure 7-138. a.The effect of falling production costs in the market for computers results in ashift to the right in the supply curve, as shown in Figure 7-14.As a result, theequilibrium price of computers declines and the equilibrium quantity increases.The decline in the price of computers increases consumer surplus from area Ato A + B + C + D, an increase in the amount B + C + D.Figure 7-14Prior to the shift in supply, producer surplus was areas B + E (the area abovethe supply curve and below the price).After the shift in supply, producersurplus is areas E + F + G.So producer surplus changes by the amount F + G- B, which may be positive or negative.The increase in quantity increasesproducer surplus, while the decline in the price reduces producer surplus. Sinceconsumer surplus rises by B + C + D and producer surplus rises by F + G - B,total surplus rises by C + D + F + G.——Figure 7-15b.Since adding machines are substitutes for computers, the decline in the priceof computers means that people substitute computers for adding machines,shifting the demand for adding machines to the left, as shown in Figure 7-15.The result is a decline in both the equilibrium price and equilibrium quantity ofadding machines.Consumer surplus in the adding-machine market changesfrom area A + B to A + C, a net gain of C - B.Producer surplus changes fromarea C + D + E to area E, a net loss of C + D.Adding machine producers aresad about technological advance in computers because their producersurplus declines.c.Since software and computers are complements, the decline in the price andincrease in the quantity of computers means that people’ s demand forsoftware increases, shifting the demand for software to the right, as shown inFigure 7-16. The result is an increase in both the price and quantity of software.Consumer surplus in the software market changes from B + C to A+B, a net increase of A - C. Producer surplus changes from E to C + D + E, anincrease of C + D, so software producers should be happy about the technologicalprogress in computers.d.Yes, this analysis helps explain why Bill Gates is one the world’ s richest msince his company produces a lot of software that’ s a complement withcomputers and there has been tremendous technological advance incomputers.——Figure 7-169. a. Figure 7-17 illustrates the demand for medical care. If each procedure has aprice of $100, quantity demanded will be Q 1 procedures.Figure 7-17b.If consumers pay only $20 per procedure, the quantity demanded will be Q 2procedures.Since the cost to society is $100, the number of proceduresperformed is too large to maximize total surplus.The quantity thatmaximizes total surplus is Q 1 procedures, which is less than Q2.c.The use of medical care is excessive in the sense that consumers getprocedures whose value is less than the cost of producing them.As a result,——the economy’ s total surplus is reduced.d.To prevent this excessive use, the consumer must bear the marginal cost ofthe procedure.But this would require eliminating insurance.Anotherpossibility would be that the insurance company, which pays most of themarginal cost of the procedure ($80, in this case) could decide whether theprocedure should be performed.But the insurance company doesn’ t get thebenefits of the procedure, so its decisions may not reflect the value to theconsumer.10. a. Figure 7-18 illustrates the effect of the drought. The supply curve shifts tothe left, leading to a rise in the equilibrium price from P 1 to P 2 and a decline inthe equilibrium quantity from Q 1 to Q 2 .Figure 7-18b.If the price of water is not allowed to change, there will be an excess demandfor water, with the shortage shown on the figure as the difference between Q 1and Q 3 .c.The system for allocating water is inefficient because it no longer allocateswater to those who value it most highly.Some people who value water atmore than its cost of production will be unable to obtain it, so societysurplus isn’ t maximized.The allocation system seems unfair as well.Water is allocated simply on pastusage, rewarding past wastefulness.If a family’ s demand for water increases,——say because of an increase in family size, the policy doesn ’ t allow them to obtain more water. Poor families, who probably used water mostly fornecessary uses like drinking, would suffer more than wealthier families whowould have to cut back only on luxury uses of water like operating backyardfountains and pools. However, the policy also keeps the price of water lower,which benefits poor families, since otherwise more of their family budgetwould have to go for water.d. If the city allowed the price of water to rise to its equilibrium price P 2 , theallocation would be more efficient. Quantity supplied would equal quantitydemanded and there would be no shortage. Total surplus would bemaximized.Whether the market allocation would be more or less fair than theproportionate reduction in water under the old policy is difficult to say, but it islikely to be more fair. Notice that the quantity supplied would be higher (Q 2)in this case than under the water restrictions (Q 3 ), so there ’ s less reduction inwater usage. To make the market solution even more fair, the governmentcould provide increased tax relief or welfare payments for poor families whosuffer from paying the higher water prices.。