用matlab实现双线性插值旋转图像程序
- 格式:doc
- 大小:40.50 KB
- 文档页数:4
用matlab实现双线性插值旋转图像程序
2008年11月06日 星期四 19:13
用matlab实现双线性插值旋转图像程序
2008-04-27 1
2:51
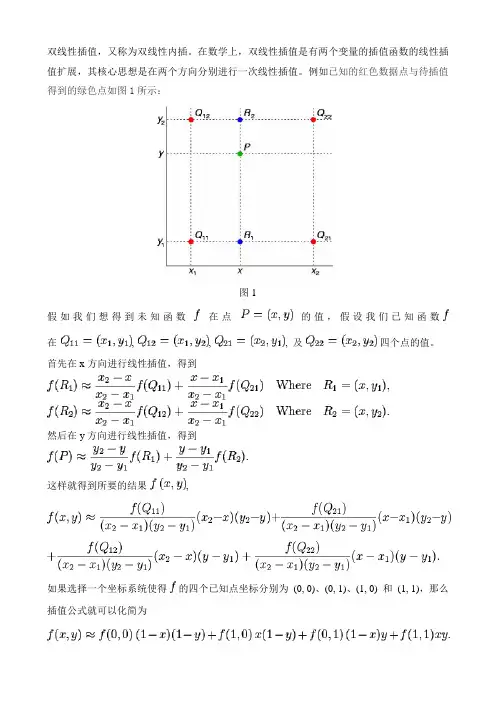
双线性插值: 输出像素值是它在输入图像中2*2邻域采样点的平均值,它根据某像素周围4个像素的灰度值在水平和垂直两个方法上对其插值。为了方便理解,先考虑一维情况下的线性插值:对于一个数列c,假设c[a]到c[a+1]之间是线性变化的,那么对于浮点数x(a<=x
c(x,b) = c[a+1][b]*(x-a)+c[a][b]*(1+a-x);
c(x,b+1) = c[a+1][b+1]*(x-a)+c[a][b+1]*(1+a-x);
好,现在已经知道c(x,b)和c(x,b+1)了,而根据假设c(x,b)到c(x,b+1)也是线性变化的,所以:
c(x,y) = c(x,b+1)*(y-b)+c(x,b)*(1+b-y) 。
对应以上原理,双线性插值的matlab程序如下:
function [imN] = im_R(im,rotation) %im是输入图像,rotation是旋转矩阵
close all;
im = imread(im);
subplot(1,2,1);
imshow(im);
dim = ndims(im); %确定维数,对灰度和彩色图像分别处理
w = size(im,2);
h = size(im,1);
if( dim == 3 )
imN = zeros( h, w, 3 );
else
imN = zeros(h,w);
end
im = double(im);
for r = 1 : h
for c = 1 : w
t = rotation * [ r - h / 2; c - w / 2 ] + [ h / 2; w / 2 ];%旋转
if( t(1) > 1 && t(2) > 1 && t(1) < h && t(2) < w )%双线性插值
x = floor( t(1) );
y = floor( t(2) );
v1 = im( x + 1, y, : ) * ( t(1) - x ) + im( x, y, : ) * ( 1
+ x - t(1) );
v2 = im( x + 1, y + 1, : ) * ( t(1) - x ) + im( x, y + 1, : )
* ( 1 + x - t(1) );
v = v2 * ( t(2) - y ) + v1 * ( 1 + y - t(2) );
imN( r, c, : ) = round(v);
end
end
end
imN = uint8(imN);
subplot(1,2,2);
imshow(imN);
出处:/kr1423/blog/item/89921324ce87862cd507424e.html
三次样条插值法
h0=figure('toolbar','none',...
'position',[200 50 350 450],...
'name','实例86');
h1=axes('parent',h0,...
'position',[0.10 0.45 0.8 0.5],...
'visible','off');
x=0:0.2:2*pi;
y=sin(x);
plot(x,y)
b1=uicontrol('parent',h0,...
'units','points',...
'tag','b1',...
'style','pushbutton',...
'string','三次样条插值',...
'backgroundcolor',[0.75 0.75 0.75],...
'position',[20 60 70 20],...
'callback',[...
'y=0,',...
'sy=0,',...
'strn1=get(e2,''string'');,',...
'n1=str2num(strn1);,',...
'strn2=get(e3,''string'');,',...
'n2=str2num(strn2);,',...
'x=n1:0.2:n2;,',...
'i=1;,',...
'for t=n1:0.2:n2,',...
'y(i)=sin(t);,',...
'sy(i)=san(t,n1,n2);,',...
'i=i+1;,',...
'end,',...
'plot(x,y,''b*'',x,sy,''r-''),',...
'axis([0 7 -1.5 1.5]),',...
'legend(''sin(x)'',''N-Hermite插值'')']);
b2=uicontrol('parent',h0,...
'units','points',...
'tag','b2',...
'style','pushbutton',...
'string','误差比较',...
'backgroundcolor',[0.75 0.75 0.75],...
'position',[170 60 70 20],...
'callback',[...
'strdn1=get(e2,''string'');,',...
'n1=str2num(strdn1);,',...
'strdn2=get(e3,''string'');,',...
'n2=str2num(strdn2);,',...
'strdn=get(e1,''string'');,',...
'dn=str2num(strdn);,',...
'dd=abs(sin(dn)-san(dn,n1,n2));,',...
'msgbox([''误差为:'',num2str(dd)],''计算结果'')']);
e1=uicontrol('parent',h0,...
'units','points',...
'tag','e1',...
'style','edit',...
'fontsize',12,...
'string','1.20',...
'horizontalalignment','right',...
'backgroundcolor',[1 1 1],...
'position',[200 100 40 20]);
t1=uicontrol('parent',h0,...
'units','points',...
'tag','t1',...
'style','text',...
'string','误差点:',...
'fontsize',12,...
'backgroundcolor',[0.75 0.75 0.75],...
'position',[160 100 40 20]);
e2=uicontrol('parent',h0,...
'units','points',...
'tag','e2',...
'style','edit',...
'fontsize',12,...
'string','1.00',...
'horizontalalignment','right',...
'backgroundcolor',[1 1 1],...
'position',[20 85 40 20]);
t2=uicontrol('parent',h0,...
'units','points',...
'tag','t2',...
'style','text',...
'string','第一节点:',...
'fontsize',12,...
'backgroundcolor',[0.75 0.75 0.75],...
'position',[15 105 50 20]);
e3=uicontrol('parent',h0,...
'units','points',...
'tag','e3',...
'style','edit',...
'fontsize',12,...
'string','3.00',...
'horizontalalignment','right',...
'backgroundcolor',[1 1 1],...
'position',[100 85 40 20]);
t3=uicontrol('parent',h0,...
'units','points',...
'tag','t3',...
'style','text',...
'string','第二节点:',...
'fontsize',12,...
'backgroundcolor',[0.75 0.75 0.75],...
'position',[95 105 50 20]);
b3=uicontrol('parent',h0,...
'units','points',...
'tag','b3',...
'style','pushbutton',...
'string','关闭',...
'backgroundcolor',[0.75 0.75 0.75],...
'position',[100 20 60 20],...