Spectra of Stable Non-Noble Gas Single Bubble Sonoluminescence
- 格式:pdf
- 大小:211.88 KB
- 文档页数:5
References1.Kramida,A.,Ralchenko,Y.,Reader,J.,&NIST ASD Team.(2018).NIST atomic spectradatabase(version5.5.6).2.Sansonetti,C.J.,Blackwell,M.M.,&Saloman,E.B.(2002).Infrared spectra of the noblegases.Physica Scripta,T100,120–125.3.Mantz,A.(1976).Infrared multiplexed studies of transient species.Applied Spectroscopy,30(4),459–461.4.Berg,P.,&Sloan,J.(1993).Compact standalone data-acquisition system for submicrosecondtime-resolved Fourier-transform spectroscopy.Review of Scientific Instruments,64(9),2508–2514.5.Kawaguchi,K.,Baskakov,O.,Hosaki,Y.,Hama,Y.,&Kugimiya,C.(2003).Time-resolvedFourier transform spectroscopy of pulsed discharge products.Chemical Physics Letters,369(3–4),293–298.6.Ferus,M.,Kubelík,P.,Kawaguchi,K.,Dryahina,K.,Španˇe l,P.,&Civiš,S.(2011).HNC/HCNratio in acetonitrile,formamide,and BrCN discharge.Journal of Physical Chemistry A,115(10), 1885–1899.7.Civiš,S.,Kubelík,P.,&Ferus,M.(2012).Time-resolved Fourier transform emission spec-troscopy of He/CH4in a positive column discharge.Journal of Physical Chemistry A,116(12), 3137–3147.PMID:22375598.8.Kawaguchi,K.,Sanechika,N.,Nishimura,Y.,Fujimori,R.,Oka,T.N.,Hirahara,Y.,et al.(2008).Time-resolved Fourier transform infrared emission spectroscopy of laser ablation prod-ucts.Chemical Physics Letters,463(1–3),38–41.9.Nakanaga,T.,Ito,F.,&Takeo,H.(1993).Time-resolved high-resolution FTIR absorption-spectroscopy in a pulsed discharge.Chemical Physics Letters,206(1–4),73–76.10.Kawaguchi,K.,Hama,Y.,&Nishida,S.(2005).Time-resolved Fourier transform infraredspectroscopy:Application to pulsed discharges.Journal of Molecular Spectroscopy,232(1), 1–13.11.Civiš,S.,Matulková,I.,Cihelka,J.,Kawaguchi,K.,Buslov,E.Y.,&Chernov,V.E.(2010).Time-resolved Fourier-transform infrared emission spectroscopy of Au in the1800–4000-cm−1 region:Rydberg transitions.Physical Review A,81(1),012510.12.Civiš,S.,Matulková,I.,Cihelka,J.,Kubelík,P.,Kawaguchi,K.,&Chernov,V.E.(2010).Time-resolved Fourier-transform infrared emission spectroscopy of Ag in the(1300–3600)-cm−1region:Transitions involving f and g states and oscillator strengths.Physical Review A, 82(2),022502.147©The Editor(s)(if applicable)and The Author(s),under exclusivelicense to Springer Nature Switzerland AG2020S.Civišet al.,Atomic Emission Spectra of Neutral Noble Gasesin the Infrared Spectral Range,Springer Series in Chemical Physics122,https:///10.1007/978-3-030-47352-5148References 13.Kubelík,P.,Civiš,S.,Pastorek,A.,Zanozina,E.M.,Chernov,V.E.,Juha,L.,et al.(2015).FTIRlaboratory measurement of Ne I Rydberg states in1.43–14.3µm spectral range.Astronomy& Astrophysics,582,A12.14.Civiš,S.,Ferus,M.,Kubelík,P.,Jelínek,P.,&Chernov,V.E.(2012).Potassium spectra in the700–7000cm−1domain:Transitions involving f-,g-,and h-states.Astronomy&Astrophysics, 541,A125.15.Civiš,S.,Ferus,M.,Kubelík,P.,Jelínek,P.,Zanozina,E.M.,&Chernov,V.E.(2012).Na Ispectra in the1.4–14micron range:Transitions and oscillator strengths involving f-,g-,and h-states.Astronomy&Astrophysics,542,A35.16.Civiš,S.,Ferus,M.,Kubelík,P.,Jelínek,P.,Chernov,V.E.,&Knyazev,M.Y.(2012).Laserablation of CsI:Time-resolved Fourier-transform infrared spectra of atomic cesium in the 800–8000cm−1range.Journal of the Optical Society of America B,29(5),1112–1118. 17.Civiš,S.,Ferus,M.,Kubelík,P.,Chernov,V.E.,&Zanozina,E.M.(2012).Li I spectra inthe4.65–8.33micron range:high-L states and oscillator strengths.Astronomy&Astrophysics, 545,A61.18.Civiš,S.,Ferus,M.,Kubelík,P.,Chernov,V.E.,&Zanozina,E.M.(2012).Fourier transforminfrared emission spectra of atomic rubidium:g-and h-states.Journal of Physics B,45(17), 175002.19.Civiš,S.,Ferus,M.,Chernov,V.E.,&Zanozina,E.M.(2013).Infrared transitions and oscillatorstrengths of Ca and Mg.Astronomy&Astrophysics,554,A24.20.Civiš,S.,&Chernov,V.(2011).Time-resolved Fourier transform infrared emission spec-troscopy:Application to pulsed discharges and laser ablation.In G.Nikolic(Ed.),Fourier transforms.Rijeka:IntechOpen.https:///10.5772/15739.21.Rothman,L.,Gordon,I.,Barbe,A.,Benner,D.C.,Bernath,P.,Birk,M.,et al.(2009).TheHITRAN2008molecular spectroscopic database.Journal of Quantitative Spectroscopy and Radiative Transfer,110(9–10),533–572.22.Norton,R.H.,&Beer,R.(1976).New apodizing functions for Fourier spectrometry.Journalof the Optical Society of America,66,259–264.23.Mertz,L.(1965).Transformations in Optics.New York:Wiley.24.OPUS spectroscopic software.Reference manual.Version5(2004).25.Brault,J.W.(1987).High precision Fourier transform spectrometry:The critical role of phasecorrections.Microchimica Acta,93(1),215–227.26.Johnson,W.R.,Safronova,U.I.,Derevianko,A.,&Safronova,M.S.(2008).Relativisticmany-body calculation of energies,lifetimes,hyperfine constants,and polarizabilities in7Li.Physical Review A,77,022510.27.Seaton,M.J.(1983).Quantum defect theory.Reports on Progress in Physics,46(2),167–257.28.Jungen,C.(Ed.).(1996).Molecular applications of quantum defect theory.New York:Taylor&Francis.29.Civiš,S.,Matulková,I.,Cihelka,J.,Kubelík,P.,Kawaguchi,K.,&Chernov,V.E.(2011).Time-resolved FTIR emission spectroscopy of Cu in the1800–3800cm−1region:Transitions involving f and g states and oscillator strengths.Journal of Physics B,44(2),025002.30.Civiš,S.,Matulková,I.,Cihelka,J.,Kubelík,P.,Kawaguchi,K.,&Chernov,V.E.(2011).Low-excited f-,g-and h-states in Au,Ag and Cu observed by Fourier-transform infrared spectroscopy in the1000–7500cm−1region.Journal of Physics B,44(10),105002.31.Civiš,S.,Kubelík,P.,Jelínek,P.,Chernov,V.E.,&Knyazev,M.Y.(2011).Atomic cesium6hstates observed by time-resolved FTIR spectroscopy.Journal of Physics B,44(22),225006.32.Civiš,S.,Ferus,M.,Chernov,V.E.,Zanozina,E.M.,&Juha,L.(2013).Time-resolved Fouriertransform infrared spectra of Sr:h-,g-levels and oscillator strengths.Journal of Quantitative Spectroscopy and Radiative Transfer,129,324–332.33.Civiš,S.,Ferus,M.,Chernov,V.E.,Zanozina,E.M.,&Juha,L.(2014).Zn I spectra in the1300–6500cm−1range.Journal of Quantitative Spectroscopy and Radiative Transfer,134, 64–73.34.Civiš,S.,Kubelík,P.,Ferus,M.,Chernov,V.E.,Zanozina,E.M.,&Juha,L.(2014).Laserablation of an indium target:Time-resolved Fourier-transform infrared spectra of In I in the 700–7700cm−1range.Journal of Analytical Atomic Spectrometry,29,2275–2283.References149 35.Kubelík,P.,Zanozina,E.M.,Pastorek,A.,Ferus,M.,Juha,L.,Chernov,V.E.,et al.(2016).Argon FTIR spectra between800and2000cm−1:h-and i-levels and transition probabilities.Journal of Quantitative Spectroscopy and Radiative Transfer,182,337–345.36.Zanozina,E.M.,Naskidashvili,A.V.,Chernov,V.E.,Civiš,S.,Kubelík,P.,Ferus,M.,et al.(2016).The argon spectrum in the range of1200–2000cm−1.Optics and Spectroscopy(USSR), 121(5),655–664.37.Kramida,A.E.(2011).The program LOPT for least-squares optimization of energy levels.Computer Physics Communications,182(2),419–434.38.Humphreys,C.,&Kostkowski,H.(1952).Infrared spectra of noble gases(12000to19000A).Journal of Research of the National Bureau of Standards,49(2),73–84.39.Martin,W.(1960).Energy levels and spectrum of neutral helium(4He I).Journal of Researchof the National Bureau of Standards,64(1),19–28.40.Outred,M.(1978).Tables of atomic spectral lines for the10000a to40000a region.Journalof Physical and Chemical Reference Data,7(1),1–262.41.Nagai,K.,Tanaka,K.,&Hirota,E.(1982).Observation offine-structure transitions of thehelium atom by infrared diode laser spectroscopy.Journal of Physics B,15,341–345.42.Kono,A.(1987).Infrared diode-laser measurements of some atomic helium(4He I is nl)fine-structure transitions-comment.Journal of the Optical Society of America B,4(3),430.43.Lumsden,S.L.,Puxley,P.J.,&Hoare,M.G.(2001).Near-infrared spectra of compact planetarynebulae.Monthly Notices of the Royal Astronomical Society,328(2),419–441.44.Drake,G.(2006).High precision calculations for helium(pp.199–219).New York,NY:Springer.45.Civiš,S.,Kubát,P.,Nishida,S.,&Kawaguchi,K.(2006).Time-resolved Fourier transforminfrared emission spectroscopy of H+3molecular ion.Chemical Physics Letters,418(4–6), 448–453.46.Morillon,C.(1972).Etude des spectres d’émission atomique du néon et du xénon entre3.5et5.5µmàl’aide d’un spectromètreàgrilles.Spectrochimica Acta Part B,27(12),527–536. 47.Sansonetti,C.J.,Blackwell,M.M.,&Saloman,E.B.(2004).High-resolution observations ofthe infrared spectrum of neutral neon.Journal of Research of the National Institute of Standards and Technology,109(3),371–389.48.Kubelik,P.,Zanozina,E.M.,Pastorek,A.,Ferus,M.,Juha,L.,Chernov,V.E.,et al.(2016).Argon FTIR spectra between800and2000cm−1:h-and i-levels and transition probabilities.Journal of Quantitative Spectroscopy and Radiative Transfer,182,337–345.49.Whaling,W.,Anderson,W.H.C.,Carle,M.T.,Brault,J.W.,&Zarem,H.A.(2002).ArgonI lines produced in a hollow cathode source,332nm to5865nm.Journal of Research of theNational Institute of Standards and Technology,107,149–169.50.Engleman,R,Jr.,Hinkle,K.H.,&Wallace,L.(2003).The near-infrared spectrum of a Th/Arhollow cathode lamp.Journal of Quantitative Spectroscopy and Radiative Transfer,78(1), 1–30.51.Humphreys,C.J.,Paul,E.,&Adams,Jr.and K.B.(1961).Naval ordnance lab.Quarterlyreport:Foundational research projects.NAVWEPS Report,7205,25–52.52.Faust,W.L.,McFarlane,R.A.,Patel,C.K.N.,&Garrett,C.G.B.(1964).Noble gas opticalmaser lines at wavelengths between2and35µm.Physical Review,133,A1476–A1486. 53.Andrade,O.,Gallardo,M.,&Bockasten,K.(1967).High-gain laser lines in noble gases.Applied Physics Letters,11(3),99–100.54.Hernang,B.(1967).The spectrum of krypton,Kr I,in the extraphotographic infrared.Ark.Fys.(Stockholm),33(5),471–480.55.Humphreys,C.J.,Paul,E.,Cowan,R.D.,&Andrew,K.L.(1967).Spectra of the noble gasesin the4-µregion.Journal of the Optical Society of America,57(7),855–864.56.Mishra,A.,Kshirsagar,R.,Bellary,V.,&Balasubramanian,T.(2000).Identification of newtransitions in thefirst spectra of neon,krypton and xenon in the near infrared by Fourier transform spectroscopy.Journal of Quantitative Spectroscopy and Radiative Transfer,67(1), 1–7.150References 57.Sansonetti,C.J.,&Greene,M.B.(2007).Infrared spectrum and revised energy levels forneutral krypton.Physica Scripta,75(5),577.58.Hepner,G.(1961).Contributionàl étude de l émission infrarouge de spectres atomiques etmoléculaires dans le domaine spectral1-3µ-Applicationàl élargissement des raies de la série de paschen de l atome d hydrogène.Annals of Physics,6(5–6),735–788.59.Morillon,C.(1972).Study on atomic emission-spectra of neon and xenon between3.5and5.5millimicrons using grid spectrometer.Spectrochimica Acta,Part B,B27(12),527.60.Humphreys,C.J.(1973).First spectra of neon,argon,and xenon136in the1.2–4.0µm region.Journal of Physical and Chemical Reference Data,2(3),519–530.61.Sittner,W.R.,&Peck,E.R.(1949).The spectra of argon,krypton,and xenon between1.2and2.2micron.Journal of the Optical Society of America,39(6),474–477.。
7The Spectral Analysis of Random Signals Summary.When one calculates the DFT of a sequence of measurements of a random signal,onefinds that the values of the elements of the DFT do not tend to“settle down”no matter how long a sequence one measures.In this chapter, we present a brief overview of the difficulties inherent in analyzing the spectra of random signals,and we give a quick survey of a solution to the problem—the method of averaged periodograms.Keywords.random signals,method of averaged periodograms,power spectral den-sity,spectral estimation.7.1The ProblemSuppose that one has N samples of a random signal1,X k,k=0,...,N−1,and suppose that the samples are independent and identically distributed(IID). Additionally,assume that the random signal is zero-mean—that E(X k)=0. The expected value of an element of the DFT of the sequence,a m,isE(a m)=EN−1k=0e−2πjkm/N X k=0.Because the signal is zero-mean,so are all of its Fourier coefficients.(All this really means is that the phases of the a m are random,and the statistical average of such a m is zero.)On the other hand,the power at a given frequency is(up to a constant of proportionality)|a m|2.The expected value of the power at a given frequency 1In this chapter,capital letters represent random variables,and lowercase letters represent elements of the DFT of a random variable.As usual,the index k is used for samples and the index m for the elements of the DFT.In order to minimize confusion,we do not use the same letter for the elements of the sequence and for the elements of its DFT.587The Spectral Analysis of Random Signalsis E(|a m|2)and is non-negative.If one measures the value of|a m|2for some set of measurements,one is measuring the value of a random variable whose expected value is equal to the item of interest.One would expect that the larger N was,the more certainly one would be able to say that the measured value of|a m|2is near the theoretical expected value.One would be mistaken.To see why,consider a0.We know thata0=X0+···+X N−1.Assuming that the X k are real,wefind that|a0|2=N−1n=0N−1k=0X n X k=N−1n=0X2k+N−1n=0N−1,k=nk=0X n X k.Because the X k are independent,zero-mean random variables,we know that if n=k,then E(X n X k)=0.Thus,we see that the expected value of|a0|2isE(|a0|2)=NE(X2k).(7.1) We would like to examine the variance of|a0|2.First,consider E(|a0|4). Wefind thatE(|a0|4)=NE(X4i)+3N(N−1)E2(X2i).(See Exercise5for a proof of this result.)Thus,the variance of the measure-ment isE(|a0|4)−E2(|a0|2)=NE(X4i)+2N2E2(X2i)−3NE2(X2i)=Nσ2X2+2(N2−N)E2(X2i).Clearly,the variance of|a0|2is O(N2),and the standard deviation of|a0|2is O(N).That is,the standard deviation is of the same order as the measure-ment.This shows that taking larger values of N—taking more measurements—does not do much to reduce the uncertainty in our measurement of|a0|2.In fact,this problem exists for all the a m,and it is also a problem when the measured values,X k,are not IID random variables.7.2The SolutionWe have seen that the standard deviation of our measurement is of the same order as the expected value of the measurement.Suppose that rather than taking one long measurement,one takes many smaller measurements.If the measurements are independent and one then averages the measurements,then the variance of the average will decrease with the number of measurements while the expected value will remain the same.Given a sequence of samples of a random signal,{X0,...,X N−1},define the periodograms,P m,associated with the sequence by7.3Warm-up Experiment59P m≡1NN−1k=0e−2πjkm/N X k2,m=0,...,N−1.The value of the periodogram is the square of the absolute value of the m th element of the DFT of the sequence divided by the number of elements in the sequence under consideration.The division by N removes the dependence that the size of the elements of the DFT would otherwise have on N—a dependence that is seen clearly in(7.1).The solution to the problem of the non-decreasing variance of the estimates is to average many estimates of the same variable.In our case,it is convenient to average measurements of P m,and this technique is known as the method of averaged periodograms.Consider the MATLAB r program of Figure7.1.In the program,MAT-LAB takes a set of212uncorrelated random numbers that are uniformly dis-tributed over(−1/2,1/2),and estimates the power spectral density of the “signal”by making use of the method of averaged periodograms.The output of the calculations is given in Figure7.2.Note that the more sets the data were split into,the less“noisy”the spectrum looks.Note too that the number of elements in the spectrum decreases as we break up our data into smaller sets.This happens because the number of points in the DFT decreases as the number of points in the individual datasets decreases.It is easy to see what value the measurements ought to be approaching.As the samples are uncorrelated,their spectrum ought to be uniform.From the fact that the MATLAB-generated measurements are uniformly distributed over(−1/2,1/2),it easy to see thatE(X2k)=1/2−1/2α2dα=α331/2−1/2=112=0.083.Considering(7.1)and the definition of the periodogram,it is clear that the value of the averages of the0th periodograms,P0,ought to be tending to1/12. Considering Figure7.2,we see that this is indeed what is happening—and the more sets the data are split into,the more clearly the value is visible.As the power should be uniformly distributed among the frequencies,all the averages should be tending to this value—and this too is seen in thefigure.7.3Warm-up ExperimentMATLAB has a command that calculates the average of many measurements of the square of the coefficients of the DFT.The command is called psd(for p ower s pectral d ensity).(See[7]for more information about the power spectral density.)The format of the psd command is psd(X,NFFT,Fs,WINDOW)(but note that in MATLAB7.4this command is considered obsolete).Here,X is the data whose PSD one would like tofind,NFFT is the number of points in each607The Spectral Analysis of Random Signals%A simple program for examining the PSD of a set of%uncorrelated numbers.N=2^12;%The next command generates N samples of an uncorrelated random %variable that is uniformly distributed on(0,1).x=rand([1N]);%The next command makes the‘‘random variable’’zero-mean.x=x-mean(x);%The next commands estimate the PSD by simply using the FFT.y0=fft(x);z0=abs(y0).^2/N;%The next commands break the data into two sets and averages the %periodograms.y11=fft(x(1:N/2));y12=fft(x(N/2+1:N));z1=((abs(y11).^2/(N/2))+(abs(y12).^2/(N/2)))/2;%The next commands break the data into four sets and averages the %periodograms.y21=fft(x(1:N/4));y22=fft(x(N/4+1:N/2));y23=fft(x(N/2+1:3*N/4));y24=fft(x(3*N/4+1:N));z2=(abs(y21).^2/(N/4))+(abs(y22).^2/(N/4));z2=z2+(abs(y23).^2/(N/4))+(abs(y24).^2/(N/4));z2=z2/4;%The next commands break the data into eight sets and averages the %periodograms.y31=fft(x(1:N/8));y32=fft(x(N/8+1:N/4));y33=fft(x(N/4+1:3*N/8));y34=fft(x(3*N/8+1:N/2));y35=fft(x(N/2+1:5*N/8));y36=fft(x(5*N/8+1:3*N/4));y37=fft(x(3*N/4+1:7*N/8));y38=fft(x(7*N/8+1:N));z3=(abs(y31).^2/(N/8))+(abs(y32).^2/(N/8));z3=z3+(abs(y33).^2/(N/8))+(abs(y34).^2/(N/8));z3=z3+(abs(y35).^2/(N/8))+(abs(y36).^2/(N/8));z3=z3+(abs(y37).^2/(N/8))+(abs(y38).^2/(N/8));z3=z3/8;Fig.7.1.The MATLAB program7.4The Experiment61%The next commands generate the program’s output.subplot(4,1,1)plot(z0)title(’One Set’)subplot(4,1,2)plot(z1)title(’Two Sets’)subplot(4,1,3)plot(z2)title(’Four Sets’)subplot(4,1,4)plot(z3)title(’Eight Sets’)print-deps avg_per.epsFig.7.1.The MATLAB program(continued)FFT,Fs is the sampling frequency(and is used to normalize the frequency axis of the plot that is drawn),and WINDOW is the type of window to use.If WINDOW is a number,then a Hanning window of that length is e the MATLAB help command for more details about the psd command.Use the MATLAB rand command to generate216random numbers.In order to remove the large DC component from the random numbers,subtract the average value of the numbers generated from each of the numbers gener-ated.Calculate the PSD of the sequence using various values of NFFT.What differences do you notice?What similarities are there?7.4The ExperimentNote that as two ADuC841boards are used in this experiment,it may be necessary to work in larger groups than usual.Write a program to upload samples from the ADuC841and calculate their PSD.You may make use of the MATLAB psd command and the program you wrote for the experiment in Chapter4.This takes care of half of the system.For the other half of the system,make use of the noise generator imple-mented in Chapter6.This generator will be your source of random noise and is most of the second half of the system.Connect the output of the signal generator to the input of the system that uploads values to MATLAB.Look at the PSD produced by MATLAB.Why does it have such a large DC component?Avoid the DC component by not plotting thefirst few frequencies of the PSD.Now what sort of graph do you get?Does this agree with what you expect to see from white noise?Finally,connect a simple RC low-passfilter from the DAC of the signal generator to ground,and connect thefilter’s output to the A/D of the board627The Spectral Analysis of Random SignalsFig.7.2.The output of the MATLAB program when examining several different estimates of the spectrumthat uploads data to MATLAB.Observe the PSD of the output of thefilter. Does it agree with what one expects?Please explain carefully.Note that you may need to upload more than512samples to MATLAB so as to be able to average more measurements and have less variability in the measured PSD.Estimate the PSD using32,64,and128elements per window. (That is,change the NFFT parameter of the pdf command.)What effect do these changes have on the PSD’s plot?7.5Exercises63 7.5Exercises1.What kind of noise does the MATLAB rand command produce?Howmight one go about producing true normally distributed noise?2.(This problem reviews material related to the PSD.)Suppose that onepasses white noise,N(t),whose PSD is S NN(f)=σ2N through afilter whose transfer function isH(f)=12πjfτ+1.Let the output of thefilter be denoted by Y(t).What is the PSD of the output,S Y Y(f)?What is the autocorrelation of the output,R Y Y(τ)? 3.(This problem reviews material related to the PSD.)Let H(f)be thefrequency response of a simple R-Lfilter in which the voltage input to thefilter,V in(t)=N(t),enters thefilter at one end of the resistor,the other end of the resistor is connected to an inductor,and the second side of the inductor is grounded.The output of thefilter,Y(t),is taken to be the voltage at the point at which the resistor and the inductor are joined.(See Figure7.3.)a)What is the frequency response of thefilter in terms of the resistor’sresistance,R,and the inductor’s inductance,L?b)What kind offilter is being implemented?c)What is the PSD of the output of thefilter,S Y Y(f),as a function ofthe PSD of the input to thefilter,S NN(f)?Fig.7.3.A simple R-Lfilter647The Spectral Analysis of Random Signalsing Simulink r ,simulate a system whose transfer function isH (s )=s s +s +10,000.Let the input to the system be band-limited white noise whose bandwidth is substantially larger than that of the fie a “To Workspace”block to send the output of the filter to e the PSD function to calcu-late the PSD of the output.Plot the PSD of the output against frequency.Show that the measured bandwidth of the output is in reasonable accord with what the theory predicts.(Remember that the PSD is proportional to the power at the given frequency,and not to the voltage.)5.Let the random variables X 0,...,X N −1be independent and zero-mean.Consider the product(X 0+···+X N −1)(X 0+···+X N −1)(X 0+···+X N −1)(X 0+···+X N −1).a)Show that the only terms in this product that are not zero-mean areof the form X 4k or X 2k X 2n ,n =k .b)Note that in expanding the product,each term of the form X 4k appears only once.c)Using combinatorial arguments,show that each term of the formX 2k X 2n appears 42times.d)Combine the above results to conclude that (as long as the samplesare real)E (|a 0|4)=NE (X 4k )+6N (N −1)2E 2(X 2k ).。


物 理 化 学 学 报Acta Phys. -Chim. Sin. 2024, 40 (1), 2303055 (1 of 9)Received: March 30, 2023; Revised: May 24, 2023; Accepted: May 25, 2023; Published online: June 5, 2023.*Correspondingauthors.Emails:******************(Y.K.);***************(X.S.);Tel.:+86-10-64448751(X.S.).The project was supported by the National Key R&D Program of China (2021YFA1502200), the National Natural Science Foundation of China (21935001, 22075013, 22179029), the Key Beijing Natural Science Foundation (Z210016), the S&T Program of Hebei (21344601D), the Fundamental Research Funds for the Central Universities.国家重点研发计划项目(2021YFA1502200), 国家自然科学基金项目(21935001, 22075013, 22179029), 北京市自然科学重点基金项目(Z210016), 河北省科技计划项目(21344601D)及中央高校基本科研业务费专项资金资助 © Editorial office of Acta Physico-Chimica Sinica[Article] doi: 10.3866/PKU.WHXB202303055 Tungsten-Doped NiFe-Layered Double Hydroxides as Efficient Oxygen Evolution CatalystsXinxuan Duan 1, Marshet Getaye Sendeku 2, Daoming Zhang 3, Daojin Zhou 1, Lijun Xu 4, Xueqing Gao 5, Aibing Chen 5, Yun Kuang 2,*, Xiaoming Sun 1,*1 State Key Laboratory of Chemical Resource Engineering, Beijing Advanced Innovation Center for Soft Matter Science and Engineering, Beijing University of Chemical Technology, Beijing 100029, China.2 Ocean Hydrogen Energy R&D Center, Research Institute of Tsinghua University in Shenzhen, Shenzhen 518071,Guangdong Province, China.3 China Institute of Nuclear Industry Strategy, Beijing 100048, China.4 Xinjiang Coal Mine Mechanical and Electrical Engineering Technology Research Center, Xinjiang Institute of Engineering, Urumchi 830023, China.5 College of Chemical and Pharmaceutical Engineering, Hebei University of Science and Technology, Shijiazhuang 050018, China.Abstract: Electrochemical water splitting proves critical tosustainable and clean hydrogen fuel production. However, the anodicwater oxidation reaction—the major half-reaction in water splitting—has turned into a bottleneck due to the high energy barrier of thecomplex and sluggish four-electron transfer process. Nickel-ironlayered double hydroxides (NiFe-LDHs) are regarded as promisingnon-noble metal electrocatalysts for oxygen evolution reaction (OER)catalysis in alkaline conditions. However, the electrocatalytic activityof NiFe-LDH requires improvement because of poor conductivity, asmall number of exposed active sites, and weak adsorption of intermediates. As such, tremendous effort has been made to enhance the activity of NiFe-LDH, including introducing defects, doping, exfoliation to obtain single-layer structures, and constructing arrayed structures. In this study, researchers controllably doped NiFe-LDH with tungsten using a simple one-step alcohothermal method to afford nickel-iron-tungsten layered double hydroxides (NiFeW-LDHs). X-ray powder diffraction analysis was used to investigate the structure of NiFeW-LDH. The analysis revealed the presence of the primary diffraction peak corresponding to the perfectly hexagonal-phased NiFe-LDH, with no additional diffraction peaks observed, thereby ruling out the formation of tungsten-based nanoparticles. Furthermore, scanning electron microscopy (SEM) showed that the NiFeW-LDH nanosheets were approximately 500 nm in size and had a flower-like structure that consisted of interconnected nanosheets with smooth surfaces. Additionally, it was observed that NiFeW-LDH had a uniform distribution of Ni, Fe, and W throughout the nanosheets. X-ray photoelectron spectra (XPS) revealed the surface electronic structure of the NiFeW-LDH catalyst. It was determined that the oxidation state of W in NiFeW-LDH was +6 and that the XPS signal of Fe in NiFeW-LDH shifted to a higher oxidation state compared to NiFe-LDH. These results suggest electron redistribution between Fe and W. Simultaneously, the peak area of surface-adsorbed OH increased significantly after W doping, suggesting enhanced OH adsorption on the surface of NiFeW-LDH. Furthermore, density functional theory (DFT) calculations indicated that W(VI) facilitates the adsorption of H 2O and O *-intermediates and enhances the activity of Fe sites, which aligns with experimental results. The novel NiFeW-LDH catalyst displayed a low overpotential of 199 and 237 mV at 10 and 100 mA ∙cm −2 in 1 mol ∙L −1KOH, outperforming most NiFe-based colloid catalysts. Furthermore, experimental物理化学学报 Acta Phys. -Chim. Sin.2024,40 (1), 2303055 (2 of 9)characterizations and DFT+U calculations suggest that W doping plays an important role through strong electronic interactions with Fe and facilitating the adsorption of important O-containing intermediates.Key Words: Oxygen evolution reaction; Layered double hydroxide; Tungsten doping; Electronic interaction;Electrocatalysis钨掺杂镍铁水滑石高效电催化析氧反应段欣漩1,Marshet Getaye Sendeku 2,张道明3,周道金1,徐立军4,高学庆5,陈爱兵5,邝允2,*,孙晓明1,*1北京化工大学,化工资源有效利用国家重点实验室,北京软物质科学与工程高精尖创新中心,北京 1000292清华大学深圳研究院,海洋氢能研发中心,广东深圳 5180713中核战略规划研究总院,北京 1000484新疆工程学院,新疆煤矿机电工程技术研究中心,乌鲁木齐 8300235河北科技大学化学与制药工程学院,石家庄 050018摘要:电解水对制备可持续和清洁的氢气能源至关重要。
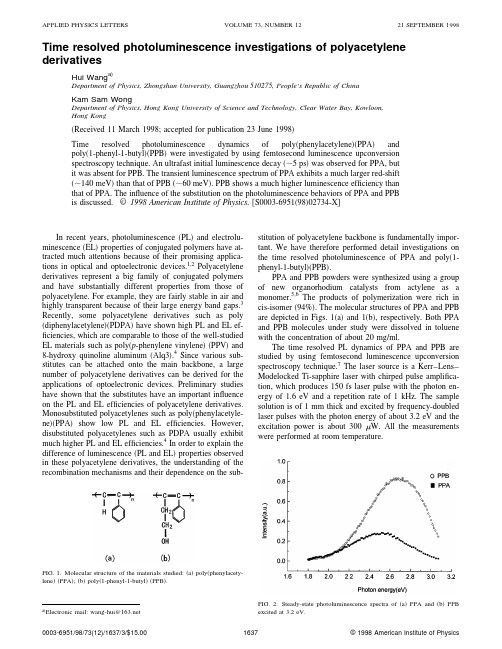
Time resolved photoluminescence investigations of polyacetylene derivativesHui Wang a)Department of Physics,Zhongshan University,Guangzhou510275,People’s Republic of ChinaKam Sam WongDepartment of Physics,Hong Kong University of Science and Technology,Clear Water Bay,Kowloon,Hong Kong͑Received11March1998;accepted for publication23June1998͒Time resolved photoluminescence dynamics of poly͑phenylacetylene͒͑PPA͒andpoly͑1-phenyl-1-butyl͒͑PPB͒were investigated by using femtosecond luminescence upconversionspectroscopy technique.An ultrafast initial luminescence decay͑ϳ5ps͒was observed for PPA,butit was absent for PPB.The transient luminescence spectrum of PPA exhibits a much larger red-shift ͑ϳ140meV͒than that of PPB͑ϳ60meV͒.PPB shows a much higher luminescence efficiency than that of PPA.The influence of the substitution on the photoluminescence behaviors of PPA and PPBis discussed.©1998American Institute of Physics.͓S0003-6951͑98͒02734-X͔In recent years,photoluminescence͑PL͒and electrolu-minescence͑EL͒properties of conjugated polymers have at-tracted much attentions because of their promising applica-tions in optical and optoelectronic devices.1,2Polyacetylenederivatives represent a big family of conjugated polymersand have substantially different properties from those ofpolyacetylene.For example,they are fairly stable in air andhighly transparent because of their large energy band gaps.3Recently,some polyacetylene derivatives such as poly ͑diphenylacetylene͒͑PDPA͒have shown high PL and EL ef-ficiencies,which are comparable to those of the well-studiedEL materials such as poly͑p-phenylene vinylene͒͑PPV͒and8-hydroxy quinoline aluminum͑Alq3͒.4Since various sub-stitutes can be attached onto the main backbone,a largenumber of polyacetylene derivatives can be derived for theapplications of optoelectronic devices.Preliminary studieshave shown that the substitutes have an important influenceon the PL and EL efficiencies of polyacetylene derivatives.Monosubstituted polyacetylenes such as poly͑phenylacetyle-ne͒͑PPA͒show low PL and EL efficiencies.However,disubstituted polyacetylenes such as PDPA usually exhibitmuch higher PL and EL efficiencies.4In order to explain thedifference of luminescence͑PL and EL͒properties observedin these polyacetylene derivatives,the understanding of therecombination mechanisms and their dependence on the sub-stitution of polyacetylene backbone is fundamentally impor-tant.We have therefore performed detail investigations on the time resolved photoluminescence of PPA and poly͑1-phenyl-1-butyl͒͑PPB͒.PPA and PPB powders were synthesized using a group of new organorhodium catalysts from actylene as a monomer.5,6The products of polymerization were rich in cis-isomer͑94%͒.The molecular structures of PPA and PPB are depicted in Figs.1͑a͒and1͑b͒,respectively.Both PPA and PPB molecules under study were dissolved in toluene with the concentration of about20mg/ml.The time resolved PL dynamics of PPA and PPB are studied by using femtosecond luminescence upconversion spectroscopy technique.7The laser source is a Kerr–Lens–Modelocked Ti-sapphire laser with chirped pulse amplifica-tion,which produces150fs laser pulse with the photon en-ergy of1.6eV and a repetition rate of1kHz.The sample solution is of1mm thick and excited by frequency-doubled laser pulses with the photon energy of about3.2eV and the excitation power is about300W.All the measurements were performed at roomtemperature.FIG.1.Molecular structure of the materials studied:͑a͒poly͑phenylacety-lene͒͑PPA͒;͑b͒poly͑1-phenyl-1-butyl͒͑PPB͒.a͒Electronic mail:wang-hui@FIG.2.Steady-state photoluminescence spectra of͑a͒PPA and͑b͒PPBexcited at3.2eV.APPLIED PHYSICS LETTERS VOLUME73,NUMBER1221SEPTEMBER199816370003-6951/98/73(12)/1637/3/$15.00©1998American Institute of PhysicsFigure 2shows the steady-state ͑PL ͒spectra of PPA and PPB excited by the photon energy of 3.2eV,which is coin-cident with the excitation photon energy in the transient ex-periments.PPB shows blue-green light emission with a peak around 2.7eV,which is much efficient than that of PPA at 2.5eV.The color change from blue-green to green is due to the decrease of the length of butyl side chain.Similar results have been reported in Ref.8.Time resolved PL spectra of PPA and PPB recorded at different time delays are presented in Figs.3͑a ͒and 3͑b ͒,respectively.Both PPA and PPB show the instantaneous lu-minescence,reflecting the ultrafast vibronic relaxation on a time scale much shorter than the time resolution of the setup.The transient spectra of PPA and PPB evolve rapidly to the shapes similar to the steady-state luminescence in the first few picoseconds,accompanying significant red-shifts of the transient luminescence spectra.For comparison,the peak po-sitions of the transient luminescence spectra versus time for both PPA and PPB are plotted as shown in Fig.4.The red-shifts ͓͗E ͘(t )Ϫ͗E 0͔͘of about 140and 60meV are mea-sured within the first 100ps for PPA and PPB,respectively.Figures 5͑a ͒and 5͑b ͒show the transient behaviors of the PL intensity at three spectral positions for PPA and PPB,respectively.The PL decay of PPA consists of two compo-nents,an initial ultrafast decay and a following slow relax-ation.By using a biexponential response function,the time constants of the initial ultrafast decay are fit to 5,5.7,and 6.7ps for the photon energy of 2.7,2.5,and 2.3eV,respectively,which indicates the dependence of the initial PL decay on the photon energy.The following slow decay processes for the three photon energies ͑2.7,2.5,and 2.3eV ͒are almost the same of about 180ps.However,the PL decay of PPB exhib-its a single exponential process with time constants of 112,125,and 210ps for the photon energy of 2.8,2.7,and 2.5eV,respectively.The dependence of the decay times on pho-ton energy for PPB becomes significant in the slow decay process.The difference of the PL behaviors observed in PPA and PPB can be explained by their different substitutes attached on the main backbones.With double substitutions of phenyl and butyl,PPB molecules possess longer and more bulky side chains than that of PPA molecules with single phenyl substituent.As a result,the interchain transport of the excited states to the longer-conjugation-length segments 9is facili-tated between PPA molecules.The interchain migration,oc-curring following photoexcitation and prior to emission,is proposed as a nonradiative process,which is extremely rapid and can reduce the luminescence effectively.4,10This results in an ultrafast initial relaxation and a large red shift of tran-sient PL spectrum for PPA.Similar results have been ob-served in other EL polymers.2However,the longerdistanceFIG.3.Time resolved photoluminescence spectra of ͑a ͒PPA and ͑b ͒PPB after excitation with 150fs laser pulses at 3.2eV.FIG.4.Energetic positions of the main emission bands in ͑a ͒PPA and ͑b ͒PPB vs delay time.between adjacent PPB molecule main chains hampers the interchain transport and confines the relaxation process on the intrachain,4,8which lead to the absence of an initial ul-trafast PL decay in PPB.The red-shift of transient PL spec-trum and the dependence of decay time on photon energyobserved in PPB are probably due to chain distortion towards a more planar conformation following photoexcitation.3The bulky side groups attached on PPB molecular main chains may have a tendency to decrease the torsion angle of the repeat unit surface on the main chain,4which therefore lead to a small red-shift of the spectrum and slow PL decay.Con-sequently higher PL efficiency was observed for PPB.In conclusion,femtosecond PL studies of PPA and PPB demonstrate that side groups of substituted polyactylene molecule play an important role in the transient PL behavior.PPB molecules have longer and more bulky side groups than PPA molecule.As a result,PPB exhibits a much slower PL decay and a higher PL efficiency.Since EL and PL observed in conjugated polymers originate from the same recombina-tion processes,2,4we believe that our results are of particular interest for the design of new EL devices.The authors gratefully acknowledge technical assistance during the experiments by Dr.H.Wang and providing PPA and PPB samples by Dr.B.Z.Tang.They also thank Pro-fessor W.Z.Lin for careful reading of the manuscript and helpful suggestions.1R.Kersting,V.Lemmer,R.F.Mahrt,K.Leo,H.Kurz,H.Bassler,and E.O.Gobel,Phys.Rev.Lett.70,3820͑1993͒.2U.Lemmer,R.F.Mahrt,Y.Wada,A.Greiner,H.Bassler,and E.O.Gobel,Appl.Phys.Lett.62,2827͑1993͒.3uchlan,S.Etemad,T.C.Chung,A.J.Heeger,and A.G.Macdi-armid,Phys.Rev.B 24,3701͑1981͒.4R.Sun,T.Masuda,and T.Kobayashi,Jpn.J.Appl.Phys.,Part 235,L1434͑1996͒.5P.W.Hong,Thesis,Hong Kong University of Science and Technology,Thesis CHEM,C.2͑1996͒.6B.Z.Tang,W.H.Poon,S.M.Leung,W.H.Leung,and H.Peng,Mac-romolecules 38,1573͑1996͒.7J.Shah,T.C.Damen,B.Deveud,and Dominigue Block,Appl.Phys.Lett.50,1307͑1987͒.8R.Sun,T.Masuda,and T.Kobayashi,Jpn.J.Appl.Phys.,Part 235,L1673͑1996͒.9H.S.Woo,S.C.Graham,D.A.Halliday,D.D.C.Bradley,R.H.Friend,P.L.Burn,and A.B.Holmes,Phys.Rev.B 46,7379͑1992͒.10R.H.Friend,D.D.C.Bradley,and P.D.Townsend,J.Phys.D 20,1376͑1987͒.FIG.5.Time resolved photoluminescence decay of ͑a ͒PPA and ͑b ͒PPB,detected at different luminescence energies.。

第40卷第2期2021年2月硅㊀酸㊀盐㊀通㊀报BULLETIN OF THE CHINESE CERAMIC SOCIETY Vol.40㊀No.2February,2021临界点干燥仪制备的Pt-P25的电催化析氢反应性能探究邹函君,常秋翔,杨文达,张㊀斌,公祥南,王桂文,周㊀楷(重庆大学分析测试中心,重庆㊀400030)摘要:在各种制氢工艺中,电解水是一种获得氢能源的重要途径,Pt 是析氢反应(HER)中最理想的催化剂㊂由于Pt 基材料的稀缺性和高成本限制了其大规模应用,因此迫切需要开发一种低含量㊁高效的铂催化剂㊂P25是一种晶格缺陷密度很高的混晶型TiO 2,载流子浓度大,具有良好的催化效果㊂本文采用临界点干燥仪,以商业化混晶TiO 2(P25)为基底,制备了Pt 负载的TiO 2(Pt-P25)催化剂,运用XRD㊁TEM 和XPS 分析了催化剂的结构和形貌,探索了不同临界点干燥条件下Pt-P25的电催化HER 性能㊂结果表明,临界点干燥法成功制备出了Pt 原子簇负载的TiO 2,且在一定的条件下,当二氧化碳进气速率为慢速㊁交换速率为7㊁出气加热速率为中速时,Pt-P25的电催化HER 性能最好㊂关键词:二氧化钛;铂催化剂;电催化;析氢反应;临界点干燥中图分类号:O646.51㊀㊀文献标志码:A ㊀㊀文章编号:1001-1625(2021)02-0658-06Research on Electrocatalytic Hydrogen Evolution Reaction Performance of Pt-P25Prepared by Critical Point DrierZOU Hanjun ,CHANG Qiuxiang ,YANG Wenda ,ZHANG Bin ,GONG Xiangnan ,WANG Guiwen ,ZHOU Kai(Analytical and Testing Center,Chongqing University,Chongqing 400030,China)Abstract :Among various hydrogen production processes,electrochemical water splitting is an important way to obtain hydrogen energy,and Pt is the most ideal catalyst for the hydrogen evolution reaction (HER).Nevertheless,large-scale application of Pt-based materials in HER are limited due to their scarcity and high cost,there is an urgent need to develop a low content and efficient platinum catalyst.P25is a kind of hybrid titanium dioxide with high lattice defect density and high current carrier concentration,which has good catalytic mercially available mixed crystal TiO 2(P25)as catalysts supported Pt (Pt-P25)were prepared by a critical point drier,the structure and morphology of catalysts were analyzed by XRD㊁TEM and XPS,and the electro-catalytic HER performance of Pt-P25were explored in different critical point drying conditions.The results show that TiO 2supported Pt atom cluster is successfully prepared by the critical pointdrying method.Under certain conditions,electro-catalytic HER of Pt-P25is the best when carbon dioxide intake rate is slow,exchange rate is 7,and outlet gas heating rate is med.Key words :titanium dioxide;platinum catalyst;electrocatalysis;hydrogen evolution reaction;critical point drying 收稿日期:2020-09-16;修订日期:2020-12-08基金项目:国家自然科学基金青年项目(11904039)作者简介:邹函君(1989 ),女,工程师㊂主要从事TiO 2及碳材料的电催化性能研究㊂E-mail:zouhanjun17@ 0㊀引㊀言传统化石能源不断被开采消耗,导致能源和环境问题日益严重,因此寻找新型的清洁能源以及能源转换技术,成为世界各国发展的重中之重㊂氢气的燃烧产物仅为水,具有高热值㊁无污染㊁可再生的特点,被认为是21世纪有前途的能源之一[1-3]㊂在各种制氢工艺中,电催化分解水制氢是一种获得氢能源的重要途径,其关键步骤是析氢反应(HER),而此过程需要有效的电催化剂来降低反应的超电势并加速反应进程[4-7]㊂目㊀第2期邹函君等:临界点干燥仪制备的Pt-P25的电催化析氢反应性能探究659前,Pt基材料是HER中最有效的催化剂,其中具有最小超电势的铂碳(Pt/C)被公认是电解水析氢最高效㊁最典型的电化学催化剂[8],但是Pt的地壳储量低和价格高昂等特点严重限制了其大规模的商业应用[9-11]㊂因此,开发低Pt含量的新型催化剂具有重大的实际意义,将金属单原子或原子簇负载在基底上用于电催化析氢是一种有效的途径[12]㊂近年来,二氧化钛因其较高的催化指向性㊁低毒性和优良的稳定性,被认为是良好的光电催化基底材料[13]㊂P25是由80%(质量分数)的锐钛矿和20%(质量分数)的金红石组成的混晶型二氧化钛,由于两种结构的混杂极大程度上增加了二氧化钛晶格内的缺陷密度,而电子空穴对数量的增加,使其捕获表面溶液组分的能力增强,因而其催化能力更强[14-15]㊂同时,Pt原子簇修饰二氧化钛催化材料开发前景广阔,但是传统的负载单原子或者原子簇的合成条件复杂㊁苛刻有时需要使用昂贵的设备,因此开发一种简便的合成Pt单原子或原子簇的方法具有重要的意义㊂临界点干燥法是利用液态二氧化碳和乙醇,在特定的温度和压力下,使样品表面在气态与液态之间转换时表面张力为零,该方法操作简便㊁干燥效率高,大大降低了普通干燥过程对样品表面的破坏[16-18]㊂基于此,本文以P25作为基底,采用临界点干燥仪制备Pt原子簇负载的TiO2(Pt-P25)电催化剂,通过X-射线衍射㊁透射电镜以及光电子能谱技术分析了负载Pt后,基底物相㊁形貌㊁成分的变化,探究在不同临界点干燥条件下对其电催化析氢性能的影响,得到最佳的干燥条件㊂1㊀实㊀验1.1㊀试㊀剂P25(纳米二氧化钛,平均粒径21nm),德国进口;六水合氯铂酸(H2PtCl6㊃6H2O,分析纯),上海阿拉丁生化科技有限公司;乙醇(C2H5OH,分析纯),成都科龙化工试剂厂;超纯水,实验室自制㊂1.2㊀催化剂的制备分别量取10mL的水和20mL的乙醇至50mL烧杯,移取质量分数为0.1%的Pt溶液,将1g的P25均匀分散在上述溶液中,60ħ搅拌2h㊂离心后,将溶质用滤纸包好,于临界点干燥仪器中干燥,固定临界点干燥条件:冷却温度为15ħ,循环次数为20次,加热温度为35ħ,出气速率为中速,改变不同干燥条件(CO2进气速率:快速㊁中速㊁慢速;CO2交换速率:1㊁3㊁5㊁7㊁10;CO2出气加热速率:快速㊁中速㊁慢速)㊂对上述不同干燥条件下的Pt-P25进行电催化性能测试,找出最佳的干燥条件㊂1.3㊀分析与测试使用美国赛默飞EM CPD300临界点干燥仪,在不同临界点干燥条件下制备Pt原子簇负载的TiO2(Pt-P25)电催化剂㊂使用荷兰帕纳科X Pert X射线衍射仪,分别对Pt-P25进行XRD分析㊂使用荷兰FEI Talos F200S场发射透射电子显微镜(TEM),对比P25和Pt-P25样品颗粒的微观形貌和元素分布㊂使用美国赛默飞ESCALAB250Xi X射线光电子能谱仪(XPS),分析P25和Pt-P25的成分组成㊂使用德国Zahner CIMPS-2光电化学谱仪,对不同Pt-P25临界点干燥条件下的电催化析氢测试㊂1.4㊀电极的制备将4mg催化剂粉末分散在含有800μL的超纯水㊁200μL的乙醇和20μL电解质溶液(质量分数为5%)的离心管中㊂超声处理30min,形成均匀的悬浮液㊂取10μL上述溶液滴加到5mm的玻碳工作电极表面,使其均匀分布在玻碳电极表面,自然冷干㊂1.5㊀电化学性能测试使用德国Zahner电化学工作站三电极的体系中进行电催化性能测试㊂分别以Ag/AgCl和碳棒为参比电极和对电极,玻碳电极作为工作电极,在0.5mol/L的H2SO4电解液中进行产氢性能的测试㊂线性扫描伏安法(LSV)测试范围为0~-1.0V,扫描速率为10mV/s,根据E(RHE)=E(Hg/HgO)+0.059㊃pH+0.197(pH=0)计算可逆氢电势㊂式中:E(RHE)为可逆氢电极电势;E(Hg/HgO)为汞/氧化汞电极的电势;pH为电解液的酸碱度㊂在整个测试过程中,电解池置于磁力搅拌器上,转速为300r/s㊂660㊀新型功能材料硅酸盐通报㊀㊀㊀㊀㊀㊀第40卷2㊀结果与讨论图1㊀P25和Pt-P25的XRD 谱Fig.1㊀XRD patterns of P25and Pt-P252.1㊀XRD 分析图1是催化剂的XRD 谱,从图中可知Pt 负载的P25的衍射峰位置和纯的P25衍射峰位置一一对应,均呈现出二氧化钛的锐钛矿相(JCPDS 84-1285)和金红石相(JCPDS 73-1765)混合晶相(P25)且没有出现Pt 基化合物的特征峰㊂说明Pt 的引入没有改变P25的晶体结构,且金属Pt 可能处于单分散状态㊂2.2㊀TEM 表征图2是催化剂的TEM 和HAADF-STEM 以及相应的元素EDX,可以得出在Pt 负载前后催化剂的形貌没有明显变化,Ti㊁O㊁Pt 分别均匀分布在P25和Pt-P25中,Pt 引入后对催化剂的形貌几乎没有影响㊂同时,图2(b)中没有观察到金属Pt 颗粒,说明Pt 在催化剂中以金属团簇或者单原子的形式存在,这与XRD的结果一致㊂图2㊀(a)P25的TEM 照片;(b)P25HAADF-STEM 照片及相应的(c)Ti 和(d)O 的EDX;(e)Pt-P25TEM 照片;(f)Pt-P25的HAADF-STEM 照片及相应的(g)Ti㊁(h)O 和(i)Pt 的EDX Fig.2㊀(a)TEM image of P25;(b)HAADF-STEM image and corresponding EDX-mapping of P25,which show distributions of (c)Ti,(d)O,respectively;(e)TEM image of P25;(f)HAADF-STEM image and corresponding EDX-mapping of Pt-P25,which show distributions of (g)Ti,(h)O,and (i)Pt respectively 2.3㊀XPS 分析采用XPS 分析了P25和Pt-P25的成分组成㊂图3分别是P25和Pt-P25的高分辨谱图分析,且Pt-P25元素构成中明显有Pt㊂图3(a)中的2个主峰458.6eV 和464.6eV 分别是Ti 2p 3/2和Ti 2p 1/2,证明了Ti 元素的存在;图3(b)中的主峰529.4eV 是O 1s,证明了O 元素的存在,其余的峰是O 1s 的卫星峰;图3(b)中的2个主峰73.1eV 和76.1eV 分别对应Pt 4f 7/2和Pt 4f 5/2,证明了Pt 元素的存在与文献中报道一致[19-20],即㊀第2期邹函君等:临界点干燥仪制备的Pt-P25的电催化析氢反应性能探究661通过临界点干燥的方法把Pt成功地合成到了P25中,与TEM的EDX分析相符合㊂图3㊀P25和Pt-P25的XPS高分辨谱图Fig.3㊀High resolution XPS spectra of P25and Pt-P252.4㊀Pt-P25的HER测试2.4.1㊀不同CO2进气速率固定干燥条件:冷却温度为15ħ,循环次数为20次,加热温度为35ħ,CO2交换速率为5,以及出气加热速率为中速,改变二氧化碳进气速率(CO2in Speed):快速(Fast)㊁中速(Med)㊁慢速(Slow)三个条件,得到不同进气速率下制备的HER性能的LSV如图4所示㊂可以看出在气体交换速率和出气加热速率一定的情况下,随着CO2进气速率的变慢,Pt-P25的HER性能逐渐增强,当速率为慢速时,Pt-P25的HER性能最强㊂图4㊀不同二氧化碳进气速率下的Pt-P25的极化曲线Fig.4㊀Polarization curves of Pt-P25with different CO2in speed图5㊀不同二氧化碳交换速率下的Pt-P25的HER性能Fig.5㊀Polarization curves of Pt-P25with different CO2exchange speed2.4.2㊀不同的CO2交换速率固定干燥条件:冷却温度为15ħ,循环次数为20次,加热温度为35ħ,CO2进气速率为慢速,以及出气加热速率为中速,改变气体交换速率:1,3,5,7,10,五个条件,得到不同CO2交换速率下制备的催化剂的HER性能LSV曲线如图5所示㊂可以看出在CO2进气速率和出气加热速率一定的情况下,随着气体交换速率的增大,Pt-P25的HER性能呈现先增强后减弱的趋势,当气体交换速率为7时,Pt-P25的HER性能最强㊂2.4.3㊀不同的出气加热速率固定干燥条件:冷却温度为15ħ,循环次数为20次,加热温度为35ħ,CO2进气速率为慢速,以及气体交换速率为7,改变出气加热速率:快速㊁中速㊁慢速,三个条件,得到不同出气加热速率下制备的催化剂的HER性能LSV曲线如图6所示㊂可以看出在气体进气速率和气体交换速率一定的情况下,随着出气加热速率的增大,Pt-P25的HER性能呈现先增强后减弱的趋势,即当出气加热速率为中速时,Pt-P25的HER性能最强㊂662㊀新型功能材料硅酸盐通报㊀㊀㊀㊀㊀㊀第40卷图6㊀不同出气加热速率下的Pt-P25的HER性能Fig.6㊀Polarization curves of Pt-P25with different gas out heat3㊀结㊀论(1)通过对比负载Pt原子簇前后的XRD和XPS可知,Pt成功负载到P25中,且以原子或原子簇的形式负载在TiO2表面而没有引起TiO2结构和表面化学态的变化㊂(2)通过TEM以及EDX分析可知,Pt原子簇的负载没有改变TiO2的形貌,且在Pt-P25表面没有看到Pt 颗粒,但是EDX中含有均匀分布的Pt,证明Pt是以原子或原子簇的形式分散在TiO2的表面㊂(3)利用临界点干燥法制备的Pt-P25催化剂,探索了不同干燥条件下催化剂的HER性能,在一定的条件下,得到最佳的干燥条件:二氧化碳进气速率为慢速,交换速率为7,出气加热速率为中速㊂参考文献[1]㊀ZOU X,ZHANG Y.Noble metal-free hydrogen evolution catalysts for water splitting[J].Chemical Society Reviews,2015,44(15):5148-5180.[2]㊀LI X,YU J Y,JIA J,et al.Confined distribution of platinum clusters on MoO2hexagonal nanosheets with oxygen vacancies as a high-efficiencyelectrocatalyst for hydrogen evolution reaction[J].Nano Energy,2019,62:127-135.[3]㊀NAM J H,JANG M J,JANG H Y,et al.Room-temperature sputtered electrocatalyst WSe2nanomaterials for hydrogen evolution reaction[J].Journal of Energy Chemistry,2020,47:107-111.[4]㊀刁金香,王伟涛,邱㊀雨.MoS2@CP纳米片制备及其电催化产氢性能的研究[J].硅酸盐通报,2020,39(3):957-961.DIAO J X,WANG W T,QIU Y.Preparation of MOS2@CP nanosheets andits application as electrocatalysts for efficient hydrogen evolution[J].Bulletin of the Chinese Ceramic Society,2020,39(3):957-961(in Chinese).[5]㊀于海峰,王㊀芳,冯㊀婷,等.Zn掺杂Co9S8纳米材料的制备及其在超级电容器和电催化氢中的应用[J].无机化学学报,2020,35(7):1318-1326.YU H F,WANG F,FENG T et al.Zn-doped Co9S8nanomaterials:preparation and application for supercapacitor and hydrogen evolution reaction of electrocatalysis[J].Chinese Journal of Inorganic Chemistry,2020,35(7):1318-1326(in Chinese).[6]㊀JUNG M,HART J N,BOENSCH D,et al.Hydrogen evolution via glycerol photoreforming over Cu-Pt nanoalloys on TiO2[J].Applied CatalysisA:General,2016,518:221-230.[7]㊀ZHANG H B,ZHANG P,QIU M,et al.Ultrasmall MoOx clusters as a novel cocatalyst for photocatalytic hydrogen evolution[J].AdvancedMaterials,2018,31(6):1804883.[8]㊀WABG M S,FU W Y,DU L,et al.Surface engineering by doping manganese into cobalt phosphide towards highly efficient bifunctional HERand OER electrocatalysis[J].Applied Surface Science,2020,515(15):146059.[9]㊀王㊀玥,朱㊀婧,黄德顺,等.Pd-NPs@alkyne-PVA/GO复合材料制备及其电催化析氢性能[J].工业催化,2020,28(7):56-62.WANG Y,ZHU Q,HUANG D S,et at.Preparation of Pd-NPs@alkyne-PVA/GO composite and its electrocatalytic hydrogen evolution reaction performance[J].Applied Chemical Industry,2020,28(7):56-62(in Chinese).[10]㊀DUKOVIC G,MERKLE M G,NELSON J H,et al.Photodeposition of Pt on colloidal CdS and CdSe/CdS semiconductor nanostructures[J].Advanced Materials,2008,20(22):4306-4311.[11]㊀ZHANG Z C,LIU G G,CUI X Y,et al.Crystal phase and architecture engineering of lotus-thalamus-shaped Pt-Ni anisotropic superstructures forhighly efficient electrochemical hydrogen evolution[J].Advanced Materials,2018,30(30):1801741.㊀第2期邹函君等:临界点干燥仪制备的Pt-P25的电催化析氢反应性能探究663 [12]㊀DU R,JIN W,HUBNER R,et al.Engineering multimetallic aerogels for pH-universal HER and ORR electrocatalysis[J].Advanced EnergyMaterials,2020,10(12):1903857.[13]㊀ZHANG J Q,ZHAO Y F,GUO X,et al.Single platinum atoms immobilized on an MXene as an efficient catalyst for the hydrogen evolutionreaction[J].Nature Catalysis,2018:985-992.[14]㊀LUA Z Y,ZHOU W C,HUO P W,et al.Performance of a novel TiO2photocatalyst based on the magnetic floating fly-ash cenospheres for thepurpose of treating waste by waste[J].Chemical Engineering Journal,2013:225,34-42.[15]㊀MA R,SUN J,HUI L D,et al.Exponentially self-promoted hydrogen evolution by uni-source photo-thermal synergism in concentratingphotocatalysis on co-catalyst-free P25TiO2[J].Journal of Catalysis,2020:392,165-174.[16]㊀苏㊀琨,张亚茹,陆㊀飞,等.铂修饰二氧化钛纳米片的制备及其光电催化析氢反应研究[J].无机材料学报,2019,34(11):1200-1204.SU K,ZHANG Y R,LU F,et al.Platinum decorated titanium Dioxide nanosheets for efficient photoelectrocatalytic hydrogen evolution reaction[J].Journal of Inorganic Materials,2019,34(11):1200-1204(in Chinese).[17]㊀刘永英,权玉萍,李㊀林,等.藓类植物扫描电镜观察材料的制备[J].实验室研究与探索,2016,35(2):52-54.LIU Y Y,QUAN Y P,LI L,et al.Sample Preparation for scanning electron microscope in moss[J].Research and Exporation in Laboratory, 2016,35(2):52-54(in Chinese).[18]㊀陆㊀彦,祁㊀琰,张晓敏,等.高水分㊁富含淀粉植物组织的扫描电镜制备技术优化[J].植物科学学报,2018,36(1):119-126.LU Y,QI Y,ZHANG X M,et al.Optimization of water-rich starch sample preparation methods for scanning electron microscopy[J].Plant Science Journal,2018,36(1):119-126(in Chinese).[19]㊀SUN T,BAKE K D,CRADDOCK P R,et al.Acid demineralization with pyrite removal and critical point drying for kerogen microstructuralanalysis[J].Fuel,2019,253:266-272.[20]㊀BASHIR S,WAHAB A K,IDRISS H.Synergism and photocatalytic water splitting to hydrogen over M/TiO2catalysts:effect of initial particlesize of TiO2[J].Today,2015,240:242-247.。
Rare-earth ion doped TeO 2and GeO 2glassesas laser materialsAnimesh Jha a ,⇑,Billy Richards a ,Gin Jose a ,Toney Teddy-Fernandez a ,Purushottam Joshi b ,Xin Jiang c ,Joris Lousteau da Institute for Materials Research,School of Process,Environmental and Materials Engineering,University of Leeds,Leeds LS29JT,UKb Corporate Research Laboratory,Laird Technologies India Pvt.Ltd.,Unit-3,Fourth Floor,Navigator Building,ITPL,Whitefield Road,Bangalore 560066,Indiac Max-Planck-Institute for the Science of Light,Günther-Scharowsky-Straße 1/Bau 24,91058Erlangen,Germanyd Department of Materials Science and Chemical Engineering,Politecnico di Torino,Corso Duca degli Abruzzi 24,10129Turin,Italy a r t i c l e i nf o Article history:Received 16May 2011Received in revised form 17January 2012Accepted 10March 2012Available online 3May 2012a b s t r a c tGermanium oxide (GeO 2)and tellurium oxide (TeO 2)based glassesare classed as the heavy metal oxide glasses,with phonon energiesranging between 740cm À1and 880cm À1.These two types ofglasses exhibit unique combinations of optical and spectroscopicproperties,together with their attractive environmental resistanceand mechanical properties.Engineering such a combination ofstructural,optical and spectroscopic properties is only feasible asa result of structural variability in these two types of glasses,sincemore than one structural units (TeO 4bi-pyramid,TeO 3trigonalpyramid,and TeO 3+d polyhedra)in tellurite and (GeO 4tetrahedron,GeO 3octahedron)in GeO 2based glasses may exist,depending oncomposition.The presence of multiple structural moities createsa range of dipole environments which is ideal for engineeringbroad spectral bandwidth rare-earth ion doped photonic devicematerials,suitable for laser and amplifier devices.Tellurite glasseswere discovered in 1952,but remained virtually unknown to mate-rials and device engineers until 1994when unusual spectroscopic,nonlinear and dispersion properties of alkali and alkaline earthmodified tellurite glasses and fibres were reported.Detailed spec-troscopic analysis of Pr 3+,Nd 3+,Er 3+,and Tm 3+doped telluriteglasses revealed its potential for laser and amplifier devices foroptical communication wavelengths.This review summarises thethermal and viscosity properties of tellurite and germanate glasses 0079-6425/$-see front matter Ó2012Elsevier Ltd.All rights reserved./10.1016/j.pmatsci.2012.04.003⇑Corresponding author.Tel.:+441133432342;fax:+441133432384.E-mail address:a.jha@ (A.Jha).A.Jha et al./Progress in Materials Science57(2012)1426–14911427forfibre fabrication and compares the linear loss for near and mid-IR device engineering.The aspects of glass preform fabrication forfibre engineering is discussed by emphasising the raw materialsprocessing with casting of preforms andfibre fabrication.The spec-troscopic properties of tellurite and germanate glasses have beenanalysed with special emphasis on oscillator strength and radiativerate characteristics for visible,near IR and mid-IR emission.Thereview also compares the latest results in the engineering of lasersand amplifiers,based onfibres for optical communication and mid-IR.The achievements in the areas of near-IR waveguide and mid-IRbulk glass,fibre,and waveguide lasers are discussed.The latestlandmark results in mode-locked2l m bulk glass lasers sets theprecedence for engineering nonlinear and other laser devices foraccessing the inaccessible parts of the mid-IR spectrum and discov-ering new applications for the future.Ó2012Elsevier Ltd.All rights reserved. Contents1.Introduction (1428)1.1.Background of lasers and broadband sources,applications and market (1428)1.2.A brief description of laser principles in the context of materials engineering (1430)2.Optical transitions in rare-earth ion doped glasses (1431)2.1.Absorption and photoluminescence properties including the competition between radiativeand non-radiative rates (1431)2.2.Radiative and non-radiative rate processes (1433)2.2.1.An introductory summary of radiative and non-radiative decay processes (1434)2.2.2.Energy transfer and related non-radiative processes (1436)3.Background on the development of rare-earth ion doped optical fibre lasers and amplifiers (1437)4.A summary of the optical,phonon vibrational,and thermal properties of tellurite and germanateglasses for laser and amplifier applications (1438)4.1.A brief description of the structures of tellurite and germanate glasses (1438)4.2.Structure and glass formation in tellurium and germanium oxide multicomponentcompositions (1440)4.3.A comparative summary of the thermal and viscosity properties of tellurite and germanateglasses for glass preform and fibre fabrication (1444)4.3.1.Thermal stability of heavy metal glasses (1444)4.4.Fabrication of low OHÀgermanate and tellurite glasses under reactive atmosphere.....processing (1446)4.5.Design and characterisation of single-mode,multi-mode,and multi core fibres (1448)5.Spectroscopic analysis of bulk glasses and glass ceramics (1450)5.1.Sm3+-doped tellurite and germanate glasses for optical transition in the visible range (1451)5.2.Spectroscopic properties of Eu3+ions in tellurite and germanate glass hosts (1454)5.3.Spectroscopic properties of Tb3+ions in tellurite and germanate glass hosts (1456)5.4.Spectroscopy of Nd3+,Yb3+and Pr3+doped tellurite and germanate glasses and devices (1459)5.5.Spectroscopic analysis of Er3+-ions in germanate and tellurite based glasses and devices..14615.5.1.Er3+ion spectroscopy (1461)5.5.2.Co-doped glasses and fibres and energy transfer analysis (1462)5.5.3.Quenching of metastable states (1464)5.5.4.Multiphonon assisted population inversion at4I13/2from4I11/2 (1464)5.5.5.The influence of controlled crystallisation of glass-hosts on Er3+-doped spectroscopy1465sing and amplification in fibres,waveguides,and micro-cavities (1467)6.1.Amplification and gain characterisations of Er3+and co-doped waveguide and fibre hosts..14676.1.1.Amplification methodologies in Er3+-and co-doped fibres (1467)6.1.2.The Er3+waveguide amplifiers and lasers in tellurite and germanate glasses (1469)6.1.3.The Er3+-ion doped micro-cavities (1471)1428 A.Jha et al./Progress in Materials Science57(2012)1426–14916.2.Near-IR and mid-IR optical transitions in Tm3+and Ho3+doped tellurite and germanateglass hosts (1472)6.2.1.Introduction (1472)6.2.2.The optical transitions in Tm3+and Ho3+and spectroscopic parameters (1473)6.2.3.Visible and near-IR transitions in Tm3+and Ho3+activated by Yb3+and amplificationof signals in1460–1510nm (1475)6.2.4.A summary of mid-IR transitions and CW,Q-switched,and mode-locking results inTm3+and Ho3+doped bulk glass,waveguide,and fibre lasers (1481)7.Future trends and conclusions (1483)Acknowledgements (1484)References (1485)1.Introduction1.1.Background of lasers and broadband sources,applications and marketLasers are classified on the basis of defects or colour generating centres present in a gain medium for the multiplication of coherent photon states.The defect states for light amplification may be gas molecules(e.g.in He–Ne lasers),chemical and dyes including metal-vapours,ions dissolved in an opti-cally transparent matrix known as solid-state lasers(SSLs),andfinally the carriers(electrons or holes) in semiconductor laser diodes(SLDs).Although the overall laser types,market and market share,as shown in Fig.1a,and b are dominated by semiconductor lasers,there has been a record level of improvement in the performance of diode pumped solid-state lasers(DPSSLs)[1],especiallyfibre lasers,from a few tens of watts at the end of the1990s to several kilowatts using Yb3+doped silica fibres.In the past decade,wherefibre lasers have reached kilowatt levels of output power[2,3],bulk ceramic and glass lasers for the nuclear fusion programme in US have already exceeded peta watts (1015)of output power and are targeted to achieve exa watts(1018)in the future.Besides cavity engi-neering,the thermal and structural stabilities of materials at such ultra high powers are an essential aspect of the overall system requirement.Einstein wasfirst to report[4]the theory of spontaneous and stimulated emission,following which in the early1950s,Nobel laureates Townes[5]reported their respective discoveries of gas masers. However,thefirst solid state ruby laser,pumped with aflash lamp,was reported by Maiman in 1960[6].Snitzer[7]in1961reported both thefirstfibre and rare-earth ion(Nd3+)doped solid-state flash-lamp pumped laser,operating at1061nm and1062nm.Thermal management of a gain medium is also important in small-scale devices,e.g.in semicon-ductor and optical communication lasers for maintaining wavelength stability.For such applications the device dimensions are critical,the gain per unit length with minimum thermal management is necessary for achieving low costs.One of the main challenges in engineering small foot-print solid state devices,comparable with the traditional semiconductor devices,is the spectroscopic limitations within the materials structure in traditional glass and ceramic materials,which fundamentally limits the gain per unit length.The materials related factors are limited by the solubility of rare-earth ions in standard silicate glasses used for optical communication.By comparison in borate glasses,the low melting point and high-energy phonon structure adversely affect the gain per unit length,whereas phosphate hosts exhibit1000times higher solubility for the majority of the rare-earth oxides compared to silicate and borate glasses.However,the intrinsic hygroscopic nature of phosphates has proven to be a major challenge for complex device fabrication.This review compares the materials and spectroscopic properties of rare-earth doped germanium oxide(GeO2)and tellurium oxide(TeO2)based glasses and devices,in comparison to the spectroscopic performance of traditional silicate,borate and phosphate materials by presenting data on the solubil-ity of rare-earth ions,oscillator strength,lifetimes,branching ratio,and radiative transition probabil-ities of competing transitions.We have also taken examples of novel devices which have beenSymbols and notations usedSection1R1,R2reflectivities of laser cavity mirrorsg gain coefficient per unit length‘length of the cavity(cm or m)G round trip signal gain(dB m,dB,mW,W)a absorption(cmÀ1)s lifetime of the states on an energy levelc velocity of light(2.99Â108m sÀ1)m number of modes in a waveguide volume Vm frequency(cmÀ1)t thickness of a medium(cm)Section2r ab(m),r em(m)absorption cross-section,emission cross-section(pm2)N number of ions per unit volume(no.cmÀ3)k wavelength(nm or cm or m)P peak wavelength(nm)/i,f oscillator or dipole strength,electric dipole(ed)and magnetic dipole(md)s r,s nr radiative,non-radiative lifetimes(sÀ1)4pe o permittivity in electrostatic uniti,j energy multiplet representing the ground and upper statese electronic charge(Coulomb)W R,W NR,W MP,W x radiative,non-radiative,multiphonon decay,and energy transfer rates(sÀ1) n refractive index of the mediumv:linear susceptibility of a mediumh Planck’s constant(6.67Â10À34J s),h h/2pb ij branching ratioT temperature in absolute scale(K)or celcius(°C)D E energy gap(in cmÀ1or eV)a coupling constant parameter(cm)j B Boltzmann constant(1.38Â10À23J KÀ1)p number of phonons required for bridging the energy gap(D E)h x phonon energy(cmÀ1)equals to¼D E pSections4and5NA numerical aperture¼n2core Àn2cladÀÁ0:5D k dispersionD M materials dispersionm Abbe Abbe numbern2nonlinear refractive index(m2WÀ1)a t total absorption(cmÀ1or dB kmÀ1)A0Rayleigh coefficient(dB l mÀ4)B0,C0constants(dB kmÀ1)B1,C1constants(l m)À1D dB l mÀ2kmÀ1E dB kmÀ1T g glass transition temperature(°C or K)T x onset of crystallisation temperature(°C or K)T p peak of crystallisation temperature(°C or K)T m onset of melting temperature(°C or K)t R Raman peaks(cmÀ1)A.Jha et al./Progress in Materials Science57(2012)1426–14911429demonstrated using these two types of oxide materials.TeO 2and GeO 2based glass lasers also offer much larger wavelength tuning in combination with Q-switching and mode locking for power density at lower pump powers than in comparable crystal based devices.1.2.A brief description of laser principles in the context of materials engineeringIn Fig.2,a schematic diagram of a laser gain medium is shown with ‘as the path length of the light oscillating between two mirrors with R 1and R 2reflectivities,with one of the mirrors acting as an out-put coupler by having a reflectivity of less than 100%at the laser wavelength.For a gain coefficient per unit length of the medium,g ,for each trip along the length ‘,the intensity of photons increases by a factor,exp(g ‘).However the end mirrors with reflectivities,R 1and R 2will lead to loss of intensity by fractions (1ÀR 1)times (1ÀR 2).At the threshold condition the intensity of reflected photons from mirrors R 1and R 2must be equal to the initial photon density,which must be maintained then onwards by compensating for any loss within the laser cavity.At the threshold the condition can be expressed by [8]:R 1R 2Áexp ð2g ‘Þ¼1ð1ÞFig.1.(a)Various types of lasers with market share and (b)application of lasers [1].D T temperature differential between T x and T gD T p temperature differential between T p and T xSstability parameter (K)g viscosity (Pa s)X t Omega parameter (cm 2)/i ,felectric or magnetic dipole strengths,oscillator strength C j and C 0thermal occupation factorsP d and P a standard energy transfer probabilityg d and (g 0d )intensities of donor in the presence and absence of an acceptorD g a increase in fluorescence of the acceptor in the presence of the donor,g B c the quantum efficiency of the acceptors the exponent which is to equal to 6,8,and 10for dipole–dipole (d–d),dipole–quadrapole(d–q),and 10for qudrapole–qudrapole (q–q)interaction,respectivelym T energy transfer rate at a temperature Tq i distribution function1/s i transfer rate,rR 0critical distance R inter-ionic distance 1430 A.Jha et al./Progress in Materials Science 57(2012)1426–1491For round trip signal gain G ,beyond threshold,the left hand side in Eq.(1)must be larger than 1,which means that the population at the lasing level will build until it becomes unstable causing stim-ulated emission favouring the energetically most probable photon states within the amplified sponta-neous spectrum of the lasing medium.When the stimulated emission occurs,the value of g decreases instantaneously before the population can build up again.However,each laser cavity suffers from overall loss,a which will reduce the gain,leading to the following equation:R 1R 2Áexp ½ð2‘ðg Àa Þ ¼1ð2ÞFor laser materials engineering,it is important that the value of g be large.The values of g and a depend upon the emission and absorption cross-sections,respectively,of a dopant.a also depends upon the cavity loss,governed by scattering,extrinsic absorption (for example by OH Àions),and the extrinsic defects at the pump and signal wavelengths which may selectively absorb photons non-radiatively.In addition with the loss term,it should also be remembered that the gain,g is equal to a product of inverted population,N times the stimulated emission cross-section (r st ).To maximise the gain it is essential that the lifetime (s met )of the level from which the stimulated emission (or optical transition)occurs is long enough for energy to be stored in the form of occupied states,so that one of the signal photons may be able to trigger the stimulated emission.The stimulated photon decay time (s st ),governed by the spectral width of the transition,depends upon the cavity length and the loss term,as shown in the following equation:s st ¼2‘c :a Total ð3ÞThe value of s st therefore determines the bandwidth of the laser line through frequency or the uncer-tainty relationship.Another important feature for laser oscillation,e.g.,in a three-level system is the total number of resonant modes,m allowable inside a laser cavity having a volume V ,which is expressed in terms of the frequency of oscillation and spontaneous emission bandwidth in the following equation [8]:m ¼8p m 2D m ÁVc 3ð4ÞFrom Eq.(4),the number of oscillating modes,m will increase with the frequency bandwidth of an optical transition.In the examples discussed below we explain the spectroscopic properties of rare-earth ion doped germanium oxide and tellurium oxide glasses in terms of engineering laser and amplifier hosts.2.Optical transitions in rare-earth ion doped glasses2.1.Absorption and photoluminescence properties including the competition between radiative and non-radiative ratesThe most important parameter for amplification is the gain per unit length which depends on the concentrations of dispersed rare-earth ions in a sub-lattice structural site.These ions act as the defect centres in the medium for light amplification.The gain per unit length is proportional to the product of the cross section for stimulated emission,r em and the metastable lifetime (s met ).For example,theλlasingℓλpumpR 1Pump photonsFig.2.A Schematic representation of lasing in a given medium.A.Jha et al./Progress in Materials Science 57(2012)1426–149114311432 A.Jha et al./Progress in Materials Science57(2012)1426–1491typical values for r em are in the10À21–10À20cm2range and10ms of lifetime yield1dB gain in a cen-timetre long device.Such a large value of emission cross-section necessitates a large absorption coef-ficient and/or cross-section(r(m)),which for a transition is determined by the oscillator strength U ab, and can be calculated using the following equation:rðmÞð5ÞaðmÞ¼2:3026twhere2.3026is the conversion factor from log e to log10for determining the intensity ratio:log(I/I0)of light going through the sample of thickness t,in a UV–visible–NIR spectrometer r(m)=a(m)/N,N is the ion concentration in terms of the number density per unit volume.Wyatt[9]compared the absorption cross-sections of a range of opticalfibres,which are listed below in Table1.In this table,wefind that the absorption cross-section is strongly dependent on the Al:Ge ratio.In Table2,the absorption cross-sections and intensity ratios for four different types of glasses are com-pared for1mol%doping of Er2O3.The corresponding values at1530nm for a phosphate glass are in the range of(0.48–0.55)Â10À20pm2[10].The main conclusion from the comparison of data in Tables1and2is that a host material must depict high rare-earth ion solubility and absorption cross-section.Based on the structural and compo-sitional properties of tellurite glasses,described by Vogel[11],these glasses are quite versatile in terms of compositions by incorporating the mono-,di-,tri-,tetra-,penta-,and hexa-valence oxides. The structural properties of tellurite glasses were subsequently analysed in detail by Sekiya and co-workers[12–16],and on this basis it has been established that some tellurite glasses may dissolve up to25mol%of rare-earth oxides.By contrast,little research has been carried out on the spectro-scopic properties of rare-earth doped germanium oxide glasses,one of which is reported in Table2.As an example,the absorption cross-sections of an Er3+-doped tellurium oxide and ZBLAN(50ZrF4–20BaF2–20NaF–5AlF3–4LaF3–1ErF3)glass are compared in Figs.3a and3b.Tellurium oxide glass exhibits much larger absorption cross-section at1480nm(4I15/2?4I13/2)compared to ZBLAN due to the higher refractive index which determines the dipole strength of the transition.In Fig.3b,the absorption cross-sections of a family of tellurite glasses are compared as a function of compositions. As in Table2,wefind that for each specified transition,the absorption cross-section is dependent upon the composition of Na2O,confirming the small but observable differences in the cross-section withTable1A comparison of peak absorption cross-sections(r ab)in pm2,centre wavelengths(P),transition widths(D k),nm from600nm to 1100nm for Er3+-doped silicatefibres[9].Ratio Al:Ge650nm800nm980nmP D k(r ab)P D k(r ab)P D k(r ab) Al only651170.44795200.067978190.24 1:10652160.49794210.086978170.29 1:3365318.50.4795200.089979120.38 Ge only653200.27802200.073980100.36Table2A comparison of Er3+-ion absorption cross-sections(r ab)in pm2for various oxide andfluoride glasses at different wavelengths.Peak intensity ratio(±0.01) Glass composition(mol%)Absorption cross-sections(r ab)atk(nm±0.005pm2)153214959808001495/1532980/1532800/1532 80TeO2–9Na2O–10ZnO–1Er2O30.840.600.350.140.710.410.17 50GeO2–14Ga2O3–20PbO–15Bi2O30.740.390.230.0970.520.310.13 61SiO2–11Na2O–3Al2O3–10LaF3–10PbF2–1ErF30.760.370.210.0890.490.280.12 50ZrF4–20BaF2–20NaF–5AlF3–4LaF3–1ErF30.510.430.230.650.860.460.11composition.The intensity of optical transitions strongly depends on the total dipole strength contrib-uting to the transition.From the reciprocity of absorption and emission cross-sections,described by the Einstein equation and Ladenberg-Fuctbauer relation [4,17,18],the larger magnitude of the absorp-tion coefficient implies a large emission cross-section,which we discuss below by analysing the dipole strength and radiative transition probabilities of each of the Er-ion transitions,for example.2.2.Radiative and non-radiative rate processesThe lasing transition in a rare-earth ion doped host depends strongly upon the energy level structure of the dissolved ions and the resulting competition between the radiative andnon-radiative of the absorption cross-sections in Er 3+doped (NZT composition in mol%80TeO fluoride glass.The arrow shows the pump absorption wavelength used for populating 4567894I 13/24 x=5 x=10 x=15 x=20s -s e c t i o n *10-21 c m 2transitions.The radiative transitions are responsible for spontaneous and stimulated emissions,whereas most of the non-radiative processes are highly dissipative and deplete the energy of pump photons for population inversion.Another important parameter in the amplification of a fibre ampli-fier is the lifetime.The lifetime of inverted states decays exponentially with a time constant,which is characterised experimentally.When there are several pathways for the population to decay,the total probability is the sum of individual probabilities for each pathway.The two main paths for decay are radiative and non-radiative and hence we can write:1s ¼1s r þ1s nr ð6Þwhere s is the total lifetime,s r is the radiative lifetime,and s nr is the non-radiative lifetime.The radiative lifetime arises from the fluorescence from the excited level to all the levels below it.Non-radiative lifetimes depend largely on the glass composition and the vibration coupling between host ions and the rare-earth ions.At high concentrations of rare-earth ions,an effect known as the concen-tration quenching may take place which reduces the lifetimes of excited states.Concentration quench-ing becomes dominant if the lasing transition is in the vicinity of extrinsic impurity absorption bands;e.g.the presence of OH Àion intensifies the influence of like-ion pair induced concentration quenching for the Er 3+:4I 13/2?4I15/2(1500–1600nm),Tm 3+:3H 4?3F 4(1400–1530nm),and Pr 3+:1G 4?3H 5(1300–1350nm)transitions.Below,we briefly discuss the radiative and non-radiative processes using examples of rare-earth ion doped tellurite and germanate glasses.2.2.1.An introductory summary of radiative and non-radiative decay processesThe oscillator strengths (U )of absorption from a given ground state {L ,S ,J }i to a higher {L ,S ,J }j mul-tiplet,from where the optical transition occurs,depend upon the corresponding integrated absorption (r ab )and stimulated emission (r st )cross-sections over the frequency spectrum (R m d m )and are shown below [20]:u ab¼½4p e o mc p Z r ab ðm Þd m ð7a Þu em ¼½4p e o mc p 2Z r st ðm Þd m ð7b ÞHere [4pe o ]designates the permittivity in electrostatic unit,m and e are the mass and charge of an electron,respectively.For a stimulated emission from j multiplet to the ground state i ,the U ab and U em are related and determine the radiative rate (W R )[20–24]as shown in the following equations:u em ¼g i g j u ab ð8ÞW R ¼8ðp en Þ2p e o j !i Þ2Ág i j !u ab ð9Þk j ?I is the emission wavelength and in the case of stimulated emission,it represents the lasing wave-length.From Eq.(9)we can establish that the radiative rate is proportional to U ab ,gi j :the degeneracy ratio,and the materials refractive index,n .The refractive indices of the tellurite and germanate fam-ilies of glasses vary between 1.93and 2.30and 1.7and 2.3,respectively.The values of indices of refrac-tion are much larger than those for silicates,which range between 1.44and 1.55.From this comparison of refractive indices,we may find from Eq.(9)that a tellurite glass is expected to have1.5–2.5times larger radiative rates for a given transition compared to a silicate glass.The oscillator strength,U ab is directly proportional to the radiative rate,W R ,however,the total di-pole strength,U ab can be represented using the susceptibility or refractive index and the electric (U ed )and magnetic (U md )dipoles [20–24].In the context of defining the magnitudes of electric and mag-netic dipoles,Judd–Ofelt (J–O)analysis,discussed in [23],is especially important by characterising the host specific X i (X 2,X 4,X 6)parameters,the magnitudes of which explain the dipole structure1434 A.Jha et al./Progress in Materials Science 57(2012)1426–1491and spectroscopic processes.The magnitude of X 2determines the dominance of covalent character in dipoles,whereas the X 6may reflect on the probability for excited state absorption.The expressions for electric and magnetic dipoles and the total dipole strength in terms of refractive index and the frequency of optical transition,population inversion factor,g i are shown below in the following equa-tions [20,24]:v u ab ¼ðn 2þ2Þ2u ed þn u md ð10a ÞU ab ¼8p 2m v ab 3hg a ðn 2þ2Þ29n u ed þn u md "#ð10b Þwhere m ab is the mean frequency of transition a ?b .m ab ¼R m a ðm Þd m R a ðm Þd m.Using the J–O analysis,the individual and total radiative transition probabilities can be calculated and these vary for a given rare-earth ion in different hosts.In this context two of the most important parameters are the total radiative rate (W r )and the branching ratio,(b ij )of an optical transition,shown in the following equations:s r ¼1P i j W r ð11a Þb ij ¼W ij P i k W ik ¼W ij Ás rð11b ÞThe overall rate,as explained in Eq.(5),is also dependent on the non-radiative components,such as the multiphonon decay rate and the non-radiative energy transfer.Electronic states are excited from the ground state,i ,and populate the higher energy manifold,j ,separated by D E energy gap.The relax-ation process to the ground state may not be entirely radiative.A part of the total energy of the pump photon used for excitation,will be lost non-radiatively which shortens the lifetime of the occupied j states.When the non-radiative process is dominated by multiphonon decay,the occupied dopant ion electronic states may mediate the energy non-radiatively by bridging the D E gap with several overlap-ping vicinal phonons.The strength of overlapping electronic states with vicinal phonons represents the electron–phonon coupling.The coupling constant,a ep ,and the vicinal phonon energy, h x ,deter-mine the rate of multiphonon decay,as explained in Eq.(12)[20,23–25]:W NR ¼W MP ðT Þ¼A 1exp ðÀa ep D E Þ½1þn pð12Þn ¼eh x j T B À1 !À1ð13Þand the a ep is expressed as follows using the Reisfeld–Jorgensen model [25]:a ep ¼ð h x ÞÀ1ln p q ðn þ1ÞÀ1 !¼Àð h x ÞÀ1Á‘n e ep ð14Þwhere W MP (T )is the multiphonon relaxation rate at a temperature T ,and p is the number of phononsrequired to bridge the D E gap,and is equal to p ¼D E x .This means that if the local phonon energy around a dopant is small,the number of phonons,p required will be large and therefore,from the com-bination of the Bose–Einstein Eqs.(10)and (11),the overall multiphonon rate will decrease exponen-tially.q is another constant.The physical meaning of a large value of p is explained with two examples.For bridging an energy gap,e.g.D E =6000cm À1,in a boron oxide glass host,four B–O phonons with energy 1500cm À1are simultaneously required to bridge the gap.By comparison in a tellurite glass,where the maximum phonon energy is of the order of $800cm À1,more than seven phonons will be required to bridge the gap of 6000cm À1.As the number of phonons required to bridge the gap in-creases,the non-radiative decay becomes probabilistically less likely and consequently the radiative transition rate increases.In Table 3,the multiphonon decay parameters are compared for several glass A.Jha et al./Progress in Materials Science 57(2012)1426–14911435。
常见化学专业词汇英文翻译1. The Ideal-Gas Equation 理想气体状态方程2. Partial Pressures 分压3. Real Gases: Deviation from Ideal Behavior 真实气体:对理想气体行为的偏离4. The van der Waals Equation 范德华方程5. System and Surroundings 系统与环境6. State and State Functions 状态与状态函数7. Process 过程8. Phase 相9. The First Law of Thermodynamics 热力学第一定律10. Heat and Work 热与功11. Endothermic and Exothermic Processes 吸热与发热过程12. Enthalpies of Reactions 反应热13. Hess’s Law 盖斯定律14. Enthalpies of Formation 生成焓15. Reaction Rates 反应速率16. Reaction Order 反应级数17. Rate Constants 速率常数18. Activation Energy 活化能19. The Arrhenius Equation 阿累尼乌斯方程20. Reaction Mechanisms 反应机理21. Homogeneous Catalysis 均相催化剂22. Heterogeneous Catalysis 非均相催化剂23. Enzymes 酶24. The Equilibrium Constant 平衡常数25. the Direction of Reaction 反应方向26. Le Chatelier’s Principle 列·沙特列原理27. Effects of Volume, Pressure, Temperature Changes and Catalystsi. 体积,压力,温度变化以及催化剂的影响28. Spontaneous Processes 自发过程29. Entropy (Standard Entropy) 熵(标准熵)30. The Second Law of Thermodynamics 热力学第二定律31. Entropy Changes 熵变32. Standard Free-Energy Changes 标准自由能变33. Acid-Bases 酸碱34. The Dissociation of Water 水离解35. The Proton in Water 水合质子36. The pH Scales pH值37. Bronsted-Lowry Acids and Bases Bronsted-Lowry 酸和碱38. Proton-Transfer Reactions 质子转移反应39. Conjugate Acid-Base Pairs 共轭酸碱对40. Relative Strength of Acids and Bases 酸碱的相对强度41. Lewis Acids and Bases 路易斯酸碱42. Hydrolysis of Metal Ions 金属离子的水解43. Buffer Solutions 缓冲溶液44. The Common-Ion Effects 同离子效应45. Buffer Capacity 缓冲容量46. Formation of Complex Ions 配离子的形成47. Solubility 溶解度48. The Solubility-Product Constant Ksp 溶度积常数49. Precipitation and separation of Ions 离子的沉淀与分离50. Selective Precipitation of Ions 离子的选择沉淀51. Oxidation-Reduction Reactions 氧化还原反应52. Oxidation Number 氧化数53. Balancing Oxidation-Reduction Equations 氧化还原反应方程的配平54. Half-Reaction 半反应55. Galvani Cell 原电池56. Voltaic Cell 伏特电池57. Cell EMF 电池电动势58. Standard Electrode Potentials 标准电极电势59. Oxidizing and Reducing Agents 氧化剂和还原剂60. The Nernst Equation 能斯特方程61. Electrolysis 电解62. The Wave Behavior of Electrons 电子的波动性63. Bohr’s Model of The Hydrogen Atom 氢原子的波尔模型64. Line Spectra 线光谱65. Quantum Numbers 量子数66. Electron Spin 电子自旋67. Atomic Orbital 原子轨道68. The s (p, d, f) Orbital s(p,d,f)轨道69. Many-Electron Atoms 多电子原子70. Energies of Orbital 轨道能量71. The Pauli Exclusion Principle 泡林不相容原理72. Electron Configurations 电子构型73. The Periodic Table 周期表74. Row 行75. Group 族76. Isotopes, Atomic Numbers, and Mass Numbers 同位素,原子数,质量数77. Periodic Properties of the Elements 元素的周期律78. Radius of Atoms 原子半径79. Ionization Energy 电离能80. Electronegativity 电负性81. Effective Nuclear Charge 有效核电荷82. Electron Affinities 亲电性83. Metals 金属84. Nonmetals 非金属85. Valence Bond Theory 价键理论86. Covalence Bond 共价键87. Orbital Overlap 轨道重叠88. Multiple Bonds 重键89. Hybrid Orbital 杂化轨道90. The VSEPR Model 价层电子对互斥理论91. Molecular Geometries 分子空间构型92. Molecular Orbital 分子轨道93. Diatomic Molecules 双原子分子94. Bond Length 键长95. Bond Order 键级96. Bond Angles 键角97. Bond Enthalpies 键能98. Bond Polarity 键矩99. Dipole Moments 偶极矩100. Polarity Molecules 极性分子101. Polyatomic Molecules 多原子分子102. Crystal Structure 晶体结构103. Non-Crystal 非晶体104. Close Packing of Spheres 球密堆积105. Metallic Solids 金属晶体106. Metallic Bond 金属键107. Alloys 合金108. Ionic Solids 离子晶体109. Ion-Dipole Forces 离子偶极力110. Molecular Forces 分子间力111. Intermolecular Forces 分子间作用力112. Hydrogen Bonding 氢键113. Covalent-Network Solids 原子晶体114. Compounds 化合物115. The Nomenclature, Composition and Structure of Complexes 配合物的命名,组成和结构116. Charges, Coordination Numbers, and Geometries 电荷数、配位数、及几何构型117. Chelates 螯合物118. Isomerism 异构现象119. Structural Isomerism 结构异构120. Stereoisomerism 立体异构121. Magnetism 磁性122. Electron Configurations in Octahedral Complexes 八面体构型配合物的电子分布123. Tetrahedral and Square-planar Complexes 四面体和平面四边形配合物124. General Characteristics 共性125. s-Block Elements s区元素126. Alkali Metals 碱金属127. Alkaline Earth Metals 碱土金属128. Hydrides 氢化物129. Oxides 氧化物130. Peroxides and Superoxides 过氧化物和超氧化物131. Hydroxides 氢氧化物132. Salts 盐133. p-Block Elements p区元素134. Boron Group (Boron, Aluminium, Gallium, Indium, Thallium) 硼族(硼,铝,镓,铟,铊)135. Borane 硼烷136. Carbon Group (Carbon, Silicon, Germanium, Tin, Lead) 碳族(碳,硅,锗,锡,铅)137. Graphite, Carbon Monoxide, Carbon Dioxide 石墨,一氧化碳,二氧化碳138. Carbonic Acid, Carbonates and Carbides 碳酸,碳酸盐,碳化物139. Occurrence and Preparation of Silicon 硅的存在和制备140. Silicic Acid,Silicates 硅酸,硅酸盐141. Nitrogen Group (Phosphorus, Arsenic, Antimony, and Bismuth) 氮族(磷,砷,锑,铋)142. Ammonia, Nitric Acid, Phosphoric Acid 氨,硝酸,磷酸143. Phosphorates, phosphorus Halides 磷酸盐,卤化磷144. Oxygen Group (Oxygen, Sulfur, Selenium, and Tellurium) 氧族元素(氧,硫,硒,碲)145. Ozone, Hydrogen Peroxide 臭氧,过氧化氢146. Sulfides 硫化物147. Halogens (Fluorine, Chlorine, Bromine, Iodine) 卤素(氟,氯,溴,碘)148. Halides, Chloride 卤化物,氯化物149. The Noble Gases 稀有气体150. Noble-Gas Compounds 稀有气体化合物151. d-Block elements d区元素152. Transition Metals 过渡金属153. Potassium Dichromate 重铬酸钾154. Potassium Permanganate 高锰酸钾155. Iron Copper Zinc Mercury 铁,铜,锌,汞156. f-Block Elements f区元素157. Lanthanides 镧系元素158. Radioactivity 放射性159. Nuclear Chemistry 核化学160. Nuclear Fission 核裂变161. Nuclear Fusion 核聚变162. analytical chemistry 分析化学163. qualitative analysis 定性分析164. quantitative analysis 定量分析165. chemical analysis 化学分析166. instrumental analys is 仪器分析167. titrimetry 滴定分析168. gravimetric analysis 重量分析法169. regent 试剂170. chromatographic analysis 色谱分析171. product 产物172. electrochemical analysis 电化学分析173. on-line analysis 在线分析174. macro analysis 常量分析175. characteristic 表征176. micro analysis 微量分析177. deformation analysis 形态分析178. semimicro analysis 半微量分析179. systematical error 系统误差180. routine analys is 常规分析181. random error 偶然误差182. arbitration analysis 仲裁分析183. gross error 过失误差184. normal distribution 正态分布185. accuracy 准确度186. deviation偏差187. precision 精密度188. relative standard deviation 相对标准偏差(RSD)189. coefficient variation 变异系数(CV)190. confidence level 置信水平191. confidence interval 置信区间192. significant test 显著性检验193. significant figure 有效数字194. standard solution 标准溶液195. titration 滴定196. stoichiometric point 化学计量点197. end point滴定终点198. titration error 滴定误差199. primary standard 基准物质200. amount of substance 物质的量201. standardization 标定202. chemical reaction 化学反应203. concentration浓度204. chemical equilibrium 化学平衡205. titer 滴定度206. general equation for a chemical reaction化学反应的通式207. proton theory of acid-base 酸碱质子理论208. acid-base titration 酸碱滴定法209. dissociation constant 解离常数210. conjugate acid-base pair 共轭酸碱对211. acetic acid 乙酸212. hydronium ion水合氢离子213. electrolyte 电解质214. ion-product constant of water 水的离子积215. ionization 电离216. proton condition 质子平衡217. zero level零水准218. buffer solution缓冲溶液219. methyl orange 甲基橙220. acid-base indicator 酸碱指示剂221. phenolphthalein 酚酞222. coordination compound 配位化合物223. center ion 中心离子224. cumulative stability constant 累积稳定常数225. alpha coefficient 酸效应系数226. overall stability constant 总稳定常数227. ligand 配位体228. ethylenediamine tetraacetic acid 乙二胺四乙酸229. side reaction coefficient 副反应系数230. coordination atom 配位原子231. coordination number 配位数232. lone pair electron 孤对电子233. chelate compound 螯合物234. metal indicator 金属指示剂235. chelating agent 螯合剂236. masking 掩蔽237. demasking 解蔽238. electron 电子239. catalysis 催化240. oxidation氧化241. catalyst 催化剂242. reduction 还原243. catalytic reaction 催化反应244. reaction rate 反应速率245. electrode potential 电极电势246. activation energy 反应的活化能247. redox couple 氧化还原电对248. potassium permanganate 高锰酸钾249. iodimetry碘量法250. potassium dichromate 重铬酸钾251. cerimetry 铈量法252. redox indicator 氧化还原指示253. oxygen consuming 耗氧量(OC)254. chemical oxygen demanded 化学需氧量(COD) 255. dissolved oxygen 溶解氧(DO)256. precipitation 沉淀反应257. argentimetry 银量法258. heterogeneous equilibrium of ions 多相离子平衡259. aging 陈化260. postprecipitation 继沉淀261. coprecipitation 共沉淀262. ignition 灼烧263. fitration 过滤264. decantation 倾泻法265. chemical factor 化学因数266. spectrophotometry 分光光度法267. colorimetry 比色分析268. transmittance 透光率269. absorptivity 吸光率270. calibration curve 校正曲线271. standard curve 标准曲线272. monochromator 单色器273. source 光源274. wavelength dispersion 色散275. absorption cell吸收池276. detector 检测系统277. bathochromic shift 红移278. Molar absorptivity 摩尔吸光系数279. hypochromic shift 紫移280. acetylene 乙炔281. ethylene 乙烯282. acetylating agent 乙酰化剂283. acetic acid 乙酸284. adiethyl ether 乙醚285. ethyl alcohol 乙醇286. acetaldehtde 乙醛287. β-dicarbontl compound β–二羰基化合物288. bimolecular elimination 双分子消除反应289. bimolecular nucleophilic substitution 双分子亲核取代反应290. open chain compound 开链族化合物291. molecular orbital theory 分子轨道理论292. chiral molecule 手性分子293. tautomerism 互变异构现象294. reaction mechanism 反应历程295. chemical shift 化学位移296. Walden inversio 瓦尔登反转n297. Enantiomorph 对映体298. addition rea ction 加成反应299. dextro- 右旋300. levo- 左旋301. stereochemistry 立体化学302. stereo isomer 立体异构体303. Lucas reagent 卢卡斯试剂304. covalent bond 共价键305. conjugated diene 共轭二烯烃306. conjugated double bond 共轭双键307. conjugated system 共轭体系308. conjugated effect 共轭效应309. isomer 同分异构体310. isomerism 同分异构现象311. organic chemistry 有机化学312. hybridization 杂化313. hybrid orbital 杂化轨道314. heterocyclic compound 杂环化合物315. peroxide effect 过氧化物效应t316. valence bond theory 价键理论317. sequence rule 次序规则318. electron-attracting grou p 吸电子基319. Huckel rule 休克尔规则320. Hinsberg test 兴斯堡试验321. infrared spectrum 红外光谱322. Michael reacton 麦克尔反应323. halogenated hydrocarbon 卤代烃324. haloform reaction 卤仿反应325. systematic nomenclatur 系统命名法e326. Newman projection 纽曼投影式327. aromatic compound 芳香族化合物328. aromatic character 芳香性r329. Claisen condensation reaction克莱森酯缩合反应330. Claisen rearrangement 克莱森重排331. Diels-Alder reation 狄尔斯-阿尔得反应332. Clemmensen reduction 克莱门森还原333. Cannizzaro reaction 坎尼扎罗反应334. positional isomers 位置异构体335. unimolecular elimination reaction 单分子消除反应336. unimolecular nucleophilic substitution 单分子亲核取代反应337. benzene 苯338. functional grou 官能团p339. configuration 构型340. conformation 构象341. confomational isome 构象异构体342. electrophilic addition 亲电加成343. electrophilic reagent 亲电试剂344. nucleophilic addition 亲核加成345. nucleophilic reagent 亲核试剂346. nucleophilic substitution reaction亲核取代反应347. active intermediate 活性中间体348. Saytzeff rule 查依采夫规则349. cis-trans isomerism 顺反异构350. inductive effect 诱导效应t351. Fehling’s reagent 费林试剂352. phase transfer catalysis 相转移催化作用353. aliphatic compound 脂肪族化合物354. elimination reaction 消除反应355. Grignard reagent 格利雅试剂356. nuclear magnetic resonance 核磁共振357. alkene 烯烃358. allyl cation 烯丙基正离子359. leaving group 离去基团360. optical activity 旋光性361. boat confomation 船型构象362. silver mirror reaction 银镜反应363. Fischer projection 菲舍尔投影式364. Kekule structure 凯库勒结构式365. Friedel-Crafts reaction 傅列德尔-克拉夫茨反应366. Ketone 酮367. carboxylic acid 羧酸368. carboxylic acid derivative 羧酸衍生物369. hydroboration 硼氢化反应370. bond oength 键长371. bond energy 键能372. bond angle 键角373. carbohydrate 碳水化合物374. carbocation 碳正离子375. carbanion 碳负离子376. alcohol 醇377. Gofmann rule 霍夫曼规则378. Aldehyde 醛379. Ether 醚380. Polymer 聚合物。
DOI: 10.1016/S1872-5813(22)60067-7Hollow N-doped carbon spheres with anchored single-atom Fe sites for efficientelectrocatalytic oxygen reductionWANG Min-min ,FENG Chao ,LIU Yun-qi *,PAN Yuan*(State Key Laboratory of Heavy Oil Processing , China University of Petroleum (East China ), Qingdao 266580, China )Abstract: We anchored atomically dispersed Fe-N 4 sites on hollow N-doped carbon spheres (Fe SAs/HNCSs-800) for electrocatalytic ORR; the obtained material exhibited electrocatalytic activity and stability comparable to that of commercial Pt/C, with an onset potential of 0.925 V and a half-wave potential of 0.867 V. Aberration-corrected high-angle annular dark-field scanning transmission electron microscopy and X-ray absorption spectroscopy results confirmed the presence of highly dispersed Fe single atoms in Fe SAs/HNCSs-800. The results of experiments and theoretical calculations show that the single-atom dispersed Fe-N 4 serve as the ORR active sites, and the adjacent C defects can effectively regulate the electronic structure of Fe atoms and improve the electrocatalytic ORR activity.Key words: hollow N-doped carbon spheres ;Fe-N 4 sites ;single atoms ;oxygen reduction reaction ;electrocatalysts CLC number: O643.3 Document code: AThe slow kinetics of the cathodic oxygen reduction reaction (ORR) is one of the important factors restricting the development of clean energy technologies such as proton exchange membrane fuelcells (PEMFCs) and metal-air batteries [1−4]. At present,Pt-based catalysts are an important class of highly efficient catalytic materials for oxygen reduction, but their large-scale industrial applications are limited by their high price, low availability, poor stability, andpoor methanol tolerance [5−8]. Therefore, the development of non-noble metal catalysts with high efficiency, low cost, and good stability is the key to solve the present energy and environmental problems.Among many non-noble metal catalysts, metal-nitrogen-carbon (M-N-C) is regarded as the mostpromising alternative to noble metal-based systems [9−14].Fe-based single-atom catalysts exhibit the highest oxygen reduction activity as well as good stability and methanol tolerance, achieved through the rational design of the iron-containing precursor and a high-temperature calcination process [15−17]. Reducing the active site size of M-N-C catalysts to the single-atom scale can maximize the atomic utilization and fully expose the active sites. Therefore, the main challenge is to develop effective synthetic strategies for creating homogeneous and highly dispersed single-atom active sites, along with optimizing the electronic and support structures of the catalyst to further improve its ORRperformance.Herein, we synthesized hollow N-doped carbon spheres with anchored single-atom Fe sites (Fe SAs/HNCSs) for efficient electrocatalytic ORR; the synthesized catalyst exhibited good electrocatalytic activity and stability. Aberration-corrected high-angle annular dark-field scanning transmission electron microscopy (AC-HAADF-STEM) and X-ray absorption spectroscopy (XAS) results confirmed the presence of Fe single atoms in Fe SAs/HNCSs-800,and revealed the specific Fe-N 4 coordination of the catalyst. Density functional theory (DFT) calculations showed that adjacent C defects can greatly affect the electronic structure of the Fe-N 4 active site, thus improving its ORR activity. This work provides a novel method for electronic structure regulation and opens up a new avenue for the development of efficient ORR catalysts.1 Results and discussion1.1 SynthesisandcharacterizationofFeSAs/HNCSs catalystFirst, we synthesized SiO 2@resorcinol-melamine-formaldehyde polymer spheres with core-shell structure (SiO 2@RMFs). Then, the SiO 2@RMFs were pyrolyzed at 800 °C in Ar atmosphere, and the SiO 2Received :2022-08-19;Revised :2022-09-19*,The project was supported by National Natural Science Foundation of China (22108306), Taishan Scholars Program of Shandong Province (tsqn201909065) and Shandong Provincial Natural Science Foundation (ZR2021YQ15, ZR2020QB174).本文的英文电子版由 Elsevier 出版社在 ScienceDirect 上出版 (/science/journal/18725813)第 51 卷 第 5 期 燃 料 化 学 学 报 (中 英 文)Vol. 51 No. 52023 年 5 月Journal of Fuel Chemistry and TechnologyMay 2023core was etched by HF to form porous carbon spheres (HNCSs), as shown in Figure 1. Finally, iron porphyrin molecules were attached to the surface of the porous carbon sphere by π−π conjugation. Due to the unique Fe single-atom coordination structure of iron phthalocyanine, Fe atoms were anchored to the hollow N-doped carbon spheres through secondary pyrolysis,and the Fe SAs/HNCSs-t (t stands for pyrolysis temperature, t =700, 800, 900, 1000 °C) catalyst was obtained. According to inductive coupled plasma emission spectrometer (ICP) results, the mass percentage of Fe element in the Fe SAs/HNCSs-800catalyst was only 1.1%.NH 3·H 2O+EtOH+H 2OAfter 30 minAfter 30 minAfter 10 min30 ℃, 24 h800 ℃, 2 h 400 ℃, 2 h FePc HF ArHNCSsEtOH/THFH 2/Ar100 ℃24 hTEOSOHOHCH OHOHN N NN nNH NHCH H C OHH 2N NN NNH 2NH 2+ HCOHSiO 2@RMFsFe SAs/HNCSs-800Figure 1 Synthesis of Fe SAs/HNCSs-800 catalystTwo broad peaks at around 25° and 44° were observed in the X-ray powder diffraction (XRD)pattern of the Fe SAs/HNCSs catalyst (Figure 2(a)),corresponding to the characteristic signals of graphitecarbon [18−20]. No peaks related to Fe-based crystals were present in the XRD pattern, indicating that the Fe atoms were highly dispersed. The transmission electron microscopy (TEM) images in Figure 2(b) show that the HNCSs and the Fe SAs/HNCSs-800 catalyst presented a homogeneous hollow sphere morphology. Uniformly dispersed Fe atoms were directly observed in the AC-HAADF-STEM images of the Fe SAs/HNCSs-800catalyst (Figure 2(d)), proving that Fe was present as single atoms. The HAADF-STEM image of the Fe SAs/HNCSS-800 catalyst and the corresponding energy dispersive spectroscopy (EDS) mapping showed that Fe, N and C elements were evenly distributed on the hollow carbon spheres (Figure 2(e)).The electronic structure and coordination environment of the Fe SAs/HNCSs-800 catalyst were characterized by X-ray absorption near-edge structure (XANES) and extended X-ray absorption fine structure (EXAFS) spectroscopy. The K -edge of Fe in FeSAs/HNCSs-800 catalyst is between that of FeO and Fe 2O 3 (Figure 3(a)), indicating that Fe atoms were positively charged and the valence state of Fe atoms was between + 2 and + 3 (closer to + 3). The Fourier-transformed (FT) k 2-weighted EXAFS spectrum of the Fe SAs/HNCSs-800 catalyst only displayed a main peak at ~ 1.5 Å, corresponding to the Fe-N coordination,and no Fe-Fe coordination peak at ~ 2.2 Å was observed (Figure 3(b)), indicating that Fe species were present inthe form of single atoms [10,21]. The corresponding wavelet transform (WT) plot showed a maximumintensity near 4 Å−1, which was attributed to Fe-N coordination by comparison with Fe foil, FeO, and Fe 2O 3 (Figure 3(e)). The specific coordination environment of Fe atoms was determined via EXAFS fitting (Figures 3(c) and 3(d)), which showed that the Fe-N coordination number of the Fe SAs/HNCSs-800 catalyst was 4. These results indicate that the active center of the Fe SAs/HNCSs-800 catalyst is Fe-N 4 site.1.2 Electrocatalytic ORR performanceThen, we investigated the electrochemical ORR performance of the Fe SAs/HNCSs catalysts (Figure 4).582燃 料 化 学 学 报 (中 英 文)第 51 卷Fe SAs/HNCSs-800HNCSs(a)(d)I n t e n s i t y /(a .u .)102030402θ /(°)506070Figure 2 (a) XRD pattern and (b) TEM image of Fe SAs/HNCSs-800, with the inset showing a TEM image of the HNCSs, (c) TEMimage of Fe SAs/HNCSs-800 after stability test, (d) AC-HAADF-STEM and (e) HAADF-STEM-EDS elementalmapping images of Fe SAs/HNCSs-800X A N E S /(a .u .)Energy /eV (a) 0246102030Fe 2O 3 FeO Fe foilFe SAs/HNCSs-800|F T (k 2χ(k ))| /Å−3R /ÅR /ÅR /ÅFe-NFe-Fe(b)(e)5432154321R /Å54321R /Å321(c) (d)036912−30−20−10010203040k 2χ(k ) /Å−2k /Å−1k /Å−1Fe 2O 3 FeO Fe foil Fe SAs/ HNCSs-80024602481012602468|F T (k 2χ(k ))| /Å−3R /ÅFe SAs/HNCSs-800 FittingFe foilFeOFe SAs/HNCSs-800Fe 2O 3Figure 3 (a) Fe K -edge spectra, (b) FT k 2-weighted EXAFS spectra, (c) EXAFS fitting in k -space, (d) EXAFS fitting in R -space of FeSAs/HNCSs-800, and (e) wavelet transform plots of Fe foil, FeO, Fe 2O 3 and Fe SAs/HNCSs-800第 5 期WANG Min-min et al.:Hollow N-doped carbon spheres with anchored single-atom Fe sites for ……5830.40.50.60.70.80.9 1.0−6−5−4−3−2−1Currentdensity/(mA⋅cm−2)Potential (V vs. RHE)HNCSsFe SAs/HNCSs-700Fe SAs/HNCSs-800Fe SAs/HNCSs-900Fe SAs/HNCSs-100020% Pt/C(a)Overpotential/V0.40.60.8 1.0 1.2−11234E1/2=0.861 VE1/2=0.843 VE1/2=0.852 VE1/2=0.867 VE1/2=0.681 VE1/2=20% Pt/CFe SAs/HNCSs-1000Fe SAs/HNCSs-900Fe SAs/HNCSs-800Fe SAs/HNCSs-700Currentdensity/(mA⋅cm−2)Potential (V vs. RHE)HNCSs(c)3691215Jk/(mA·cm−2)@.85V20%P t/CH N CSF e SA s/HN C Ss-70F e SA s/HN C Ss-80F e SA s/HN C Ss-90F e SA s/HN C Ss-100.20.40.60.81.0E1/2/V−6−5−4−3−2−1Currentdensity/(mA⋅cm−2)Potential (V vs. RHE)20406080100JK/(mA·cm−2)Potential (V vs.RHE)0.861 Vlog |JK| /(mA·cm−2)Figure 4 (a) LSV curves, (b) Tafel plots, (c) cyclic voltammetry (CV) curves, and (d) kinetic current density (j k) curves of Fe SAs/HNCSs; (e) j k at 0.85 V and E1/2 values; (f) LSV curves before and after 3000-cycle durability test, withthe inset showing the i-t curves of Fe SAs/HNCSs-800 and 20% Pt/CThe linear sweep voltammetry (LSV) curves inFigure 4(a) show that the ORR performance of the FeSAs/HNCSs-800 catalyst was better than that ofcommercial Pt/C. The half-wave potential (E1/2) of FeSAs/HNCSS-800 (0.867 V) was higher than that ofcommercial Pt/C (0.861 V), Fe SAs/HNCSs-700(0.861 V), Fe SAs/HNCSs-900 (0.852 V), and Fe SAs/HNCSs-1000 (0.843 V) (Figure 4(a), 4(c), and 4(e)).Moreover, Fe SAs/HNCSs-800 showed a higherdynamic current of 13.09 mA/cm2 at a potential of 0.8 V(Figures 4(d) and 4(e)). The kinetic current densities ofthe commercial Pt/C, Fe SAs/HNCSs-700, Fe SAs/HNCSs-900, and Fe SAs/HNCSS-1000 catalysts were10.61, 5.95, 9.65, and 5.34 mA/cm2, respectively. TheTafel slope of Fe SAs/HNCSs-800 (83.4 mV/dec,Figure 4(b)) was lower than that of commercial Pt/C(86.3 mV/dec), indicating the superior ORR catalyticperformance of Fe SAs/HNCSs-800. In order to explorethe role of Fe single atoms in the electrocatalytic ORR,we synthesized pure HNCSs and tested its performance. 584 燃 料 化 学 学 报 (中 英 文)第 51 卷The E 1/2 of HNCSs was only 0.681 V, which was much lower than that of the Fe SAs/HNCSs catalyst. The experimental results thus show that the presence of Fe single atoms is crucial for the electrocatalytic ORR.Then, we obtained the LSV curves of Fe SAs/HNCSs at different rotation speeds (Figure 5).0.40.50.60.70.80.91.0−5−4−3−2−10 Fe SAs/HNCSs-700 225 r/min 400 r/min 625 r/min 900 r/min 1225 r/min 1600 r/min 2025 r/min225 r/min 400 r/min 625 r/min 900 r/min 1225 r/min 1600 r/min 2025 r/min225 r/min 400 r/min 625 r/min 900 r/min 1225 r/min 1600 r/min 2025 r/min 225 r/min 400 r/min 625 r/min 900 r/min 1225 r/min 1600 r/min 2025 r/min C u r r e n t d e n s i t y /(m A ⋅c m −2)Potential (V vs. Ag /AgCl)(a)0.200.250.300.350.400.450.500.550.60J −1 /(m A −1·c m −2)ω−1/2/(r·min −1)−1/2ω−1/2 /(r·min −1)−1/2ω−1/2 /(r·min −1)−1/2ω−1/2 /(r·min −1)−1/20.40.50.60.70.80.91.0−6−5−4−3−2−101C u r r e n t d e n s i t y /(m A ⋅c m −2)Potential (V vs. RHE)Fe SAs/HNCSs-800(c)0.150.200.250.300.350.400.450.500.55J −1 /(m A −1·c m −2)J −1 /(m A −1·c m −2)J −1 /(m A −1·c m −2)0.40.50.60.70.80.91.0−4−3−2−10 Fe SAs/HNCSs-900C u r r e n t d e n s i t y /(m A ⋅c m −2)Potential (V vs. RHE)(e)0.20.30.40.50.60.70.40.50.60.70.80.91.0−4−3−2−10 Fe SAs/HNCSs-1000C u r r e n t d e n s i t y /(m A ⋅c m −2)Potential (V vs. RHE)(g)0.30.40.50.6Figure 5 LSV curves of Fe SAs/HNCSs catalysts at different rotation speeds and corresponding K-L plots第 5 期WANG Min-min et al.:Hollow N-doped carbon spheres with anchored single-atom Fe sites for ……585According to the Koutecky-Levich (K-L) equation,the electron transfer numbers of the Fe SAs/HNCSs-700, Fe SAs/HNCSs-800, Fe SAs/HNCSs-900, and Fe SAs/HNCSs-1000 catalysts were calculated to be approximately 3.8, 3.9, 3.7, and 3.8, respectively,indicating that these catalysts underwent a four-electron ORR process. The Fe SAs/HNCSs-800 catalyst showed higher long-term stability than the 20% Pt/C catalyst. After a i-t test of 10000 s, the current ratio (i /i 0) of Fe SAs/HNCSs-800 catalyst was 94.6%, while that of the 20% Pt/C catalyst was only 89.8%. The Fe SAs/HNCSs-800 catalyst maintained the hollow N-doped carbon sphere morphology, highlighting its good structural stability. In addition, the Fe SAs/HNCSs-800catalyst exhibited good cyclic stability. After 3000cycles, the LSV curve of Fe SAs/HNCSs-800 was basically unchanged compared with that before the reaction (Figure 4(f)).1.3 DFT calculationsIn order to understand the reason for the higher ORR activity of the Fe SAs/HNCSs-800 catalyst, we carried out DFT calculations to explore the reaction mechanism. Based on the XAS results, we built FeN 4 andFeN 4-C (with a C defect) models to simulate the Fe SAs/HNCSs-800 catalyst (Figures 6(a) and 6(b)). The differential charge density diagram (Figure 6(c)) of the FeN 4-C model shows that electron depletion regions were generated at the defect C site, and the charge increased on both sides of the Fe atom. The comparison of the DOS diagrams of FeN 4 and FeN 4-C (Figures 6(d) and 6(e))shows that, after the formation of the C defect, the p-band center of FeN 4-C moved toward the Fermi level,indicating that the total surface energy increased. After the formation of the C defect, the O 2 adsorption ability of FeN 4-C was enhanced (Figure 6(f)). As shown by the free energy diagram (Figures 6(g)–(i)), the rate-determining step of the ORR on FeN 4 site was the decomposition of OH* into H 2O, whose energy was 0.75 eV. After the formation of the C defect near FeN 4, due to the change in the adsorption ability of Fe atoms for oxygen species, the decisive step was the OOH* decomposition into O* +H 2O, which released the lowest energy of 0.87 eV,greatly improving the ORR performance of the catalyst.In short, the DFT results show that the formation of C defects near FeN 4 sites can greatly affect the electronic structure of Fe-N 4, thus regulating its ORR activity−20−15−10−50510D O S (s t a t e s /(a .u .))Energy /eV FeN 4 Fe C ND P-FeN 4=−5.2(d)−20−15−10−50510FeN 4FeN 4-CD P-FeN 4-C =−4.0D O S (s t a t e s /(a .u .))Energy /eV FeN 4-C Fe C N(e)−2.0−1.5−1.0−0.50FeN 4-C=−1.41O 2 a d s o r p t i o n e n e r g y /e VFeN 4=−0.49(f)−1012345G i b b s f r e e e n e r g y /e VReaction coordinateU =0 V U =0.402 V U =0.85 V U =1.23 VH 2O OH*O*OOH*O 2(g)012345H 2OOH*O*OOH*G i b b s f r e e e n e r g y /e VReaction coordinateU =0 V U =0.402 V U =0.85 V U =1.23 VO 2(h)12345G i b b s f r e e e n e r g y /e VReaction coordinateFeN 4 FeN 4-C U =0 VH 2OOH*O*OOH*O 2(i)(a)(b)(c)Figure 6 ((a), (b)) theoretical models of FeN 4 and FeN 4-C, (c) charge density difference of FeN 4-C, ((d), (e)) DOS diagrams of FeN 4and FeN 4-C, (f) adsorption energy of O 2 on different catalysts, ((g)–(i)) calculated Gibbs free energy profiles fordifferent catalysts in 0.1 mol/L KOH586燃 料 化 学 学 报 (中 英 文)第 51 卷2 ConclusionsIn this study, we synthesized a Fe SAs/HNCSs-800 catalyst in which single-atom Fe sites are anchored to hollow N-doped carbon spheres. The catalyst showed good electrocatalytic ORR activity and stability. The highly dispersed Fe atoms in Fe SAs/HNCSs-800 were identified by AC-HAADF-STEM and XAS, and EXAFS fitting showed their specific coordination to be Fe-N 4. The results of DFT calculations indicated that C defects near Fe-N 4 active sites can affect their ORR activity by altering their electronic structure. This work opens up a new avenue for preparing high-performance ORR catalysts by regulating the electronic structure of Fe sites.ReferencesWANG M, ZHANG H, LIU Y, PAN Y. Research progress of precise structural regulation of single atom catalyst for accelerating electrocatalyticoxygen reduction reaction [J ]. J Energy Chem ,2022,72:56−72.[1]ZHANG J, YUAN Y, GAO L, ZENG G, LI M, HUANG H. Stabilizing Pt-based electrocatalysts for oxygen reduction reaction, Fundamental understanding and design strategies [J ]. Adv Mater ,2021,33(20):2006494.[2]WANG Y, CHU F, ZENG J, WANG Q, NAREN T, LI Y, CHENG Y, LEI Y, WU F. Single atom catalysts for fuel cells and rechargeable batteries:Principles, advances, and opportunities [J ]. ACS Nano ,2021,15(1):210−239.[3]CUI L, FAN K, ZONG L, LU F, ZHOU M, LI B, ZHANG L, FENG L, LI X, CHEN Y, WANG L. Sol-gel pore-sealing strategy imparts tailored electronic structure to the atomically dispersed Ru sites for efficient oxygen reduction reaction [J ]. Energy Storage Mater ,2022,44:469−476.[4]LI J, BANIS M N, REN Z, ADAIR K R, DOYLE DAVIS K, MEIRA D M, FINFROCK Y Z, ZHANG L, KONG F, SHAM T K, LI R, LUO J,SUN X. Unveiling the nature of Pt single-atom catalyst during electrocatalytic hydrogen evolution and oxygen reduction reactions [J ]. Small ,2021,17(11):2007245.[5]YANG S, KIM J, TAK Y J, SOON A, LEE H. Single-atom catalyst of platinum supported on titanium nitride for selective electrochemical reactions [J ]. Angew Chem Int Ed ,2016,55(6):2058−2062.[6]LIU Q, LI Y, ZHENG L, SHANG J, LIU X, YU R, SHUI J. Sequential synthesis and active-site coordination principle of precious metal single-atom catalysts for oxygen reduction reaction and PEM fuel cells [J ]. Adv Energy Mater ,2020,10(20):2000689.[7]LIU J, BAK J, ROH J, LEE K, CHO A, HAN J W, CHO E. Reconstructing the coordination environment of platinum single-atom active sites for boosting oxygen reduction reaction [J ]. ACS Catal ,2021,11(1):466−475.[8]WANG M, ZHENG X, QIN D, LI M, SUN K, LIU C, CHEONG W C, LIU Z, CHEN Y, LIU S, WANG B, LI Y, LIU Y, LIU C, YANG X, FENG X, YANG C, CHEN C, PAN Y. Atomically dispersed CoN 3C 1-TeN 1C 3 diatomic sites anchored in N-doped carbon as efficient bifunctional catalyst for synergistic electrocatalytic hydrogen evolution and oxygen reduction [J ]. Small ,2022,18(29):2201974.[9]PAN Y, LIU S, SUN K, CHEN X, WANG B, WU K, CAO X. A bimetallic Zn/Fe polyphthalocyanine derived single-atom Fe-N 4 catalytic site, A superior trifunctional catalyst for overall water splitting and Zn-air batteries.[J ]. Angew Chem Int Ed ,2018,57(28):8614−8618.[10]QI W, HUANG W, NIU J, ZHANG B, ZHANG Z, LI W. The role of S in the Co-N-S-C catalysis system towards the ORR for proton exchange membrane fuel cells [J ]. Appl Surf Sci ,2021,540:148325.[11]YIN P, YAO T, WU Y, ZHENG L, LIN Y, LIU W, JU H, ZHU J, HONG X, DENG Z, ZHOU G, WEI S, LI Y. Single cobalt atoms with precise N-coordination as superior oxygen reduction reaction catalysts [J ]. Angew Chem Int Ed ,2016,55(36):10800−10805.[12]LU F, FAN K, CUI L, YANG Y, WANG W, ZHANG G, WANG C, ZHANG Q, LI B, ZONG L, WANG L. Cu-N 4 single atoms derived from metal-organic frameworks with trapped nitrogen-rich molecules and their use as efficient electrocatalysts for oxygen reduction reaction [J ]. Chem Eng J ,2022,431:133242.[13]ZONG L, LU F, ZHANG W, FAN K, CHEN X, JOHANNESSEN B, QI D, BEDFORD N M, WARREN M, SEGRE C U, LIU P, WANG L,ZHAO H. Atomically-dispersed Mn-(N-C 2)2(O-C 2)2 sites on carbon for efficient oxygen reduction reaction [J ]. Energy Storage Mater ,2022,49:209−218.[14]CHEN G, LIU P, LIAO Z, SUN F, HE Y, ZHONG H, ZHANG T, ZSCHECH E, CHEN M, WU G, ZHANG J, FENG X. Zinc-mediated template synthesis of Fe-N-C electrocatalysts with densely accessible Fe-N x active sites for efficient oxygen reduction [J ]. Adv Mater ,2020,32(8):1907399.[15]MUN Y, LEE S, KIM K, KIM S, LEE S, HAN J W, LEE J. Versatile strategy for tuning ORR activity of a single Fe-N 4 site by controlling electron-withdrawing/donating properties of a carbon plane [J ]. J Am Chem Soc ,2019,141(15):6254−6262.[16]YANG L, CHENG D, XU H, ZENG X, WAN X, SHUI J, XIANG Z, CAO D. Unveiling the high-activity origin of single-atom iron catalysts for oxygen reduction reaction [J ]. Proc Natl Acad Sci ,2018,115(26):6626−6631.[17]WANG M, LI M, ZHAO Y, SHI N, ZHANG H, ZHAO Y, ZHANG Y, ZHANG H, WANG W, SUN K, PAN Y, LIU S, ZHU H, GUO W, LI Y,LIU Y, LIU C. Construction of N-doped carbon frames anchored with Co single atoms and Co nanoparticles as robust electrocatalyst for hydrogen evolution in the entire pH range [J ]. J Energy Chem ,2022,67:147−156.[18]ZONG L, FAN K, WU W, CUI L, ZHANG L, JOHANNESSEN B, QI D, YIN H, WANG Y, LIU P, WANG L, ZHAO H. Anchoring single copper atoms to microporous carbon spheres as high-performance electrocatalyst for oxygen reduction reaction [J ]. Adv Funct Mater ,2021,31(41):2104864.[19]LU F, FAN K, CUI L, LI B, YANG Y, ZONG L, WANG L. Engineering FeN 4 active sites onto nitrogen-rich carbon with tubular channels for enhanced oxygen reduction reaction performance [J ]. Appl Catal B: Environ ,2022,313:121464.[20]PAN Y, CHEN Y, WU K, CHEN Z, LIU S, CAO X, CHEONG W, MENG T, LUO J, ZHENG L, LIU C, WANG D, PENG Q, LI J, CHEN C.Regulating the coordination structure of single-atom Fe-N x C y catalytic sites for benzene oxidation [J ]. Nat Commun ,2019,10(1):4290.[21]第 5 期WANG Min-min et al.:Hollow N-doped carbon spheres with anchored single-atom Fe sites for ……587588 燃 料 化 学 学 报 (中 英 文)第 51 卷空心氮掺杂碳球锚定单原子铁位点用于高效电催化氧还原反应王敏敏 ,冯 超 ,柳云骐* ,潘 原*(中国石油大学(华东) 重质油国家重点实验室, 山东 青岛 266580)摘 要:本研究将单原子分散的Fe-N4位点锚定在氮掺杂空心多孔碳球上用于电催化氧还原反应,研究表明,所制备的Fe SAs/HNCSs-800催化剂表现出优异的电催化氧还原性能,其起始电位为0.925 V,半波电位为0.867 V。
a r X i v :p h y s i c s /0604160v 1 [p h y s i c s .f l u -d y n ] 20 A p r 2006Spectra of Stable Non-Noble Gas Single Bubble SonoluminescenceMogens T.Levinsen and Jeppe Seidelin Dam ∗Complexity Lab,Niels Bohr Institute,Blegdamsvej 17,DK-2100Copenhagen Ø,Denmark(Dated:February 2,2008)A commonly accepted view is that stable Single Bubble Sonoluminescence (SBSL)can only be achieved in the presence of a noble gas or hydrogen.In air-seeded bubbles,the content of diatomic gasses is burned offto leave the small amount of argon needed to sustain stable operation.Here we report that long term stable SBSL can be sustained with only nitrogen,oxygen,or nitrogen/oxygen mixtures being pared to that of a stable argon bubble,the emission is much weaker and the spectrum looks much colder.Oscillating states as well as recycling states are also observed.An intriguing saturation effect seems connected with the presence of water vapor in the bubble.PACS numbers:78.60.Mq,47.55.Bx,47.52.+jRecently we reported a second type of recycling mode in Single Bubble Sonoluminescence (SBSL)[1].This oc-curs for air-seeded bubbles with dissolved gas content higher than approximately 20%of the saturation level,when driven past their shape instability limit.In con-trast to the usual recycling mode denoted type 1,which reaches the same maximum intensity level as that of the stable bubble,the intensity in the new type 2mode is down by approximately a factor of 20.Furthermore,spectra of the emission from a single bubble in the type 2mode look like the bubble is much colder than an argon dominated bubble,thus providing a link to multi bubble sonoluminescence (MBSL).The dissociation hypothesis [2]was invented to explain the stability of SBSL air-seeded bubbles at dissolution levels,where the bubble growth elsewise would not be limited.This hypothesis,since verified in many experi-ments,suggests that the bubbles burn offtheir content of diatomic gasses leaving behind the small amount of argon needed to sustain stable operation.The chemical reaction products,readily dissolvable,diffuse out of the bubble during the expansion and following contraction.Our interpretation of the type 2mode follows this pic-ture.The bubble is driven so hard that after the splitting offof a microbubble as is the usual explanation for the type 1event,it sucks in air too fast to burn offthe di-atomic molecules.Thus it grows to the instability limit while still being predominantly an air bubble.The role of the water vapor could not be established.In order to check this hypothesis we prepared a cell with gas mixtures involving no noble gasses (nor hydro-gen).Gasses used are either pure nitrogen,oxygen,or a 4:1nitrogen-oxygen mixture to simulate air without ar-gon.The noble gas content in all cases are below 1ppm.As we had expected,SBSL in the type 2recycling state is possible and at the same level of emission.The spec-trum also looks very similar to that obtained from air-seeded bubbles.Thus our hypothesis regarding the type 2recycling seems verified.However,to our surprise,stable SBSL was also pos-sible.This has to the best of our knowledge not been reported before.The stable radiation was obtained for extended periods of up to 45minutes for nitrogen bub-bles.The fluctuations and long term drift of the relative phase of the flashes were 100ns or less with short term fluctuations within 40ns and no preferred direction of drift.At higher levels of gas pressure an oscillating state is encountered at the low end of the emission range.Such an oscillating state has previously been reported for ni-trogen bubbles [3].These authors also reported on irreg-ular peaking emission.This phenomenon we find to be associated with small amounts of argon being allowed to diffuse into the cell.The spectrum of the stable phase very much coincides with that of the type 2case for air seeded bubbles with to-tal output being similar in the case of nitrogen and the ni-trogen/oxygen mixture but an order of magnitude lower for pure oxygen which also seems to be colder.Thus this experiment is further verification of the dissociation the-ory and fits the picture of the strong and hotter emission from an air-seeded bubble being connected with argon accumulation.To obtain stable emission from non-noble gasses,however,must call for a delicate balance between the diffusion into the bubble and the burning of diatomic gasses.Presumably this leaves the bubble much more susceptible to environmental factors like microstreaming,nearby particles,and chemical balance.All factors,that are expected to affect the long term stability.In view of this,while the levels of fluctuations and long term drift are higher than would be expected for e.g.air or ar-gon seeded bubbles at high levels of emission which can be stable at ns levels,the changes are still surprisingly small.The cell used is described in more detail in ref.[4],but is essentially a 5or 6cm high and 6cm diameter cylindrical quartz cell with metal caps at both ends so it can be sealed using a pressure relief bag.Piezoelectric transducers are mounted on one or both caps for the drive,which for most experiments reported (6cm cell),is at a frequency of 22140Hz.A notable difference is the use of a heater to avoid contamination with hydrogen.The procedure finally adopted to prepare the water20.150.10.050P M T s i g n a l (n o r m .)486nm2.0 1.0 0.0100806040200R e l . p h a s e (µs )Time (s)FIG.1:Timeseries showing a progression for stepwise increase of sound pressure through stable states into type 2behavior.Gas content 880mbar nitrogen/oxygen 4:1mixture as pre-pared at room temperature.Measurement performed at 9◦C.Upper trace emission at 486nm ±5nm.Lower trace the relative phase.Average over 1000flashes.is as follows.The water is subjected to alternating de-gassing at water vapor pressure and flushing with the final gas to be used for several hours in 15minutes in-tervals.Under this whole process the water is violently stirred by a magnetic stirrer.After a final 15min.flush-ing with the final gas composition and concentration,the water is transferred in a closed system to the cell and cooled to the operating temperature (9◦C )for several hours before commencing measurements.As described in ref.[1]a crude spectrum is obtained by placing 7photomultiplier tubes (PMT’s)around the cell with narrow band (10nm)optical filters in front.The signals are amplified and collected by a computer with an extra PMT giving the timing signal for the sampling.This method was chosen primarily because it allows us to get spectra of weak and shortlived states but also since it allows us to get flash by flash control of the averaging time of the spectra.Thus we have precise knowledge of the time of collection so the radiative state of the bub-ble can be established.The timing of the flash is also recorded with a resolution of 50ns with averaging pro-viding a better resolution for slower fluctuations.For extremely weak signals (oxygen bubbles),however,a dif-ferent procedure,to be described later,was used.The stable states were in the case of the nitro-gen/oxygen mixture found in the whole interval inves-tigated from dissolved gas levels of 180to 900mbar.For nitrogen the range of degassing where a stable state was observed is 100to 320mbar,with the intensity level falling below our limit of detection at the low end.How-ever,type 2emission was observed up to 900mbar.At low levels of dissolved gas,the interval of stability is quite narrow with the range of stability seemingly being wider for pure nitrogen than for the nitrogen/oxygen mixture.Near ambient pressure the intervals open up and we are1e-040.0010.010.1200 250 300350 400 450 500 550S p e c t r a l D e n s i t y (a r b . u n i t s )Wavelength (nm)FIG.2:Spectra of constant emission (×)dissolved gas level 220nitrogen,(+)220mbar oxygen normalized with emission from stable air bubble.The curves are fitted black body radi-ation normalized within a constant with black body radiation at 14000K.Upper curve T =8000K,lower curve 6580K.Drive frequency 23200Hzable to measure the change in spectrum versus ampli-tude of the drive.Apart from type 2(only recycling state present),we also see the oscillating state observed by Hiller et al [3].These states look very much like those recently observed for air-seeded bubble at very low drives by Thomas et al [5].This suggests that these low inten-sity states from air-seeded bubbles have the same origin of being mainly nitrogen/oxygen bubbles.With gas levels of more than approximately 200mbar,we encounter the type 2recycling.This has essentially the same time scale of recycling as the air-seeded bub-bles,which strongly supports our explanation of type 2recycling having its origin in incomplete burn-off.Also it indicates the size R 0of the bubbles at breaking point to be of the same scale of approximately 6µm.This is cor-roborated by observation of an anisotropic 10%period doubling in the measurements of the 280mbar nitrogen bubble just before and at the level of type 2recycling.In Fig.1we display a 100s long timeseries obtained for a single bubble in water prepared at a dissolved gas level of 880mbar (nitrogen/oxygen (4:1)mixture)at room temperature and cooled to 9◦C.The amplitude of the drive is stepped up rapidly at 4distinct short time in-tervals with stable regions of emission in between,be-fore finally type 2recycling sets in.Note the overlap in regimes,as the bubble several times relapses into the quiet state,although the sound pressure is kept constant in this last part of the sequence.Since the emission is weak and narrow band optical filters are employed,the average number of photons recorded per flash is of the order of 1.Our claim of stability is therefore based on the absence of oscillations or peaking and the stability of the relative phase.3InFig.2we show spectra taken for stably emitting ni-trogen bubbles (dissolved gas level of 220mbar)and oxy-gen bubbles (220mbar).Especially the oxygen bubble is so weak that it can hardly be discerned by the unaided eye even after long time adjustment to complete dark-ness.These spectra are therefore obtained by freerun-ning the data acquisition cards at 5MHz alternatingly for a prolonged ing the information from the phaselocked sawtooth signal fed to both cards one can then obtain averaged flash intensities from the remain-ing 6channels with a highly improved signal/noise ratio.The spectra have been normalized by the spectrum of an air bubble driven at a sufficiently low level to ensure that the spectrometer is not overloaded.The latter spec-trum has in a separate experiment been shown to fit well to 14000K blackbody radiation in the regime of 300nm -700nm but dropping below this in the extreme ultravi-olet range (VUV)(see e.g.[6]).The spectra can be well fitted to black body radiation with temperatures 8000K and 6580for nitrogen respectively oxygen with the slight overshoot in the VUV range caused by the correspond-ing drop in the normalizing spectrum.By comparison a stable weakly radiating air-seeded bubble still displays a spectrum like that of the reference bubble apart from a scaling factor.The temperatures obtained are remark-able close to the expected dissociation temperatures for the gasses involved.The change in the spectrum when increasing the am-plitude in the type 2case displayed in Fig.1is shown in Fig.3.The spectrum starts out looking very much like those obtained for the stable case but gradually change to look like a blackbody spectrum.For comparison we have included the spectrum of a type 2state measured for a bubble where the dissolved gas is air at the same level of dissolution.In these figures the spectra are ob-tained as a long term average over many periods of the recycling.As seen the spectra look very similar giving further credence to the assumption that the mechanism behind is the same.The apparent temperatures are what would be ex-pected from bubbles that are inefficiently trying to burn the diatomic gasses.However,an interpretation in terms of actual temperatures,though tempting,is questionable,as the mechanism behind the emission is still unclear.In the following we shall concentrate on the nitrogen bubbles to keep the chemical picture as simple as possi-ble.At the low end of the nitrogen concentration we only see the stable state.At higher nitrogen levels we see the oscillating state akin to that observed by Thomas et al [5].The main feature of this state is an oscillation seen at all wavelengths so that the color temperature stays nearly constant,and with amplitude in phase with a cor-responding oscillation in radius.Unfortunately we are not able to calibrate our system well enough to tell the exact relation.If even small amounts of argon is allowed to diffuse0.010.11R e l a t i v e S p e c t r a l D e n s i t yWavelength (nm)FIG.3:Spectrum of the type 2recycling state at the end of Fig. 1.From bottom to top the drive amplitude is (⊡)130.0mV,( )130.5mV,(×)132.0mV,(+)133.4mV.As seen by comparison to Fig.2there is an overlap with the constant emission state.For comparison we have included the spectrum of a type 2state measured for a air-seeded bubble at the same level of dissolution ( ).The curve is black body radiation at 8000K normalized with black body radiation at 14000K for comparison.into the cell,the behavior changes dramatically.In what follows we show the result of a simple analysis on some examples of states observed for a nitrogen seeded bubble at 28%saturation contaminated with argon.Since we are not able to follow the bubble movements simultaneously with obtaining the spectrum,we resort to using the relative phase for calculating the bubble size [7].The model is based on the Rayleigh-Plesset equa-tions taking into account water vapor but disregarding the chemical processes.A problem is that for obvious reasons we are not able to use the dissociation theory to calculate the actual composition of the gas inside the bubble as we clearly deal with incomplete burn-off.The calibration can thus only be based on two fix-points,the occurrence of period doubling,and the onset of shape instability leading to type 2recycling.This fixes the bubble size to approximately 6-7µm at the onset of type 2behavior.The absolute pressure P a is more diffi-cult to assess.However,a knowledge of the cell gained from measurements on air seeded bubles leads us to adopt the value 1.5bar for the corresponding pressure.Assum-ing a constant average concentration of nitrogen in the bubble,a model calculation leads to c ≈0.001compared to the degassing level of c ≈0.3.From the diffusion equa-tion we find that the bubble must burn approximately 105molecules of nitrogen per flash which is the same order of magnitude as found for an air-seeded bubble [9].The spectral temperature is determined by fits to the blackbody spectrum which for the nitrogen spectrum fits quite well.For the oscillating state at drive levels be-low that of the stable state and a transient state into the4FIG.4:Timeseries obtained for a nitrogen bubble prepared with280mbar gas content showing a peaking state.The sound pressure converted from the drive voltage as described in the text is approximately1.42bar,Also shown are the fits for the ambient radius R0,apparent temperature T,and prefactor a.stable state,the apparent temperature alsooscillates or peaks.For the transient state(results shown in Fig.4), for most of the time the light emission is quite low com-pared to the stable emission.In the peaks,however,the emission goes up at all wavelengths but most in the ul-traviolent and actually overshoots the stable emission. At the same time the bubble is decreasing in size,the inference being that the bubble is trying to burn offni-trogen and turn into an argon dominated bubble.Due to the normalization with the known spectrum of an ar-gon bubble,the prefactor is proportional to a product of emitting surface area and duration offlash.Exact knowl-edge of these factors would be necessary for a complete analysis.Unfortunately,both parameters would be very hard to measure due to the short timescale involved.It is clear though,that the lower the drive and the smaller the bubble,the higher the apparent temperature.This trend,also found for air-seeded bubbles,could be con-nected with the presence of water vapor[8].Although it is difficult to get quantitative informa-tion from this analysis,some interesting information arise from assuming the bubble radius at the time of emis-sion to be proportional to R0,with a proportionality factor that is relatively independent of drive amplitude, and plotting the prefactor as function of the radius R0 squared.In Fig.5we present this kind of plot for an os-cillating state and a peaking state below the stable state, the transient state,and a peaking state above the stable state,together with an analysis for a type1state(air-seeded)at a similar level of degassing for comparison.As seen,in the case of pure nitrogen,the prefactors at small ambient radii are proportional to R02,but at higher val-1234567R02 (µm2)5:The prefactors as function of R02.P a1.36(+),1.391.42(⊡),1.45bar( ).Air-seeded bubble in type1mode (⊙).ues of the ambient radius saturation sets in.Naively one could therefore interpret the slopes to be proportional to theflash duration.A tentative explanation for the saturation could be that the actual volume of emission is smaller[10,11]than the actual bubble size.As the apparent temperatures do not show much variation,this interpretation is in fact relatively robust independent of whether volume or surface emission is assumed.In fact assuming volume emission would aggravate the problem of reconciliating the changes in emission with the changes in bubble size.We wish to stress that while the absolute values of R0and P a are naturally questionable,the func-tional dependences displayed in Figs.4&5are robust. The result for the recycling state of an air-seeded bub-ble is quite different.The recycling is of type1but having the hump that eventually results in type2recycling at higher levels of applied sound pressure.For small bub-ble radius,where the bubble according to our analysis of recycling states is mostly an air bubble wefind the same linear behavior as for the nitrogen bubble ending with a trend towards saturation before the shrinking associ-ated with the burn-offtakes over.Finally we observe a new linear increase associated with the continued argon intake.Stable states are all located to the right of the transient curves.To conclude we have shown the possibility of obtaining stable SBSL using non-noble gasses with total remove-ment of noble gasses as a critical condition for stability. The experiments confirm the interpretation of the newly found type2recycling mode as originating in incomplete burn-offof diatomic gasses.The presence of stable emis-sion is only permitted if the different gasses are prohib-ited from accumulating in the bubble.In the case of ni-trogen,the only chemical processes possible involve water vapor.This raises the intriguing question of whether the stability could be caused by hydrogen actually accumu-5lating in the bubble.Such an accumulation is,however, not possible for the stable oxygen seeded bubble where the only possible reaction products are H2O2and O3.It is worth noting that the black bodyfits give≈8000K for nitrogen,and≈6600K for oxygen which could be related to the known dissociation temperatures for these diatomic molecules.Finally,gas depletion in a boundary layer around the bubble might very well be an important factor.Furthermore,both the apparent higher tempera-tures for smaller bubbles and the saturation points to the amount of water vapor being an important factor.Obvi-ously an extension of the dissociation hypothesis also for air-seeded bubbles at low drive and/or low content argon is needed.We thank T.Matula and K.Musztacs for stimulat-ing discussions.The work is supported by the Danish National Science Foundation.∗Electronic address:levinsen@nbi.dk[1]J.S.Dam,M.T.Levinsen,Phys.Rev.Lett.174301(2005).[2]D.Lohse,M.Brenner,T.F.Dupont,S.Hilgenfeldt andB.Johnston,Phys.Rev.Lett.78,1359(1997).[3]R.Hiller,K.Weninger,S.J.Putterman,and B.P.Barber,Science266,248(1994).[4]M.T.Levinsen,N.Weppenaar,J.Seidelin Dam,G.Si-mon,and M.Skogstad,Phys.Rev.E68,035303(2003).[5]C.R.Thomas,R.R.Roy,and R.Glynn Holt,Phys.Rev.E70,066301(2004).[6]Note that this normalization should not be interpreted asthe emission from the air-seeded bubble necessarily being blackbody radiation.[7]G.Simon,and M.T.Levinsen,Phys.Rev.E67,026320(2003).[8]R.Toegel,B.Gompf,R.Pecha,D.Lohse,Phys.Rev.Lett.85,3165(2000).[9]Y.Didenko,and K.S.S¨u slick,Nature418,394-397(2002).[10]J.S.Dam,and M.T.Levinsen,Phys.Rev.Lett.92,144301(2004).[11]Carlos Camara,Seth Putterman,and Emil Kirilov Phys.Rev.Lett.92,124301(2004)[12]George Vazquez,C.Camara,S.J.Putterman,and K.Weninger Phys.Rev.Lett.88,197402(2002)。