空间插值方法介绍共36页
- 格式:ppt
- 大小:3.19 MB
- 文档页数:36


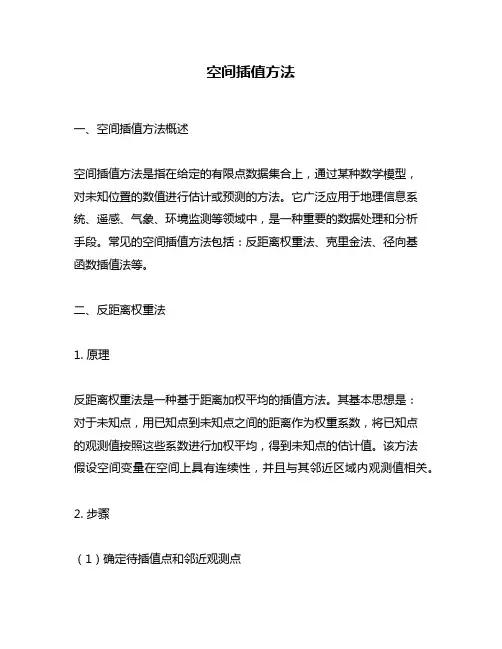
空间插值方法一、空间插值方法概述空间插值方法是指在给定的有限点数据集合上,通过某种数学模型,对未知位置的数值进行估计或预测的方法。
它广泛应用于地理信息系统、遥感、气象、环境监测等领域中,是一种重要的数据处理和分析手段。
常见的空间插值方法包括:反距离权重法、克里金法、径向基函数插值法等。
二、反距离权重法1. 原理反距离权重法是一种基于距离加权平均的插值方法。
其基本思想是:对于未知点,用已知点到未知点之间的距离作为权重系数,将已知点的观测值按照这些系数进行加权平均,得到未知点的估计值。
该方法假设空间变量在空间上具有连续性,并且与其邻近区域内观测值相关。
2. 步骤(1)确定待插值点和邻近观测点(2)计算待插值点与邻近观测点之间的欧式距离或曼哈顿距离等(3)根据距离计算每个邻近点的权重系数(4)将邻近点的观测值按照权重系数进行加权平均,得到待插值点的估计值3. 优缺点反距离权重法简单易懂,计算速度快,适用于数据密度较小、空间变异性较大的情况。
但其估计结果容易受到邻近点数量和距离的影响,可能出现插值误差较大的情况。
三、克里金法1. 原理克里金法是一种基于统计学原理的空间插值方法。
其基本思想是:通过对已知点之间的空间关系进行建模,利用半方差函数来描述变量在空间上的相关性,并通过最小二乘法求解出半方差函数中未知参数,从而得到未知位置处的预测值。
该方法假设空间变量在空间上具有稳定性,并且与其邻近区域内观测值相关。
2. 步骤(1)确定待插值点和邻近观测点(2)计算待插值点与邻近观测点之间的欧式距离或曼哈顿距离等(3)根据距离和半方差函数计算每个邻近点的权重系数(4)利用最小二乘法求解半方差函数中的未知参数(5)将邻近点的观测值按照权重系数进行加权平均,得到待插值点的估计值3. 优缺点克里金法能够考虑空间变异性和空间相关性,插值结果较为准确,但需要对半方差函数进行拟合,模型复杂度较高,计算量大。
四、径向基函数插值法1. 原理径向基函数插值法是一种基于核函数的空间插值方法。
空间插值方法1.反距离权重插值:通过与样本点距离大小赋予权重,距离近的样本点被赋予较大的权重,受该样本点的影响越大,同时可以限制插值点的个数、范围,通过幂值来决定样本点对插值点的影响程度,灵活性大,准确性高,但不太适用规则排列的插值点2.克里金插值:克里金插值与IDW插值的区别在于权重的选择,IDW仅仅将距离的倒数作为权重,而克里金考虑到了空间相关性的问题。
它首先将每两个点进行配对,这样就能产生一个自变量为两点之间距离的函数。
使用克里金插值需确定半变异函数的类型、步长、步数。
对于这种方法,原始的输入点可能会发生变化。
在数据点多时,结果更加可靠。
该插值方法对规则排列、较密集的点插值较适用,而离散的插值点则需进行多次调试才可达到较为理想的效果3.自然邻域插值:原理是构建voronoi多边形,也就是泰森多边形。
首先将所有的空间点构建成voronoi多边形,然后将待求点也构建一个voronoi多边形,这样就与圆多边形有很多相交的地方,根据每一块的面积按比例设置权重,这样就能够求得待求点的值了。
该方法不是通过数据模型来进行插值,不需要设置多于的参数,简便但不灵活,不适合离散点进行插值,因为会形成不规则插值边界,但插值结果相对符合实际数值、准确,适合规则排列、较密集的点插值。
4.样条函数插值:这种方法使用样条函数来对空间点进行插值,它有两个基本条件:1.表面必须完全通过样本点2.表面的二阶曲率是最小的。
插值主要受插值类型(Regularized 或Tension)和weight值的影响,一般Regularize 插值结果比Tension插值结果光滑,在Regularized Spline 插值中,weight 值越高生成的表面越光滑,Tension Spline 插值则相反;适合那些空间连续变化且光滑的表面的生成。
该方法虽可生成平滑的插值结果,但其结果会在原有样点值进行数值延伸,产生于实际不符的结果,不建议一般插值使用。
§1 插值概论1 插值用已知点来估算其他未知点的过程。
在GIS中,空间插值主要用于栅格数据,估算出栅格中每个单元的值。
空间插值是将点数据转换为面数据的一种方法。
2 需要插值的原因:现有数据不能完全覆盖所要求的区域;现有离散曲面的分辨率、像元大小、方向与要求不符;现有连续曲面的数据模型与要求不一致;3 内插和外推内插:在已观测点的区域内估算未观测点的数据的过程。
外推:在已观测点的区域外估算未观测点的数据的过程.——预测。
4 空间插值基础:控制点控制点分布;控制点密度;控制点的自相关程度§2 内插方法1 全局内插在整个区域用一个数学函数来表达地形曲面。
采用全部控制点计算未知点的数据。
2 局部内插将复杂的地形地貌分解成一系列的局部单元,在这些局部单元内部地形曲面具有单一的结构,由于范围的缩小和曲面形态的简化,用简单曲面就可较好的描述地形曲面。
采用样本控制点计算未知点的数据。
3 内插方法整体内插:趋势面分析;回归模型局部方法:泰森多边形(V oronoi边形,边界内插);反距离权内插;样条函数内插技术;克里金内插方法;密度估算4 趋势面分析的步骤数学曲面函数确定; 内插曲面的复杂程度;计算量;系数求解;最小二乘法;拟合精度分析5 整体内插缺点由于以下缺点,在空间内插中整体内插并不常用:整体内插函数保凸性较差:采样点的增减或移动都需要对多项式的系数作全面调整,从而采样点之间会出现难以控制的振荡现象,致使函数极不稳定,从而导致保凸性较差;多项式系数物理意义不明显解算速度慢且对计算机容量要求较高。
不能提供内插区域的局部地形特征;整体内插函数保凸性较差采样点之间会出现难以控制的振荡现象,致使函数极不稳定6 整体内插优点优点:整个区域上函数的唯一性、能得到全局光滑连续的空间曲面、充分反映宏观地形特征等。
在空间内插中,一般是与局部内插方法配合使用,例如在使用局部内插方法前,利用整体内插去掉不符合总体趋势的宏观地物特征。
7.空间插值7.1空间插值的概念和理论空间插值常用于将离散点的测量数据转换为连续的数据曲面,以便与其它空间现象的分布模式进行比较,它包括了空间内插和外推两种算法。
空间内插算法是一种通过已知点的数据推求同一区域其它未知点数据的计算方法;空间外推算法则是通过已知区域的数据,推求其它区域数据的方法。
在以下几种情况下必须作空间插值:1)现有的离散曲面的分辨率,象元大小或方向与所要求的不符,需要重新插值。
例如将一个扫描影象(航空像片、遥感影象)从一种分辨率或方向转换到另一种分辨率或方向的影象。
2)现有的连续曲面的数据模型与所需的数据模型不符,需要重新插值。
如将一个连续的曲面从一种空间切分方式变为另一种空间切分方式,从TIN到栅格、栅格到TIN或矢量多边形到栅格。
3)现有的数据不能完全覆盖所要求的区域范围,需要插值。
如将离散的采样点数据内插为连续的数据表面。
空间插值的理论假设是空间位置上越靠近的点,越可能具有相似的特征值;而距离越远的点,其特征值相似的可能性越小。
然而,还有另外一种特殊的插值方法——分类,它不考虑不同类别测量值之间的空间联系,只考虑分类意义上的平均值或中值,为同类地物赋属性值。
它主要用于地质、土壤、植被或土地利用的等值区域图或专题地图的处理,在“景观单元”或图斑内部是均匀和同质的,通常被赋给一个均一的属性值,变化发生在边界上。
7.2空间插值的数据源连续表面空间插值的数据源包括:●摄影测量得到的正射航片或卫星影象;●卫星或航天飞机的扫描影象;●野外测量采样数据,采样点随机分布或有规律的线性分布(沿剖面线或沿等高线);●数字化的多边形图、等值线图;空间插值的数据通常是复杂空间变化有限的采样点的测量数据,这些已知的测量数据称为“硬数据”。
如果采样点数据比较少的情况下,可以根据已知的导致某种空间变化的自然过程或现象的信息机理,辅助进行空间插值,这种已知的信息机理,称为“软信息”。
但通常情况下,由于不清楚这种自然过程机理,往往不得不对该问题的属性在空间的变化作一些假设,例如假设采样点之间的数据变化是平滑变化,并假设服从某种分布概率和统计稳定性关系。