干燥失重计算表格
- 格式:xls
- 大小:23.50 KB
- 文档页数:1

干燥失重计算方法咱先来说说这干燥失重是咋回事儿呀。
简单来讲,就是把东西拿去烘干,看看少了多少重量。
这在很多领域都挺重要的呢,就好比你烤面包,得知道水分跑了多少,才能掌握好面包的口感呀。
那怎么算这干燥失重呢?其实不难。
你就先称好样品原来的重量,然后把它放到合适的条件下烘干,烘完了再称称。
这前后的重量一对比,不就知道少了多少嘛。
比如说,你有一块巧克力,开始称的时候是 10 克。
然后你把它放到烤箱里,用合适的温度烘了一段时间。
拿出来再称,变成了 8 克。
那这少掉的 2 克不就是失去的重量嘛。
然后你用这失去的重量 2 克除以原来的重量 10 克,再乘以 100%,得到的 20%就是干燥失重率啦。
这就好像你有一袋苹果,你想知道水分蒸发了多少。
你先称一下整袋苹果的重量,然后让它们在太阳下晒一会儿,再称一次。
这两次的差值不就是水分跑掉的量嘛。
你可别小瞧这干燥失重计算呀,它用处可大着呢。
在制药行业,得保证药品的水分含量合适,不然药可能就不好使啦。
在食品行业,知道食物的干燥失重情况,就能调整制作工艺,让食物更好吃更耐保存。
你想想看,如果面包师不知道怎么算干燥失重,那做出来的面包不是干巴巴的就是湿哒哒的,那谁还爱吃呀。
或者药厂生产的药,水分太多或者太少,那能治病吗?所以说呀,这干燥失重计算真的很重要呢。
那在计算的时候有啥要注意的呢?首先,烘干的条件得把握好呀,温度呀、时间呀都得合适,不然结果可就不准确啦。
就好比烤蛋糕,温度太高或者时间太长,蛋糕就烤焦啦。
还有呀,称重量的时候得仔细点,别手抖称错了。
这就跟你数钱似的,得认真数,不然少了一块两块的不就亏啦。
总之呢,干燥失重计算虽然看起来简单,但是也得认真对待。
就像生活中的很多小事一样,你不注意它,它可能就会给你带来麻烦。
咱可不能小瞧了它呀!你说是不是呢?。

述烘箱干燥法测定药物干燥失重的步骤及计算方法1 简述1.1 药品的干燥失重系指药品在规定条件下干燥后所减失重量的百分率。
减失的重量主要是水、结晶水及其他挥发性物质,如乙醇等。
由减失的重量和取样量计算供试品的干燥失重。
1.2 干燥失重测定法(《中国药典》2010年版二部附录ⅧL)常采用烘箱干燥法、恒温减压干燥法及干燥器干燥法,后者又分常压和减压两种。
1.3 烘箱干燥法适用于对热稳定的药品;恒温减压干燥法适用于对热不稳定或其水分较难除尽的药品:干燥器干燥法适用于不能加热干燥的药品,减压有助于除去水分与挥发性物质。
2 仪器及用具2.1 扁形称量瓶2.2 烘箱控温精度+1℃。
2.3 恒温减压干燥器。
2.4 干燥器(普通)、减压干燥箱。
2.5 真空泵。
2.6 分析天平感量0.1mg。
3试药与试液。
干燥器中常用的干燥剂为硅胶、五氧化二磷、无水氯化钙。
恒温减压干燥箱中常用的干燥剂为五氧化二磷。
干燥剂应保持在有效状态,硅胶应显蓝色,五氧化二磷应呈粉末状,如表面旱结皮现象时应除去结皮物。
无水氯化钙应呈块状。
4 操作方法4.1 称取供试品取供试品,混合均匀(如为较大的结晶,应先迅速捣碎使成2mm以下的小粒),取约1g或各品种项下规定的重量,置与供试品同样条件下干燥至恒重的扁形称量瓶中(供试品平铺厚度不可超过5mm,如为疏松物质,厚度不可超过10mm),精密称定。
干燥失重在1.0%以下的品种可只做一份,1.0%以上的品种应同时做平行实验两份。
平铺于干燥至恒重的扁形称瓶中,厚度不超过5mm(疏松物质厚度不超过10mm)。

干燥失重测定的方法
干燥失重测定是一种常用的方法,用于确定样品中的水分含量。
下面是一种常用的干燥失重测定方法:
1. 准备样品:取一定量的样品并称重,记录初始质量。
2. 干燥样品:将样品放置在恒温恒湿条件下进行干燥。
常用的方法有烘箱法和微波炉法。
在烘箱法中,将样品放入预热至指定温度的烘箱中,在一定的时间间隔后取出样品,待冷却后称重,记录质量。
在微波炉法中,将样品放入微波炉中,在一定的时间间隔后取出样品,待冷却后称重,记录质量。
3. 持续干燥:重复第2步直到样品质量变化不大或干燥后质量连续两次称重相等为止。
这表示样品已经达到了完全干燥的状态。
4. 计算失重:使用下面的公式计算干燥失重:
干燥失重= (初始质量- 干燥后质量) / 初始质量×100%
干燥失重测定方法的关键在于确保样品在干燥的过程中不发生质量变化,以得到准确的水分含量结果。
因此,在进行干燥失重测定时,需要注意以下几点:
- 使用干燥方法时,应根据样品性质和要求确定合适的干燥温度和时间。
- 在每次称重前,应将样品置于恒温环境中,以防止重量变化的误差。
- 确保样品的取样量足够代表整个样品。
- 在烘箱法中,要在干燥过程中反复搅拌样品,以促进水分的挥发和均匀干燥。
- 在烘箱法中,应避免使用过高的温度,以免导致样品质量的代谢或降解。
总的来说,干燥失重测定是一种相对简单且常用的测定水分含量的方法,但在实际操作中需要注意一系列的技术细节,以保证测定的准确性和可靠性。
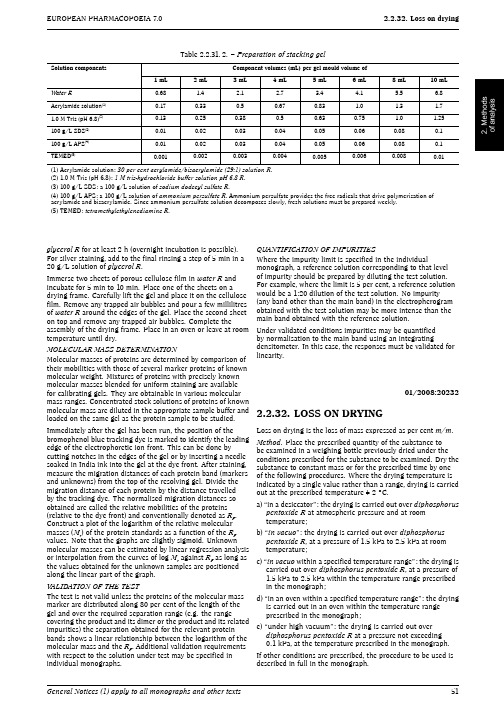
EUROPEAN PHARMACOPOEIA 7.0 2.2.32.Loss ondryingTable 2.2.31.-2.–Preparation of stacking gelComponent volumes (mL)per gel mould volume of Solution components1mL2mL 3mL 4mL 5mL 6mL 8mL 10mL Water R0.68 1.4 2.1 2.7 3.4 4.1 5.5 6.8Acrylamide solution (1)0.170.330.50.670.83 1.0 1.3 1.71.0M Tris (pH 6.8)(2)0.130.250.380.50.630.75 1.0 1.25100g/L SDS (3)0.010.020.030.040.050.060.080.1100g/L APS (4)0.010.020.030.040.050.060.080.1TEMED (5)0.0010.0020.0030.0040.0050.0060.0080.01(1)Acrylamide solution:30per cent acrylamide/bisacrylamide (29:1)solution R .(2)1.0M Tris (pH 6.8):1M tris-hydrochloride buffer solution pH 6.8R .(3)100g/L SDS:a 100g/L solution of sodium dodecyl sulfate R .(4)100g/L APS:a 100g/L solution of ammonium persulfate R .Ammonium persulfate provides the free radicals that drive polymerisation of acrylamide and bisacrylamide.Since ammonium persulfate solution decomposes slowly,fresh solutions must be prepared weekly.(5)TEMED:tetramethylethylenediamine R .glycerol R for at least 2h (overnight incubation is possible).For silver staining,add to the final rinsing a step of 5min in a 20g/L solution of glycerol R .Immerse two sheets of porous cellulose film in water R andincubate for 5min to 10min.Place one of the sheets on adrying frame.Carefully lift the gel and place it on the cellulose film.Remove any trapped air bubbles and pour a few millilitres of water R around the edges of the gel.Place the second sheet on top and remove any trapped air plete theassembly of the drying frame.Place in an oven or leave at room temperature until dry.MOLECULAR-MASS DETERMINATIONMolecular masses of proteins are determined by comparison of their mobilities with those of several marker proteins of known molecular weight.Mixtures of proteins with precisely known molecular masses blended for uniform staining are availablefor calibrating gels.They are obtainable in various molecularmass ranges.Concentrated stock solutions of proteins of known molecular mass are diluted in the appropriate sample buffer andloaded on the same gel as the protein sample to be studied.Immediately after the gel has been run,the position of thebromophenol blue tracking dye is marked to identify the leading edge of the electrophoretic ion front.This can be done by cutting notches in the edges of the gel or by inserting a needle soaked in India ink into the gel at the dye front.After staining,measure the migration distances of each protein band (markers and unknowns)from the top of the resolving gel.Divide the migration distance of each protein by the distance travelled by the tracking dye.The normalised migration distances soobtained are called the relative mobilities of the proteins(relative to the dye front)and conventionally denoted as R F .Construct a plot of the logarithm of the relative molecularmasses (M r )of the protein standards as a function of the R F values.Note that the graphs are slightly sigmoid.Unknown molecular masses can be estimated by linear regression analysis or interpolation from the curves of log M r against R F as long as the values obtained for the unknown samples are positioned along the linear part of the graph.VALIDATION OF THE TEST The test is not valid unless the proteins of the molecular mass marker are distributed along 80per cent of the length of the gel and over the required separation range (e.g.the range covering the product and its dimer or the product and its relatedimpurities)the separation obtained for the relevant proteinbands shows a linear relationship between the logarithm of themolecular mass and the R F .Additional validation requirementswith respect to the solution under test may be specified inindividual monographs.QUANTIFICATION OF IMPURITIESWhere the impurity limit is specified in the individualmonograph,a reference solution corresponding to that level of impurity should be prepared by diluting the test solution.For example,where the limit is 5per cent,a reference solution would be a 1:20dilution of the test solution.No impurity (any band other than the main band)in the electropherogram obtained with the test solution may be more intense than themain band obtained with the reference solution.Under validated conditions impurities may be quantified by normalisation to the main band using an integratingdensitometer.In this case,the responses must be validated for linearity.01/2008:202322.2.32.LOSS ON DRYING Loss on drying is the loss of mass expressed as per cent m/m .Method .Place the prescribed quantity of the substance to be examined in a weighing bottle previously dried under the conditions prescribed for the substance to be examined.Dry the substance to constant mass or for the prescribed time by one of the following procedures.Where the drying temperature is indicated by a single value rather than a range,drying is carried out at the prescribed temperature ±2°C.a)“in a desiccator”:the drying is carried out over diphosphorus pentoxide R at atmospheric pressure and at room temperature;b)“in vacuo ”:the drying is carried out over diphosphorus pentoxide R ,at a pressure of 1.5kPa to 2.5kPa at room temperature;c)“in vacuo within a specified temperature range”:the drying is carried out over diphosphorus pentoxide R ,at a pressure of 1.5kPa to 2.5kPa within the temperature range prescribed in the monograph;d)“in an oven within a specified temperature range”:the drying is carried out in an oven within the temperature range prescribed in the monograph;e)“under high vacuum”:the drying is carried out over diphosphorus pentoxide R at a pressure not exceeding 0.1kPa,at the temperature prescribed in the monograph.If other conditions are prescribed,the procedure to be used is described in full in the monograph.General Notices (1)apply to all monographs and other texts512.2.33.Nuclear magnetic resonance spectrometry EUROPEAN PHARMACOPOEIA7.001/2009:202332.2.33.NUCLEAR MAGNETIC RESONANCE SPECTROMETRYINTRODUCTIONNuclear magnetic resonance (NMR)spectrometry is an analytical method in particular suitable for the elucidation of the chemical structure of organic molecules by means of interpretation of their NMR spectra,arising from,for example,1H or the X-nuclei 13C,19F,15N,31P.The spectra can be used for qualitative and quantitative purposes.Under suitable experimental conditions,the integrated NMR intensities of the signals are directly proportional to the number of nuclear spins of the molecular group responsible for the signal.These integrals can be used for quantitative analysis.GENERAL PRINCIPLESPlacing an ensemble of nuclei with angular momentum and a magnetic moment in a static magnetic field (B 0)causes the nuclei to arrange themselves in different,quantum-mechanically controlled orientations in relation to the axis of the magnetic field.These orientations are different in energy.An oscillating high-frequency magnetic field (B 1),perpendicular to B 0,will cause transitions between these orientations with net energy absorption.According to the resonance condition ω0=γB 0(γ=gyromagnetic ratio,ω0=Larmor frequency),either the B 0magnetic field or the frequency (ω1)of the B 1field may be varied to achieve a spectrum (continuous wave (CW)method).Nowadays the B 1irradiation is achieved by the use of a radiofrequency (RF)pulse (Fourier transform (FT)method).The coherent radiation emitted during the return to the initial state is observed in the form of a decay curve,called the free induction decay (FID).Subsequent Fourier transformation gives the spectrum in the frequency domain,providing information about the molecular structure.Additional radiofrequency fields may be applied during acquisition of the FID signal to suppress scalar (through-bond)interactions between nuclei (called ‘decoupling’).One-and multi-dimensional techniques can be applied for qualitative and quantitative purposes,on samples in either the liquid or the solid state.Important structural information is derived from the following spectroscopic features:resonance frequencykind of nuclei observednumber of resonance signals (singlets,multiplets)number of chemically distinct groups of nuclei chemical shift δ(ppm)chemical nature and environment ofthe structural group observed intensity of resonance signals relative number of resonant nuclei per chemically distinct group multiplicity of coupling pattern number of nuclei that are scalar coupled to the observed nucleus coupling constant n J (Hz)number of bonds in the coupling pathway,and its geometryCorrelations of different spectral parameters (e.g.chemical shift and coupling constant,or chemical shifts of differentnuclei within one molecular system)can be performed by homo-and hetero-nuclear two-and higher-dimensional rmation about the relaxation times T 1and T 2,nuclear Overhauser effects (NOEs)and the kinetics of time-dependent processes are also accessible from appropriate experiments.APPARATUSA high-resolution NMR spectrometer consists of at least the following parts:—a magnet to deliver the constant magnetic field B 0;—a temperature-controlled probe to contain the sample,to deliver the radiofrequency pulse and to detect radiation emitted by the sample;—an electronic console to generate high-power radiofrequencypulses and to collect and digitise the FID signal;this unit also maintains the stability of the instrument electronics;—a data acquisition and processing unit (computer);and may also include:—a continuous flow cell for coupled liquid chromatographic-NMR or flow injection analysis;—a system for pulsed field gradient NMR.The high magnetic field is generated by a superconducting coil in a Dewar flask filled with liquid helium.The probe typically contains the sample in a 5mm-outer-diameter sample tube or in a flow cell,and is connected to the electronics cabinet by RF cables carrying lock,1H-,and X-nucleus frequencies.Additional devices for tuning and matching the electronic circuits are essential,and sample temperature control is often used.The NMR spectrometer should be demonstrated to be operating correctly.Appropriate tests to demonstrate this are,typically,measurement of linewidths at half height for defined peaks under defined acquisition conditions,signal-to-noise ratios (S/N )for standard mixtures,pulse power (measured as a 90°pulse width),and pulse reproducibility.All instrument manufacturers publish specifications and measurement protocols for these parameters for specific instrument/probe combinations,and compliance with these specifications should be demonstrated.FOURIER TRANSFORM NMR (FT-NMR)Contemporary spectrometers generally operate according to the Fourier transform (FT)principle:after exciting the sample with a radiofrequency pulse of appropriate frequency (ν),amplitude (B 1)and duration (τp )and a succeeding short dead time (t d )(to enable the electronics to recover),the amplified analogue FID signal is sampled during the acquisition time (t ac )and digitised with an analogue-to-digital converter (ADC),and the results are stored in the spectrometer memory.The receiver output is amplified prior to digitisation to maximise sensitivity without saturating the ADC.In case of observation of X-nuclei,the standard experiment includes,if necessary,broadband 1H decoupling,i.e.irradiation of all the protons during the experiment.To increase the S /N ,multiple FID signals may be accumulated coherently and summed.Fourier transformation of this time-domain data gives the frequency-domain spectrum.PARAMETERSThe following acquisition parameters influence the result of an FT experiment,and should be adjusted and controlled.Pulse width (τp ).The excitation pulse is directed along the x-axis of the so-called rotating frame,its duration (or ‘width’,τp )determines the flip angle (θ)and thus the intensity (I )of the resonance signal:(1)(2)The observed magnetisation M y is maximum at θ=90°.The pulse duration should be short to guarantee that all signals in the spectral width (SW )are excited to a similar degree.The magnetisation decays due to relaxation processes.Dead time (t d ).The dead time is the time between the end of the pulse and start of the acquisition,it is necessary for technical reasons and care should be taken as it may influence signal intensities and peak phase.Rapidly decaying signals (giving rise to broad spectral lines)are reduced in intensity by more than slowly decaying signals (which give rise to narrow spectral lines).Acquisition time (t ac ).The acquisition time (t ac )is related to the spectral width (i.e.the whole observed region)and the number of digital data points (DP )collected during signal acquisition.52See the information section on general monographs (cover pages)。

干燥失重测定方法
干燥失重是指将物质在一定温度下精密称量并加以烘烤,使其中的水分或其他挥发性成分挥发出去,然后再次精密称量,两次质量之差即为干燥失重。
以下是干燥失重测定方法:
1. 准备样品,根据需要将其研磨或切碎成均匀的粉末。
2. 精密称取样品的质量,尽量避免手接触样品。
3. 将样品放入干燥箱中,在一定温度下加以烘烤,常见的烘烤温度为105、110、150等。
若样品中含有易挥发性有机物,则需要进行低温干燥或真空干燥。
4. 烘烤时间通常为2-3小时,知道样品重量不再发生变化为止。
5. 取出样品,待其冷却至室温并称量其质量。
6. 计算干燥失重,即干样质量减去原始样品质量的百分比,计算公式为(M1-M2)/M2×100%。
其中M1为干样质量,M2为原始样品质量。
干燥失重的方法简单、准确,被广泛应用于化学、食品、药品等领域的分析和检测中。

干燥实验数据计算实例计算实例:空气物理性质的确定:流量计处空气温度t o =35.1(℃),查表得空气密度ρ=1.11(Kg/m 3) 湿球温度t w =38.6(℃),t w ℃下水的气化热(kJ/ kg) γtw =2590。
以第一组数据为例1、计算干基含水量X=(总重量G T -框架重量G D -绝干物料量G C )/绝干物料量G C=(150.8-88.5-24.48)/24.48=1.5499(kg/kg )2、计算平均含水量X A V =两次记录之间的平均含水量=(1.5499+1.4877)/2=1.5163(kg 水/kg 绝干物料)3、计算干燥速率U=-(绝干物料量GC/干燥面积S )*(△X/△T )=-(24.48*0.001/0.0232))*(1.4877-5499)/(3*60)=0.0003352 [kg/(s ·m 2)]4、绘制干燥曲线(X —T 曲线)和干燥速率曲线(U —X AV 曲线)5、计算恒速干燥阶段物料与空气之间对流传热系数α[W/m 2℃] wtw t t r Uc -=1000**α Uc —恒速干燥阶段的干燥速率,kg/(m 2?s )=0.0003352 γtw —t w ℃下水的气化热,kJ/ kg 。
查表P351,t c -t=374-38.6=335.4℃.查表得,γtw =2590 α=3.352*0.0001*2590*1000/(70-38.6)=27.656、计算干燥器内空气实际体积流量V t (m 3/ s) 。
1.3527370273*0258.027327300++=++?=t t V V t t 其中:=0.0287 V t0—t 0℃时空气的流量,m 3/ s ;12.1560*2*001256.0*65.02000==ρP A C V t =0.0258t 0—流量计处空气的温度,t 0=35.1℃;t —干燥器内空气的温度,t =70℃; C 0—流量计流量系数,C 0=0.65;A 0—流量计孔节孔面积,m 2。
检验原始记录
产品名称伊曲茶碱起始原料
检验目的干燥失重检验日期
检验依据伊曲茶碱起始原料IT-00质量标准(草案)报告日期
标准:减失重量应不得过1.0%
仪器:型恒温干燥箱
型电子分析天平
方法:照中国药典2010年版二部附录Ⅷ L进行。
取60℃干燥至恒重的扁形称量瓶,精密称定;再取样品约1.0g,置上述扁形称量瓶中,精密称定后放入干燥器中至恒重,精密称定,计算结果。
检查结果:
(1)将扁形称量瓶置60℃的真空干燥箱中2h,取出放在干燥器中冷却,精密称定;再次放入干燥箱1h,取出放在干燥器中冷却,精密称定;重复操作,直至最后两次的称量结果之差不超过0.3mg,视为恒重。
称量瓶恒重记录
(2)取适量样品,置于已经恒重的扁形称量瓶中,精密称定,将盖子放在称
量瓶旁边,置于真空干燥箱中,在60℃干燥2h,取出后放在干燥器中冷却,精密称量;重复此操作,直至最后两次的称量结果之差不超过0.3mg,视为恒重。
计算公式:
m2 – m3
干燥失重%=×100%
m1
样品干燥失重检查记录
结论:
检验人:
复核人:。
检验报告检品编号:检品名称:生产批次:生产日期:产品商标:产品包装:检验日期:检品数量:产品规格:报告日期:依据标准:SB/T 10379-2004 《速冻调制食品》检测依据:GB/T 5009.3~9-2003食品卫生检验方法理化部分(一)GB/T 4789.2.3-2008 食品卫生微生物学检验检验项目:感官、净含量、菌落总数、大肠菌群。
检验结果项目名称单位描述标准要求结果判定感官形态色泽组织香味杂质品温(中心温度)℃≤-18净含量g/袋菌落总数CFU/g ≤3000000本栏以下空白结论:检验人(签字):盖章签发人(签字):二〇〇年月日检验报告反应产品质量,与检验原始记录合并归当保存。
临沂市太合食品有限公司微生物检验原始记录样品编号第页/共页样品名称:检验前样品状态:□正常□异常仪器名称显微镜电热恒温培养箱仪器型号仪器编号检测依据:GB/T 4789.2-2008 食品卫生微生物学检验菌落总数测定GB/T 4789.3-2008 食品卫生微生物学检验大肠菌群计数检测程序:细菌菌落计数检测:取2~3个稀释度,做细菌菌落计数,36±1℃培养48h。
大肠菌群测定:取样品匀浆稀释液3个稀释度接种乳糖胆盐发酵管,做大肠菌群测定,初发酵36±1℃,24±2h,复发酵36±1℃,24±2h。
检测结果:1.细菌总数测定:取2~3个稀释度检验,36±1℃培养48h,做细菌菌落总数。
细菌总数稀释倍数10-110-210-310-4空白对照报告结果计数平皿1 细菌总数CFU/g 平皿22.大肠菌群计数:接种不同的样品稀释液于乳糖蛋白胨水培养基中,初发酵36±1℃经48±2h培养。
证实实验36±1℃经48±2h培养。
查检索表,报结果。
大肠菌群计数接种量(ml)接种管数初发酵结果分离染色结果复发酵结果报告结果+ —符合不符合+ —大肠菌群MPN/(100g)检验时间年月日时检毕时间年月日时检验人员:检验原始记录、检验报告合并装订归档。
2.2.32. LOSS ON DRYING 干燥失重(EP 2019)原理:干燥失重是指在特定条件下干燥后失去重量,按照百分比计算(m/m)。
干燥至恒重是指在根据规定的条件下连续两次称重的重量差异不超过0.5mg,且第二次称量检测是再进行30min的干燥后进行的设备设备通常包括:--由合适的惰性材料制成的称重瓶,可以很容易地干燥到恒质量;它们的直径足够大,所以要检测的物质层(厚度)不超过5毫米;--一种分析天平,通过它可以测定0.1毫克的质量变化;--根据所适用的程序,如干燥器、真空箱、真空炉或普通实验室炉;无论如何,炉温度可调(控制在)至指定温度的±2℃内;真空炉的压力至少可以减少(降低)到约2kpa是合适的。
烘箱是按照既定的质量体系程序进行检验的,例如通过使用适当的的经过认证参考物料(可以使用二水合氨基水杨酸钠用于设备认证CRS)设备可以使用经过证明是符合要求的其他适合的干燥手段,如微波,卤素灯,红外线灯,混合技术。
程序建议在对样本测量影响最小的环境中进行测试().称一个空的已经预先在待检测样品规定的干燥方法条件下干燥至少30min的称量瓶. 干燥至恒重或规定时间.当干燥温度用一个数值而不是一个范围来表示时,干燥是在规定的温度下的±2℃进行。
使用下列程序之一,除非专著另有规定--“在干燥器中”:在常压和室温下,用100克分子筛R进行干燥;--真空干燥:在不超过2.5Kpa的压力下,在室温或专著规定的温度下,用100克分子筛R进行干燥;--在规定温度的烘箱中:干燥是在烘箱中的大气压下按专著中规定的温度进行的。
在烤箱中干燥后,让称量瓶和样品在干燥器中冷却到室温,称含有干燥样品的称量瓶。
样品的质量是填满的称重瓶的质量和干的空称重瓶的质量之差。
干燥失重是指样品干燥前后样品的质量差,以百分比表示m/m。
计算实例:空气物理性质的确定:流量计处空气温度t o =35.1(℃),查表得空气密度ρ=1.11(Kg/m 3) 湿球温度t w =38.6(℃),t w ℃下水的气化热 (kJ/ kg) γtw =2590。
以第三组数据为例1、计算干基含水量X=(总重量G T -框架重量G D -绝干物料量G C )/绝干物料量G C=(148.0-88.5-24.48)/24.48=1.4306(kg/kg )2、计算平均含水量 X A V =两次记录之间的平均含水量=(1.4306+1.3611)/2=1.3958(kg 水/kg 绝干物料)3、计算干燥速率U=-(绝干物料量GC/干燥面积S )*(△X/△T )=-(24.48*0.001/0.0232))*(1.3611-4306)/(3*60)=0.0004071 [kg/(s ·m 2)]4、绘制干燥曲线(X —T 曲线)和干燥速率曲线(U —X AV 曲线)5、计算恒速干燥阶段物料与空气之间对流传热系数α[W/m 2℃] wtw t t r Uc -=1000**α Uc —恒速干燥阶段的干燥速率,kg/(m 2•s )=0.0003352 γtw —t w ℃下水的气化热,kJ/ kg 。
查表P351,t c -t=374-38.6=335.4℃.查表得,γtw =2590 α=3.352*0.0001*2590*1000/(70-38.6)=27.656、计算干燥器内空气实际体积流量V t (m 3/ s) 。
1.3527370273*0258.027327300++=++⨯=t t V V t t 其中: =0.0287 V t0—t 0℃时空气的流量,m 3/ s ;12.1560*2*001256.0*65.02000=∆⨯⨯⨯=ρP A C V t =0.0258t 0—流量计处空气的温度,t 0=35.1℃;t —干燥器内空气的温度,t =70℃; C 0—流量计流量系数,C 0=0.65;A 0—流量计孔节孔面积,m 2。