国际贸易chapter6
- 格式:ppt
- 大小:184.50 KB
- 文档页数:41

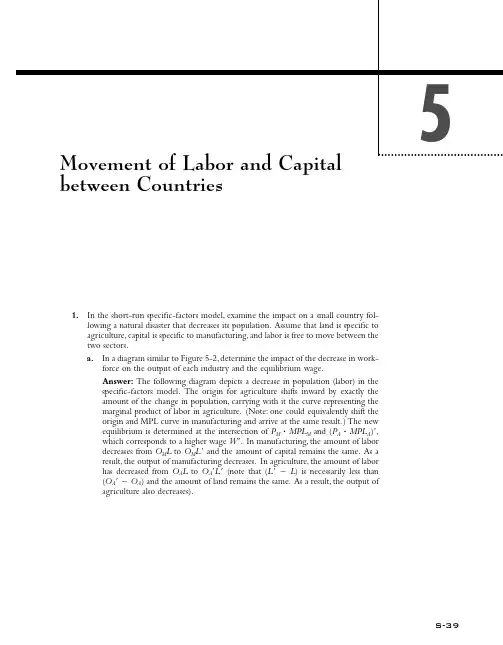
between Countries1.In the short-run specific-factors model, examine the impact on a small country fol-lowing a natural disaster that decreases its population. Assume that land is specific to agriculture, capital is specific to manufacturing, and labor is free to move between the two sectors.a.In a diagram similar to Figure 5-2, determine the impact of the decrease in work-force on the output of each industry and the equilibrium wage.Answer: The following diagram depicts a decrease in population (labor) in the specific-factors model. The origin for agriculture shifts inward by exactly the amount of the change in population, carrying with it the curve representing the marginal product of labor in agriculture. (Note: one could equivalently shift the origin and MPL curve in manufacturing and arrive at the same result.) The new equilibrium is determined at the intersection of P M ؒMPL M and (P A ؒMPL A )Ј,which corresponds to a higher wage W Ј. In manufacturing, the amount of labor decreases from O M L to O M L Јand the amount of capital remains the same. As a result, the output of manufacturing decreases. In agriculture, the amount of labor has decreased from O A L to O A ЈL Ј(note that (L ЈϪL ) is necessarily less than (O A ЈϪO A ) and the amount of land remains the same. As a result, the output of agriculture also decreases).S-39b.What happens to the rentals on capital and land?Answer: Because the quantity of labor in both industries decreases due to the nat-ural disaster, the marginal product of labor increases in both industries and the mar-ginal products of the industry-specific factors decrease. Because it is a small coun-try , the final output prices P A and P M remain unchanged; hence, the rental rate for capital, P M ؒMPK,decreases and the rental rate for land, P A ؒMPT ,decreases.2.How would your answer to problem 1 change if instead we use the long-run model,with shoes and computers produced using labor and capital?Answer: In the long-run model, a decrease in labor does not affect factor prices at all. Rather, the output of shoes and computers adjusts: according to the Rybczynski theorem, the output of the labor-intensive industry (shoes) decreases and the output of the capital-intensive industry (computers) increases. This point can be illustrated graphically as well, as in problem 3.3.Consider an increase in the supply of labor due to immigration, and use the long-runmodel. Figure 5-8 shows the box diagram and the leftward shift of the origin for the shoe industry. Redraw this diagram, but instead, shift to the right the origin for comput-ers.That is, expand the labor axis by the amount ⌬L,but shift it to the right rather than to the left. With the new diagram, show how the amount of labor and capital in shoes and computers is determined, without any change in factor prices. Carefully explain what has happened to the amount of labor and capital used in each industry and to the output of each industry.Answer: Keeping factor prices constant (i.e., W and R K constant), the K /L ratio in each industry remains unchanged. In the diagram below, this means that the slope of the arrows emanating from each origin stays the same even when the total endow-ments of capital or labor change. Shifting the origin for computers to the right ex-pands the horizontal axis and signifies the increase in labor due to immigration.Finding a new equilibrium involves scaling the arrows up or down from their re-spective origins to find a unique intersection. In this case, the only possible intersec-tion involves lengthening the shoes arrow and contracting the computers arrow. This illustrates the Rybczynski theorem: the output of the labor-intensive industry in-creases with additional labor in the economy (vice versa for the capital-intensive in-dustry). The new equilibrium is identical to that in Figure 5-8, so it does not matter to which industry the extra labor is initially added.S-40Solutions ■Chapter 5 Movement of Labor and Capital between CountriesWage, W W 1WO M O AL ЈL O A Ј4.In the short-run specific-factors model, consider a decrease in the stock of land. Forexample, suppose a natural disaster decreases the quantity of arable land used for planting crops.a.Redraw panel (a) of Figure 5-11 starting from the initial equilibrium at point A.Answer:b.What is the effect of this change in land on the quantity of labor in each indus-try and on the equilibrium wage?Answer: With less land per laborer in the agriculture sector, MPL A decreases.This is represented by an inward shift in the wage curve for agriculture and leads to a new equilibrium at point B.In words, wages in the agriculture sector drop,drawing labor into the manufacturing sector. The increased labor supply in theSolutions ■Chapter 5 Movement of Labor and Capital between CountriesS-41KO S L S K SO L O ЈC K ЈL ЈK ЈKL L ЈL Wage, W W O M O AL ЈW ЈLmanufacturing sector puts downward pressure on the wage. In the new equilib-rium, wages are once again equalized across industries at W ЈϽW ,manufactur-ing labor increases from O M L to O M L Ј, and agriculture labor decreases from O A L to O A L Ј.c.What is the effect on the rental on land and the rental on capital?Answer: In the manufacturing industry , the quantity of labor increases and the amount of capital remains the same (i.e., the labor/capital ratio increases). There-fore, the marginal product of capital increases due to the natural disaster because each unit of capital has more laborers working with it. As a result, the rental on capital, P M ؒMPK,increases. In agriculture, the result seems ambiguous at first.On one hand, the natural disaster decreases the stock of land, which increases the marginal product of land. On the other hand, the movement of labor from agri-culture to manufacturing decreases the marginal product of land. Which one of these effects is stronger? It is possible to answer this question by looking at the move from A to B in steps. Consider the contraction in the marginal product of labor in agriculture from A to C: The wage is held constant by (L ЈЈϪL ) workers leaving the agriculture industry. Because the wage has not changed, nor has the labor/land ratio or the rental on land. Then, allowing workers to migrate back into agriculture holding the amount of land fixed, going from C to B, the wage is depressed to W Јand the marginal product of land increases. Combining these steps, the land rental, P A ؒMPT ,increases from A to B.d.Now suppose that the international community wants to help the country struckby the natural disaster and decides to do so by increasing its level of FDI. So the rest of the world increases its investment in physical capital in the stricken coun-try. Illustrate the effect of this policy on the equilibrium wage and rentals.Answer: An increase in FDI increases the amount of capital in manufacturing,shifting out the wage curve in that sector. This has the effect of raising MPL M and hence wages, drawing additional labor into that sector. The new equilibrium occurs at a higher wage than after the disaster. (The total effect as compared with before the disaster will depend on the relative magnitude of the loss in land and inflow of capital, and is therefore ambiguous.) The agriculture sector shrinks fur-ther due to the capital inflow, but those still employed in it enjoy a higher wage than after the disaster. (W e do not know if the wage is higher or lower than be-fore the disaster.)S-42Solutions ■Chapter 5 Movement of Labor and Capital between CountriesWage, W WO M O AL ЈL ЈЈW ЈL5.According to part A of Table 5-1, what education level loses most (that is, has thegreatest decrease in wage) from immigration to the United States? Does this result depend on keeping the rental on capital constant? Explain why or why not.Answer: Holding capital fixed, the table shows immigration has the greatest negative impact on workers with very low or high levels of education and only a small nega-tive impact on those workers with mid-level education (12–15 years). The impacts are even smaller in the long run, when capital adjusts to keep the real return to cap-ital fixed in each industry: in that case, workers with very low or high levels of edu-cation lose due to immigration, but workers with mid-level education gain due to the immigration combined with the capital adjustment. The reason that the losses are smaller (and even become gains) in the long run is that immigration leads to capital growth in industries.6.Suppose that computers use 2 units of capital for each worker, so that K C ϭ2 ؒL C ,whereas shoes use 0.5 units of capital for each worker, so that K S ϭ0.5 ؒL S .There are 100 workers and 100 units of capital in the economy.a.Solve for the amount of labor and capital used in each industry. Hint:The boxdiagram shown in Figure 5-7 means that the amount of labor and capital used in each industry must add up to the total for the economy, so that:K C ϩK S ϭ100, and L C ϩL S ϭ100Use the facts that K C ϭ2 ؒL C and K S ϭ0.5 иL S to rewrite these equations as:2 ؒL C ϩ0.5 ؒL S ϭ100, and L C ϩL S ϭ100Use these two equations to solve for L C and L S ,and then calculate the amount of capital used in each industry using K C ϭ2 ؒL C and K S ϭ0.5 ؒL S .Answer: The above two equations can be solved as:2 ؒL C ϩ0.5 ؒL S ϭ1002 ؒL C ϩ2 ؒL S ϭ200Ϫ1.5 ؒL S ϭϪ100so that L S ϭ100 / 1.5 ϭ66.7. It follows from the same equations that L C ϭ33.3, and that K C ϭ2 ؒL C ϭ66.7 and K S ϭ0.5 ؒL S ϭ33.3.b.Suppose that the number of workers increases to 125 due to immigration, keep-ing total capital fixed at 100. Again solve for the amount of labor and capital used in each industry. Hint:Redo the calculations from part a, but using L C ϩL S ϭ125.Answer: The labor equations are now solved as:2 ؒL C ϩ0.5 ؒL S ϭ1002 ؒL C ϩ2 ؒL S ϭ250Ϫ1.5 ؒL S ϭϪ150so that L S ϭ150 / 1.5 ϭ100. It follows from the same equations that L C ϭ25,and that K C ϭ2 ؒL C ϭ50 and K S ϭ0.5 ؒL S ϭ50.Solutions ■Chapter 5 Movement of Labor and Capital between Countries S-43S-44Solutions ■Chapter 5 Movement of Labor and Capital between Countriesc.Suppose instead that the amount of capital increases to 125 due to FDI, keepingthe total number of workers fixed at 100. Again solve for the amount of laborand capital used in each industry.Hint:Redo the calculations from part (a), us-ing KCϩK Sϭ125.Answer: The first labor equation is now 2 ؒLCϩ0.5 ؒL Sϭ125, so the laborequations are solved as:2 ؒLCϩ0.5 ؒL Sϭ1252 ؒLCϩ2 ؒL Sϭ200Ϫ1.5 ؒL SϭϪ75so that LSϭ75 / 1.5 ϭ50. It follows from the same equations that L Cϭ50,and that KCϭ2 ؒL Cϭ100 and K Sϭ0.5 ؒL Sϭ25.d.Explain how your results in parts (b) and (c) are related to the Rybczynski the-orem.Answer: Comparing part (a) with part (b), the increase in the amount of laborin the economy has increased the amount of labor and capital devoted to shoes(from LSϭ66.7 and K Sϭ33.3 to L Sϭ100 and K Sϭ50) and decreased theamount of labor and capital devoted to computers (from LCϭ33.3 and K Cϭ66.7 to LCϭ25 and K Cϭ50).Therefore, the output of shoes increases and theoutput of computers decreases, due to the overall increase in labor. Shoes are la-bor-intensive because they use 0.5 units of capital per unit of labor, computersare capital-intensive because they use 2 units of capital per unit of labor. So thechange in outputs is in accordance with the Rybczynski theorem: the increase inlabor has increased the output of the labor-intensive good and decreased the out-put of the other good.Conversely, comparing part (b) with part (d), there has been an increase in theamount of capital in the economy. Consistent with the Rybczynski theorem,there has been a rise in the amount of labor and capital devoted to computer pro-duction (from LCϭ33.3 and K Cϭ66.7 to L Cϭ50 and K Cϭ100) and a fallin the amount of labor and capital devoted to shoe production (fromLSϭ66.7 and K Sϭ33.3 to L Sϭ50 and K Sϭ25).The following two questions explore the implications of the Rybczynski theorem and theFactor Price Insensitivity result for the Heckscher-Ohlin model, from Chapter 4.7.I n this question we use the Rybczynski theorem to review the derivation of theHeckscher-Ohlin theorem.a.Start at the no-trade equilibrium point A on the Home PPF in Figure 4-2, panel(a). Suppose that through immigration, the amount of labor in Home grows.Draw the new PPF and label the point B where production would occur withthe same prices for goods.Hint:Y ou can refer back to Figure 5-9 to see the ef-fect of immigration on the PPF.Answer: Figure 5-9, reproduced below, shows the shift in the Home PPF due tothe inflow of labor.With the same prices for goods, production occurs at pointB,with greater output of shoes and less output of computers, in accordance withthe Rybczynski theorem.b.Suppose that the only difference between Foreign and Home is that Foreign hasmore labor. Otherwise, the technologies used to produce each good are the same across countries. Then how does the Foreign PPF compare with the original Home PPF (without immigration) that you drew in part (a)? Is point B the no-trade equilibrium in Foreign? Explain why or why not.Answer: The Foreign PPF is shifted out and upward as compared with the orig-inal Home PPF , just like immigration shifted out the Home PPF. This result fol-lows because the only difference between Home and Foreign is that Foreign has more labor (but has the same technologies for producing the two goods as at Home). Therefore, the Foreign PPF is shifted out as compared with the original Home PPF , and is, in fact, identical to the Home PPF inclusive of the immigra-tion inflow. Assuming that point A is the no-trade equilibrium at Home, and that the two countries have the same tastes, then point B cannot be the no-trade equilibrium in Foreign. The reason for this is that because an indifference curve is tangent to the Home no-trade equilibrium at point A,then an indifference cannot also be tangent to point B.c.Illustrate a new point, A *, that is the no-trade equilibrium in Foreign. How dothe relative no-trade prices of computers compare in Home and Foreign? There-fore, what will be the pattern of trade between the countries, and why?Answer: The Foreign no-trade point A *is shown with an indifference curve tan-gent to it. The slope of the Foreign indifference curve at A *exceeds the slope of the Home indifference curve at A . Because the slopes of the indifference curves at the relative price of computers (the good on the horizontal axis), this proves that the no-trade relative price of computers in Foreign exceeds the no-trade relative price of computers at Home. With trade, Home will export computers (to obtain the higher relative price in Foreign), and Foreign will export shoes (to obtain the higher relative price at Home). Because Foreign is labor-abundant, this trade pat-tern is in accordance with the Heckscher-Ohlin theorem.Note: This question has redone the proof of the Heckscher-Ohlin theorem from the begin-ning of Chapter 4. Because we now have used the Rybczynski theorem in part (a), the comparison of the Home and Foreign PPFs is more precise than we achieved at the be-ginning of Chapter 4 (where we relied on an intuitive comparison of the two countries’PPFs).Solutions ■Chapter 5 Movement of Labor and Capital between CountriesS-45Output ofshoes, Q SOutput ofcomputers, Q C8.Continuing from problem 7, we now use the Factor Price Insensitivity result to com-pare factor prices across countries in the Heckscher-Ohlin model.a.Illustrate the international trade equilibrium on the Home and Foreign produc-tion possibility frontiers. Hint:Y ou can refer back to Figure 4-3 to see the inter-national trade equilibrium.Answer: The international trade equilibrium is as shown in Figures 4-3 and 4-4, with Home exporting computers and Foreign exporting shoes. Both coun-tries face the same world relative price of computers (or shoes).b.Suppose that the only difference between Foreign and Home is that Foreign hasmore labor. Otherwise, the technologies used to produce each good are the same across the countries. Then according to the Factor Price Insensitivity result, how will the wage and rental compare in the two countries?Answer: This is just like problem 7, where Foreign has more labor than Home but is otherwise identical. In particular, they face the same world relative price.So according to the Factor Price I nsensitivity result, the inflow of labor (into Foreign) has no effect on the wage or rental (as compared with those earned at Home). In other words, the wage and rental in the two countries are the same!This result is called the “factor price equalization” theorem and applies to coun-tries trading in the Heckscher-Ohlin model, where technologies are the same across countries.c.Call the result in part (b) “factor price equalization.” I s this a realistic result?Hint:Y ou can refer back to Figure 4-9 to see wages across countries.Answer: The “factor price equalization” theorem is a logical result in the Heckscher-Ohlin model, but it is not a very realistic result. In Figure 4-11 we showed that wage differs a great deal across countries, whereas the “factor price equalization” theorem would predict that wages are the same.d.Based on our extension of the Heckscher-Ohlin model at the end of Chapter 4,what is one reason why the “factor price equalization” result does not hold inr eality?Answer: The reason that the “factor price equalization” theorem does not hold in practice is that technologies differ quite a bit across countries, as we discussed at the end of Chapter 4. Just like we need to take into account the differences in technologies to obtain more realistic predictions about trade from the Heckscher-Ohlin model, so too we need to recognize that the differences in technologies will mean that factor prices differ across countries, even when they are engaged in free trade and the relative prices of goods are the same.9.Recall the formula ᎏR P ᎏϭᎏP P K ᎏ(i ϩd )from the application, “The Effect of FDI on Rentals and W ages in Singapore.” Give an intuitive explanation for this formula forthe rental rate. Hint:Describe one side of the equation as a marginal benefit and the other as a marginal cost.Answer: The equation above is one way to calculate the real returns to (rental of )capital, R /P.An intuitive way to think about this is to imagine that you are the owner of a unit of capital and you are considering whether to rent it out at the prevailing nominal rental rate, R,or to sell it and invest the proceeds. On one hand, you could sell each unit of capital for a price of P K and receive interest income on the proceeds of P K i.On the other hand, you could rent out the capital for a nominal payment of R and incur the direct depreciation cost of the asset of P K d.Thus, the nominal pay-ment you would require (R,the marginal benefit of rental) to make you indifferent between the two options would be P K i ϩP K d , the sum of direct costs of renting out and the opportunity cost of a sale (together, the marginal cost of rental). Dividing S-46Solutions ■Chapter 5 Movement of Labor and Capital between Countriesboth sides by the price level, P ,puts the equation into real terms and yields the de-sired equation.10.In Table 5-2, we show the growth in the real rental and real wages in Singapore, alongwith the implied productivity growth. One way to calculate the productivity growth is to take the average of the growth in the real rental and real wage. The idea is that firms can afford to pay labor and capital more if there is productivity growth, so in that case, real factor prices should be growing. But if there is no productivity growth,the average of the growth in the real rental and real wage should be close to zero.T o calculate the average of the growth in the real factor prices, we use the shares of GDP going to capital and labor. Specifically, we multiply the growth in the real rental by the capital share of GDP , and add the growth in the real wage multiplied by the labor share of GDP. Then answer:a.For a capital-rich country like Singapore, the share of capital in GDP is aboutone half and the share of labor is also one half. Using these shares, calculate the average of the growth in the real rental and real wage shown in each row of Table 5-2. How do your answers compare with the productivity growth shown in the last column of Table 5-2?Answer: As shown in column (3) of the table, when using a capital share of 0.5,as applies for a country like Singapore, the implied productivity growth is close to that in Table 5-2, shown in column (5).b.For an industrialized country like the United States, the share of capital in GDPis about one third, and the share of labor in GDP is about two thirds. Using these shares, calculate the average of the growth in the real rental and real wage shown in each row of Table 5-2. How do your answers now compare with the pro-ductivity growth shown in the last column?Answer: As shown in column (4) of the table, when using a capital share of 0.33,as applies for a country like the United States, the implied productivity growth is not as close to that in Table 5-2, shown in column (5).11.Figure 5-14 is a supply-and-demand diagram for the world labor market. Starting atpoints A and A *, consider a situation where some Foreign workers migrate to Home,but not enough to reach the equilibrium with full migration (point B ). As a result of the migration, the Home wage decreases from W to W ЉϾW Ј, and the Foreign wage increases from W *to W **ϽW Ј.a.Are there gains that accrue to the Home country? If so, redraw the graph andidentify the magnitude of the gains for each country. If not, say why not.Answer: Gains from trade in the following graph are analogous to consumer and producer surplus in the conventional supply and demand setting. In this case,Home employers are willing to pay up to W for the marginal product of laborSolutions ■Chapter 5 Movement of Labor and Capital between Countries S-47(3)(4)ProductivityProductivity (5)Using CapitalUsing Capital Productivity (1)(2)Share of 0.5 ϭShare of 0.33 ϭfrom Rental Wages (1) ؒ0.5 ϩ(2) ؒ0.5(1) ؒ0.33 ϩ(2) ؒ0.67Table 5-2Ϫ5.0 2.6Ϫ1.20.1Ϫ1.5Ϫ1.90.5Ϫ0.7Ϫ0.3Ϫ0.7Ϫ3.4 1.6Ϫ0.9Ϫ0.1Ϫ1.11.6 2.7 2.22.3 2.2Ϫ0.23.2 1.5 2.1 1.5Ϫ0.5 3.6 1.6 2.2 1.6that they obtain for W Љ; thus the gains to the Home country are illustrated by the horizontally striped triangle. Similarly, the immigrating Foreign workers are willing to supply their marginal product for a lower wage in the Foreign coun-try (W *) but receive a higher wage in the Home country (W **).b.Are there gains that accrue to the Foreign country? If so, again show the magni-tude of these gains in the diagram and show the world gains.Answer: Gains to Foreign (including foreign emigrants) are represented by the vertically striped triangle. Given positive gains to both countries, total gains from immigration are also positive in this model.12. A housekeeper from the Philippines is contemplating immigrating to Singapore insearch of higher wages. Suppose that the housekeeper earns approximately $2,000annually and expects to find a job in Singapore worth approximately $5,000 annu-ally for a period of 3 years. Furthermore, assume that the cost of living in Singapore is $500 more per year than at home.a.What can we say about the productivity of housekeepers in Singapore versus thePhilippines? Explain.Answer: Assuming that housekeeping is a perfectly competitive industry, house-keepers’ wages are equal to their marginal product of labor. Because wages are higher in Singapore, housekeepers there are more productive.b.What is the total gain to the housekeeper from migrating?Answer: The total gains from migrating are the net benefits relative to staying in the Philippines—that is, salary of $5,000 minus the opportunity cost of working in the Philippines of $2,000, minus the extra costs of living in Singapore of $500.Annual gains from migrating (over the first 3 years) are $2,500.c.Is there a corresponding gain for the employer in Singapore? Explain.Answer: The gains to the employer in Singapore depend on whether the wage is driven down by the migration, as shown in problem 11.S-48Solutions ■Chapter 5 Movement of Labor and Capital between CountriesWage, W OL ЈLWW ЈЈW ЈW **O *W *。

国际贸易实务笔记Chapter 1Introduction to International TradeKey words:Nation boder:过境FID:Foreign Direct investmentCustoms frontier:关境直接投资:Drect investment出口退税:export tax rebates 流动性过剩:excess liquidity东道国:host country 自给自足:self-suffucient经济资源:economic resources 商品交换;exchange of goods资金:capital 以物换物:barter出口拉动型经济增长:export-driven economic growth国际收支顺差:A favorable balance of payment逆差:An unfavorable balance of paymentMeans more money is flowing into a country than flowing out.贸易差额:balance of trade贸易顺差:trade surplus or A favorable balance of trade贸易逆差:trade deficit or A unfavorable balance of trade有/无形贸易:visible or invisible trade货物or 服务贸易:trade in goods or service国际贸易:international trade used by WTOWorld trade对外贸易:foreign trade 海外贸易:overseas trade国际发展委员会:national development and reform commission (NDRC)国际货币基金组织:international monetary fund (IMF)External demand:国外需求trade frictions: 贸易摩擦In the fore seeable future:短期内innovation of style:创新Shift orders:减少订单inquiry offer:询盘B/L;提单Offer:报盘 a fun set of documents:一套单据Firm offer:实盘sign a sales contract :签订销售合同Counter offer :还盘月/日/年(美)日/月/年(英)最好用英式表达Accept counter partner :交易对手Destination of International Trade:The business of buying and selling commodities beyond national borders走私:以任何行为逃避海关监管的行为。