如何用excel绘制横道图
- 格式:xls
- 大小:94.50 KB
- 文档页数:5
如何利用Excel绘制施工进度横道图
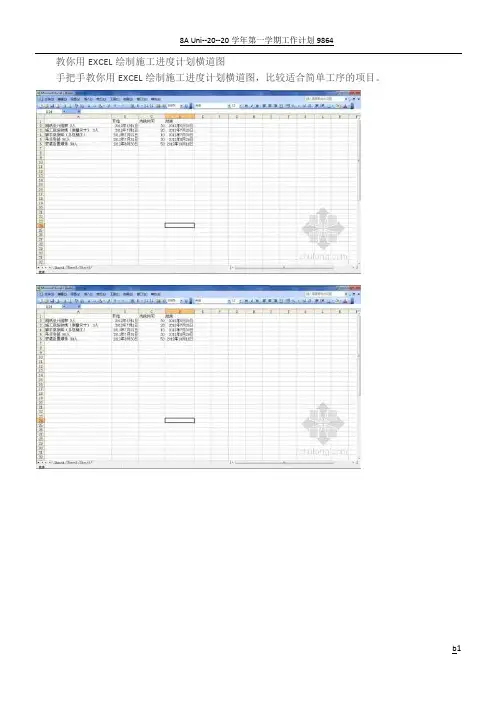
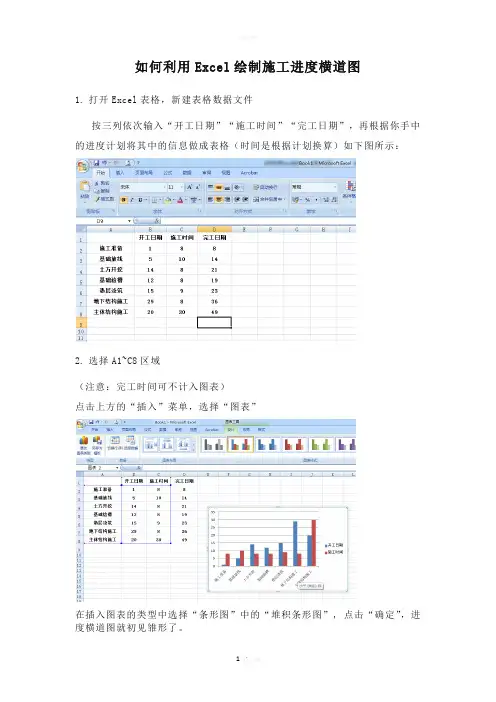
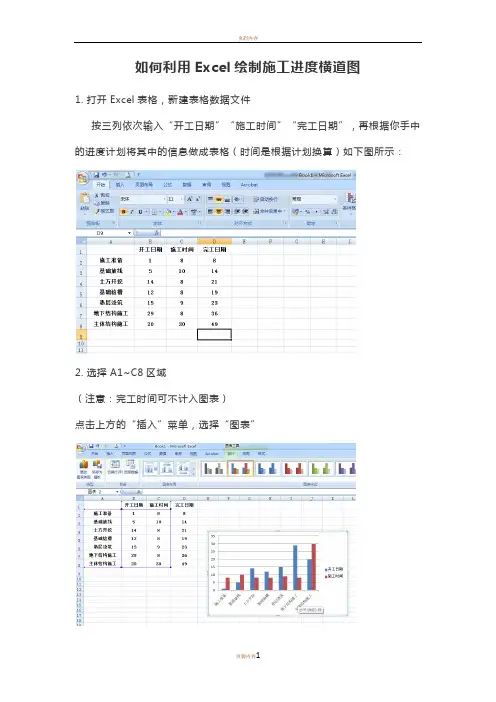
1.打开Excel表格,新建表格数据文件
按三列依次输入“开工日期”“施工时间”“完工日期”,再根据你手中的进度计划将其中的信息做成表格(时间是根据计划换算)如下图所示:
2.选择A1~C8区域
(注意:完工时间可不计入图表)
点击上方的“插入”菜单,选择“图表”
在插入图表的类型中选择“条形图”中的“堆积条形图”, 点击“确定”,进度横道图就初见雏形了。
3.虽然雏形出来了
但对比我们以前所认识的横道图还是需要调整。
在坐标纵轴上单击右键,选择“设置坐标轴格式”
坐标轴位置选择“刻度线之间”,同时选中“逆序类别”
这样就把所有类别都显示出来了,并且使得图表内容的显示和我们施工计划表的输入顺序保持一致。
4.右键选中蓝色条,单击,在菜单上选择“设置数据系列格式
将线条和颜色都设置成“无”,即“无填充”和“无线条”
再把每项工作的持续时间显示出来,将“数据标签”打钩
这样就大功告成了,生成施工进度计划横道图,大家还可以根据自己的喜好
去调整,如图所示:
欢迎您的下载,
资料仅供参考!
致力为企业和个人提供合同协议,策划案计划书,学习资料等等
打造全网一站式需求。
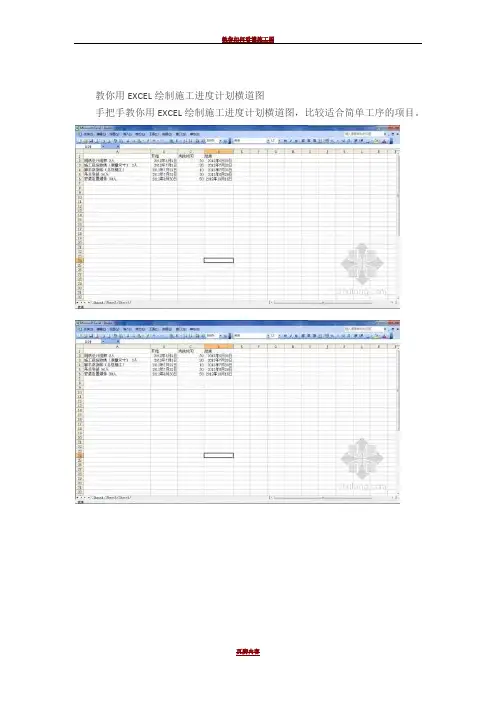
教你怎样用Excel 画横道图
众所周知,从事工程建设的,绘制施工进度计划图是一项重要的工作。
建设工程进度计划的表示方法有多种,常用的有“横道图”和“网络图”两类。
现在就让我们一起来看看如何用Excel 绘制建设工程进度计划图吧。
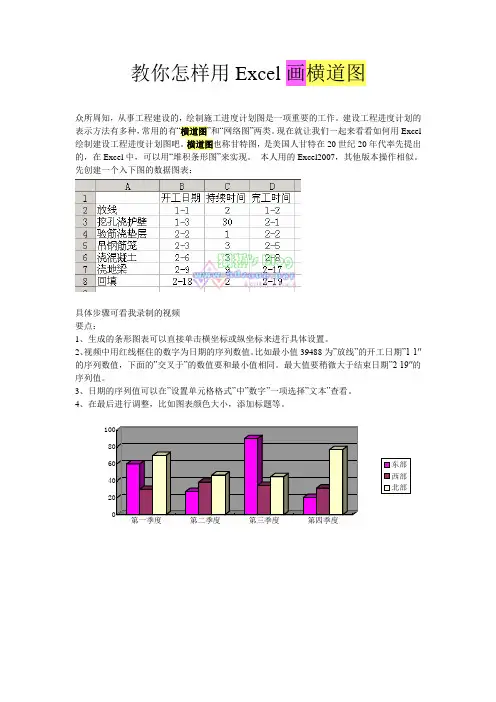
横道图也称甘特图,是美国人甘特在20世纪20年代率先提出的,在Excel 中,可以用
“堆积条形图”来实现。
本人用的Excel2007,其他版本操作相似。
先创建一个入下图的数据图表:
具体步骤可看我录制的视频
要点:
1、生成的条形图表可以直接单击横坐标或纵坐标来进行具体设置。
2、视频中用红线框住的数字为日期的序列数值。
比如最小值39488为”放线”的开工日期”1-1″的序列数值,下面的”交叉于”的数值要和最小值相同。
最大值要稍微大于结束日期”2-19″的序列值。
3、日期的序列值可以在”设置单元格格式”中”数字”一项选择”文本”查看。
4、在最后进行调整,比如图表颜色大小,添加标题等。

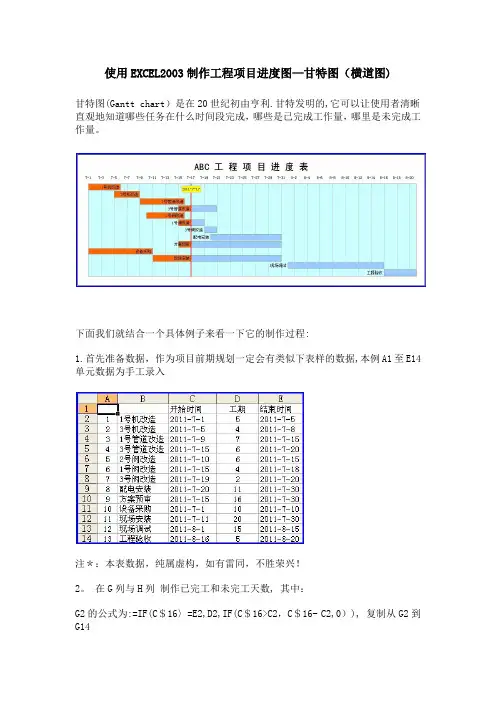
使用EXCEL2003制作工程项目进度图—甘特图(横道图)甘特图(Gantt chart)是在20世纪初由亨利.甘特发明的,它可以让使用者清晰直观地知道哪些任务在什么时间段完成,哪些是已完成工作量,哪里是未完成工作量。
下面我们就结合一个具体例子来看一下它的制作过程:1.首先准备数据,作为项目前期规划一定会有类似下表样的数据,本例A1至E14单元数据为手工录入注*:本表数据,纯属虚构,如有雷同,不胜荣兴!2。
在G列与H列制作已完工和未完工天数, 其中:G2的公式为:=IF(C$16〉=E2,D2,IF(C$16>C2,C$16- C2,0)), 复制从G2到G14H2的公式为:=IF(C$16〈=C2,D2,IF(C$16<E2,E2—C$16+1,0)), 复制从H2到H143. 继续加数据,B16到C18为手工输入。
D16、D17、D18分别等于C16、C17、C18。
然后将D16:D18单元格格式由日期改成数值型。
至于为什么需要做这部分数据,后文有述. 目前只需要知道EXCEL的日期数据,从本质上来讲就是一个整数。
4. 开始作图。
首先同时选择B1到C14 和 G1到H14 两个区域。
注意数据区域的选择是,先选中B1到C14,然后按住Ctrl键不放,再选择G1到H1。
5. 然后,单击工具栏上的图表向导,选择“条形图” 中的“堆积条形图”,然后直接点完成。
6。
如果您操作正确的话,出来的图应该是下面这个样子。
在右侧的“图列”上按鼠标右键,选“清除”,同时将图表区拉长拉宽一些,因为这个图可能会有些大。
7。
拖动图表大小差不多是从19行到42行,从A列到P列(行高和列宽为默认),这里顺便提一下图表上的一些元素名称,下文会经常用到。
8。
在图表区上按鼠标右键-—〉图表区格式 --> 在"字体"页选字号为9—-〉去除自动缩放前的钩选--> 确定9。
绘图区域内,选中蓝色的数据系列 --> 右键——〉数据系列格式10。

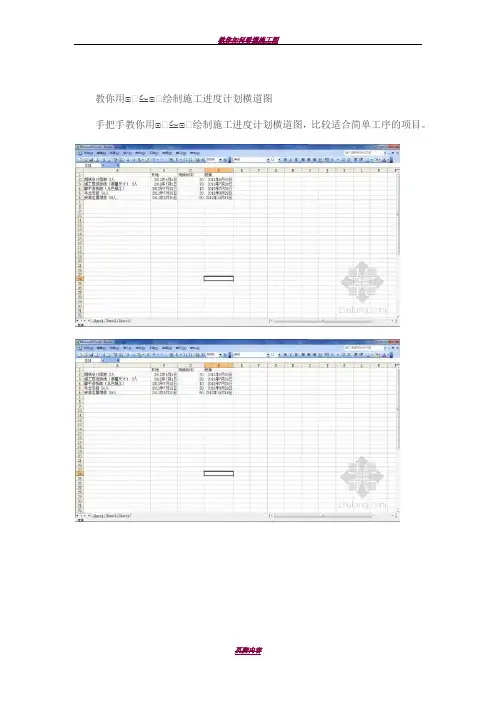
如何利用Excel绘制施工进度横道图
1. 打开Excel表格,新建表格数据文件
按三列依次输入“开工日期”“施工时间”“完工日期”,再根据你手中的进度计划将其中的信息做成表格(时间是根据计划换算)如下图所示:
2. 选择A1~C8区域
(注意:完工时间可不计入图表)
点击上方的“插入”菜单,选择“图表”
在插入图表的类型中选择“条形图”中的“堆积条形图”, 点击“确定”,进度横道图就初见雏形了。
3.虽然雏形出来了
但对比我们以前所认识的横道图还是需要调整。
在坐标纵轴上单击右键,选择“设置坐标轴格式”
坐标轴位置选择“刻度线之间”,同时选中“逆序类别”
这样就把所有类别都显示出来了,并且使得图表内容的显示和我们施工计划表的输入顺序保持一致。
4. 右键选中蓝色条,单击,在菜单上选择“设置数据系列格式
将线条和颜色都设置成“无”,即“无填充”和“无线条”
再把每项工作的持续时间显示出来,将“数据标签”打钩
这样就大功告成了,生成施工进度计划横道图,大家还可以根据自己的喜好去调整,如图所示:。
众所周知,从事工程建设的,绘制施工进度计划图是一项重要的工作。
现在就让我们一起来看看如何用Excel绘制建设工程进度计划图吧。
建设工程进度计划的表示方法有多种,常用的有“横道图”和“网络图”两类。
先让我们来看看横道图的制作吧。
横道图也称甘特图,是美国人甘特在20世纪20年代率先提出的,在Excel 中,可以用“悬浮的条形图”来实现。
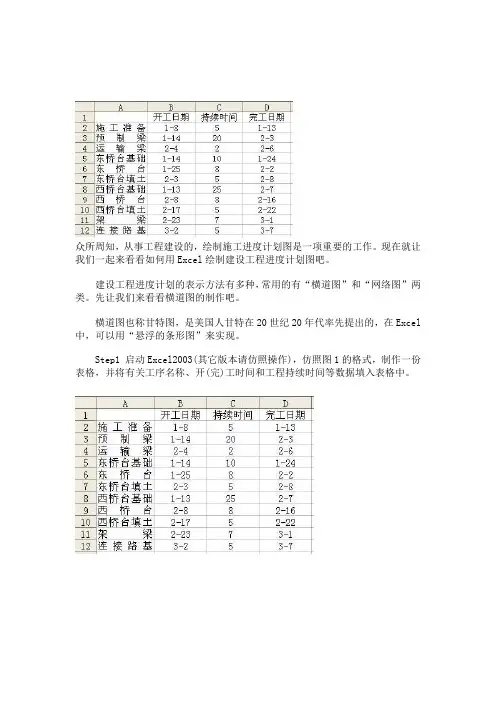
Step1 启动Excel2003(其它版本请仿照操作),仿照图1的格式,制作一份表格,并将有关工序名称、开(完)工时间和工程持续时间等数据填入表格中。
A1单元格中请不要输入数据,否则后面制作图表时会出现错误。
“完成时间”也可以不输入。
同时选中A1至C12单元格区域,执行“插入→图表”命令,或者直接按“常用”工具栏上的“图表向导”按钮,启动“图表向导?4步骤之一?图表类型”(如图2)。
Setp2 切换到“自定义类型”标签下,在“图表类型”下面的列表中,选中“悬浮的条形图”选项,单击“完成”按钮,图表插入到文档中。
然后用鼠标双击图表的纵坐标轴,打开“坐标轴格式”对话框,切换到“刻度”标签下,选中“分类次序反转”选项;再切换到“字体”标签下,将字号设置小一些,确定返回。
小技巧:经过此步操作,图表中有关“工序名称”就按开工顺序从上到下排列了,这样更符合我们的实际情况。
Step3 仿照上面的操作,打开横坐标轴的“坐标轴格式”对话框,在“刻度”标签中,将“最小值”和“交叉于”后面的方框中的数值都设置为“37994”(即日期2004-1-8的序列值,具体应根据实际情况确定,这个数值可以通过输入日期后在工作表中用常规格式可以看出来);同时,也在“字体”标签中,将字号设置小一些,确定返回。
调整好图表的大小和长宽比例,一个规范的横道图制作完成(图3)。
你也可以利用相应的设置对话框,修改图表的格式、颜色等设置,感兴趣的读者请自己练习设置。
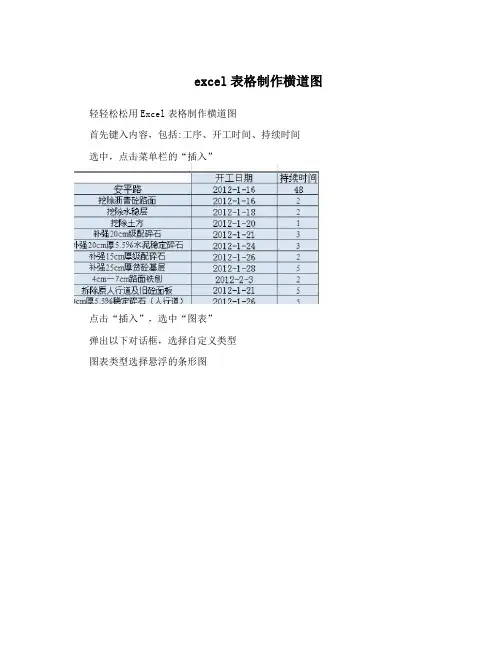
excel表格制作横道图轻轻松松用Excel表格制作横道图首先键入内容,包括:工序、开工时间、持续时间选中,点击菜单栏的“插入”点击“插入”,选中“图表”弹出以下对话框,选择自定义类型图表类型选择悬浮的条形图specifies a method of screening method for the determination of fineness of starch this standard applies to dried into a powder of refined starch. 1, definitions and principles of fineness of starch: starch samples sample screening samples obtained by dividing the weight of the sieve. To sample by dividing the weight of the sieve the sample weight expressed as a percentage of the original weight. Principle: the samples with a sample screen screening, get the sample by dividing the weight of the sieve. 2, instruments and scales: the precision of 0.1g. Sample screen: screen number 100. Step 3, analysis sample preparation: samples should be fully mixed. Sample volume: mix weighing the sample 50g, accurate to 0.1g, evenly pour the sample sieve. Screening: shake the sample sieve evenly, until the screen down so far. Carefully pour out the sample sieve residue on weighing, accurate to 0.1g. Determination of the number: measured on the same sample twice. 4, theresults of the calculation method applied to sample by sample sieve weight expressed as a percentage of the original weight of the sample, as in the formula: x--sample size,%; MO--the original weight of the sample, g; Sift the ML--sample weight of residue on the sieve, g. Such as poor meets the requirements, take the arithmetic mean of the second determination as a result. Results one decimal. 6.2 allowing differential analyst simultaneously or in quick succession for the second determination, the absolute value在这里可以打入标题、选择是否要网格线完成后,得到下图点击Y轴,弹出对话框specifies a method of screening method for the determination of fineness of starch this standard applies to dried into a powder of refined starch. 1, definitions and principles of fineness of starch: starch samples sample screening samples obtained by dividing the weight of the sieve. To sample by dividing the weight of the sieve the sample weight expressed as a percentage of the original weight. Principle: the samples with a sample screen screening, get the sample by dividing the weight of the sieve. 2, instruments and scales: the precision of 0.1g. Sample screen: screen number 100. Step 3, analysis sample preparation: samples should be fully mixed. Sample volume: mix weighing the sample 50g, accurate to 0.1g, evenly pour the sample sieve. Screening: shake the sample sieve evenly, until the screen down so far. Carefully pour out the sample sieve residue on weighing, accurate to 0.1g. Determination of the number: measured on the same sample twice. 4, the results of the calculation method applied to sample by sample sieve weight expressed as a percentage of the original weight of the sample, as in the formula: x--sample size,%; MO--the original weight of the sample, g; Sift the ML--sample weight of residue on the sieve, g. Such as poor meets the requirements, take the arithmetic mean of the seconddetermination as a result. Results one decimal. 6.2 allowing differential analyst simultaneously or in quick succession for the second determination, the absolute value选中“分类次序反转”修改一下字体specifies a method of screening method for the determination of fineness of starch this standard applies to dried into a powder of refined starch. 1, definitions and principles of fineness of starch: starch samples sample screening samples obtained by dividing the weight of the sieve. To sample by dividing the weight of the sieve the sample weight expressed as a percentage of the original weight. Principle: the samples with a sample screen screening, get the sample by dividing the weight of the sieve. 2, instruments and scales: the precision of 0.1g. Sample screen: screen number 100. Step 3, analysis sample preparation: samples should be fully mixed. Sample volume: mix weighing the sample 50g, accurate to 0.1g, evenly pour the sample sieve. Screening: shake the sample sieve evenly, until the screen down so far. Carefully pour out the sample sieve residue on weighing, accurate to 0.1g. Determination of the number: measured on the same sample twice. 4, the results of the calculation method applied to sample by sample sieve weight expressed as a percentage of the original weight of the sample, as in the formula: x--sample size,%; MO--the original weight of the sample, g; Sift the ML--sample weight of residue on the sieve, g. Such as poor meets the requirements, take the arithmetic mean of the second determination as a result. Results one decimal. 6.2 allowingdifferential analyst simultaneously or in quick succession for the second determination, the absolute value点击X轴,弹出对话框修改字体大小修改刻度的最小值,注意“最小值”必须跟“基底(X平面)交叉于(C)”数值保持一致specifies a method of screening method for the determination of fineness of starch this standard applies to dried into a powder of refined starch. 1, definitions and principles of fineness of starch:starch samples sample screening samples obtained by dividing the weight of the sieve. To sample by dividing the weight of the sieve the sample weight expressed as a percentage of the original weight. Principle: the samples with a sample screen screening, get the sample by dividing the weight of the sieve. 2, instruments and scales: the precision of 0.1g. Sample screen: screen number 100. Step 3, analysis sample preparation: samples should be fully mixed. Sample volume: mix weighing the sample 50g, accurate to 0.1g, evenly pour the sample sieve. Screening: shake the sample sieve evenly, until the screen down so far. Carefully pour out the sample sieve residue on weighing, accurate to 0.1g. Determination of the number: measured on the same sample twice. 4, the results of the calculation method applied to sample by sample sieve weight expressed as a percentage of the original weight of the sample, as in the formula: x--sample size,%; MO--the original weight of the sample, g; Sift the ML--sample weight of residue on the sieve, g. Such as poor meets the requirements, take the arithmetic mean of the second determination as a result. Results one decimal. 6.2 allowingdifferential analyst simultaneously or in quick succession for the second determination, the absolute value确定后得到下图,调整一下大小,就OK啦用excel制作横道图就是这么简单,你也可以试试~specifies a method of screening method for the determination of fineness of starch this standard applies to dried into a powder of refined starch. 1, definitions and principles of fineness of starch: starch samples sample screening samples obtained by dividing the weight of the sieve. To sample by dividing the weight of the sieve the sample weight expressed as a percentage of the original weight. Principle: the samples with a sample screen screening, get the sample by dividing the weight of the sieve. 2, instruments and scales: the precision of 0.1g. Sample screen: screen number 100. Step 3, analysis sample preparation: samples should be fully mixed. Sample volume: mix weighing the sample 50g, accurate to 0.1g, evenly pour the sample sieve. Screening: shake the sample sieve evenly, until the screen down so far. Carefully pour out the sample sieve residue on weighing, accurate to 0.1g. Determination of the number: measured on the same sample twice. 4, the results of the calculation method applied to sample by sample sieve weight expressed as a percentage of the original weight of the sample,as in the formula: x--sample size,%; MO--the original weight of the sample, g; Sift the ML--sample weight of residue on the sieve, g. Such as poor meets the requirements, take the arithmetic mean of the second determination as a result. Results one decimal. 6.2 allowing differential analyst simultaneously or in quick succession for the second determination, the absolute value。
一个Excel表格做横道图的强悍实例
步骤1:点插入——图表——自定义类型——管状图步骤2:点下一步——数据区域(如选取已做好的表格A1-D20)步骤3:确认后--点列——下一步步骤4:标题(图标标题-某某工程进度计划;-数值(Y)轴——填计划说明)——点完成
步骤5:双击工序名称——刻度(选分类次序反转)——确定(字体及其他根据需要调整)
步骤6:双击日期——刻度(最小值和交叉与都填41105为最先7月15日数值;主要刻度单位为日期7天一标;次要刻度单位1为每天)
步骤7:双击银色横条——边框、内部全部选无步骤8:右键点横条上日期——选清除步骤9:双击边缘底色——区域——选无
步骤10:双击开始前横线——选无,即开始时间横线不显示,只显示持续时间,这才是常规的横道图要看到的东西。
方法也可以选
右键单击横道显示出数据系列格式(o)对话框
步骤11:双击进度横道线——边框、内部选取相同颜色
步骤12:右键点图中间——图表选项——网格线——选X,Y 轴主要网格线
步骤13:双击工程工序——刻度——选数值(Y)轴置于分类之间步骤14:右键点图中间——图表选项——数据表——图例步骤15:双击非X\Y轴线上需要改变的字体大小——改字体和大小;根据需要移动表格至中间,说明移到底边,就全部搞定了。
步骤16:20行以内插入行和删除行,改变工序名称以及其他相关时间,工程计划会自动生成,无限制行。
项目编号和项目名称填写在一个格内,对齐方式调整不了靠左,调整为左对齐方法为在项目名称栏目后面加空格键填满空,(至闪动光标与项目名称所在单元格右边框重合)。
施工进度计划图是一项重要的工作。
现在就让我们一起来看看如何用Excel绘制建设工程进度计划图吧。
建设工程进度计划的表示方法有多种,常用的有“横道图”和“网络图”两类。
先让我们来看看横道图的制作吧。
横道图也称甘特图,是美国人甘特在20世纪20年代率先提出的,在Excel中,可以用“悬浮的条形图”来实现。
仿照操作),仿照图1的格式,制作一份表格,并将有关工序名称、开(完)工时间和工程持续时间等数据A1单元格中请不要输入数据,否则后面制作图表时会出现错误。
“完成时间”也可以不输入。
同时选中A1至C12单元格区域,执行“插入→图表”命令,或者直接按“常用”工具栏上的“图表向导”按钮,启动“图表向导—4步骤之一—
图表类型”(如图2)。
填入表格中。
下,在“图表类型”下面的列表中,选中“悬浮的条形图”选项,单击“完成”按钮,图表插入到文档中。
然后用鼠标双击图表的纵坐标轴,打开“坐标轴格式”对话框,切换到“刻度”标签下,选中“分类次序反转”选项;再切换到“字体”标签下,将字号设置小一些,确定返回。
表中有关“工序名称”就按开工顺序从上到下排列了,这样更符合我们的实际情况。
Step3 仿照上面的操作,打开横坐标轴的“坐标轴格式”对话框,在“刻度”标签中,将“最小值”和“交叉于”后面的方框中的数值都设置为“37994”(即日期2004-1-8的序列值,具体应根据实际情况确定);
同时,也在“字体”标签中,将字号设置小一些,确定返回。
例,一个规范的横道图制作完成(图3)。
你也可以利用相应的设置对话框,修改图表的格式、颜色等设置,
感兴趣的读者请自己练习设置。