流式细胞内抗原及细胞因子检测staining intracellular antigens for flow-cytometry
- 格式:pdf
- 大小:248.04 KB
- 文档页数:9
流式细胞术检测细胞内细胞因子的研究进展【摘要】:细胞因子具有调节细胞生长、分化成熟、功能维持、调节免疫应答、参与炎症反应、创伤愈合和肿瘤消长等多种生物学功能。
因此,细胞因子的研究成果为临床上预防、诊断、治疗疾病提供了科学基础,特别是利用细胞因子治疗肿瘤、感染、造血功能障碍、自身免疫性疾病等,具有非常广阔的应用前景[1]。
随着细胞表面标记及胞内细胞因子标记流式细胞技术的出现,使对胞内细胞因子的研究推向了一个新的阶段。
流式细胞术也成为了检测单细胞水平细胞因子表达能力的重要检测方法。
本文针对流式细胞术在胞内细胞因子检测中的研究进展作一综述。
【关键词】:流式细胞术;细胞内;细胞因子;检测技术引言:细胞因子(cytokine,CK)是由多种组织细胞(主要为免疫细胞)所合成和分泌的小分子多肽或糖蛋白,能介导细胞之间的相互作用,并在抵抗外来病原及维持机体内环境平衡中起到重要作用。
细胞因子的检测方法一般分为生物学测定法、分子生物学测定法及免疫学测定法。
而目前用于检测单个细胞特定细胞因子表达的手段则包括:多参数流式细胞术,酶联免疫斑点法ELISPOT[2]、原位杂交、免疫细胞化学、限制性稀释分析(limiting dilution analysis,LDA)和单细胞PCR等生物分析技术。
相较于其它的检测方法,流式细胞术在细胞内细胞因子的检测上具有高效、简便、适应性广等优势。
一、流式细胞术的概述流式细胞术(flow cytometry,FCM)是一种能够对单个细胞或生物微颗粒的生物学性质进行定量分析和分选的检测手段,具有快速、高精度、高准确性、多参数和高通量等优点,是目前先进的细胞定量分析技术之一。
FCM能够快速分析单个细胞或粒子的多种特性,既可以定性,也可以定量,尤其适用于大量样品检测,已在临床检验工作中得到广泛应用。
流式细胞仪(fluorescenceactivated cell sorter,FACS)的检测分析已涉及到细胞生物学、免疫学、肿瘤学、遗传学、血液学、微生物学等学科。

冻存对细胞因子诱导的杀伤细胞免疫表型及细胞内因子表达的影响王菲;王丽萍;张震;岳冬丽;段秀芳;张斌;张毅【摘要】目的:探讨冻存对外周血来源的细胞因子诱导的杀伤细胞( CIK)免疫表型及细胞内因子表达的影响。
方法:采集10例癌症患者的外周血,采用Ficoll两步法分离外周血单个核细胞,用细胞因子诱导培养得CIK。
收集冻存3个月后复苏4、24、72 h的CIK,采用流式细胞术及胞内染色法检测细胞穿孔素、颗粒酶B及干扰素-γ的表达水平,采用AnnexinV/PI双染法检测细胞活性。
以未冻存的新鲜CIK作对照。
结果:冻存前及复苏4 h后CIK颗粒酶B及干扰素-γ表达水平差异无统计学意义(t=1.029、0.237,P>0.05)。
冻存前及复苏4、24、72 h后CIK穿孔素表达水平分别为(35.97±7.12)%、(10.00±6.04)%、(17.60±3.92)%和(35.20±6.23)%,差异有统计学意义(F=47.480,P<0.001),冻存后CIK穿孔素表达水平显著降低,随着复苏时间的延长,穿孔素表达水平逐渐恢复正常。
复苏4、24、72 h后CIK活细胞比例逐渐增多(P<0.05),复苏72 h后活细胞比例接近100%,细胞活性恢复正常。
结论:冻存可能使CIK细胞亚型发生改变。
%Aim: To explore the effects of cryopreservation on cytokine-induced killer cell ( CIK ) immunophenotype and intracellular cytokineexpression .Methods:Peripheral blood mononuclear cells from ten patients with cancer were iso-lated by Ficoll-Plaque density gradients and CIKs were obtained by incubating with appropriate cytokines .The secretion levels of perforin, granzyme-B and interferon-γin CIK cryopreserved for 3 months and recovered for 4,24,and 72 h were detected by flow cytometryassay and intracellular staining , and cellular activity were detected by PI and AnnexinV stai-ning.The fresh CIKs were the control .Results:There was no significant difference in the levels of granzyme-B or interfer-on-γbetween fresh CIK and those recovered for 4h(t=1.029,0.237,P>0.05).However, the level of perforin in fresh CIK, those recovered for 4,24,and 72 h cells were (35.97 ±7.12)%,(10.00±6.04)%,(17.60 ±3.92)% and (35.20 ±6.23)%, and there was significant difference (F=47.480,P<0.001);the expression level in perforin cryopre-served CIK decreased and gradually reached to the normal level with time .Cellular activity of CIK also recovered gradually(P<0.05).Conclusion:Cryopreservation might change the cell subtypes of CIK .【期刊名称】《郑州大学学报(医学版)》【年(卷),期】2014(000)001【总页数】4页(P11-14)【关键词】细胞因子诱导的杀伤细胞;细胞内因子;冻存;免疫表型【作者】王菲;王丽萍;张震;岳冬丽;段秀芳;张斌;张毅【作者单位】郑州大学生物工程系郑州 450001; 郑州大学第一附属医院生物治疗中心郑州450052;郑州大学第一附属医院肿瘤科郑州 450052;郑州大学生物工程系郑州 450001; 郑州大学第一附属医院生物治疗中心郑州450052;郑州大学第一附属医院生物治疗中心郑州450052; 郑州大学第一附属医院肿瘤科郑州 450052;郑州大学第一附属医院生物治疗中心郑州450052; 郑州大学第一附属医院肿瘤科郑州 450052;郑州大学第一附属医院生物治疗中心郑州450052; 美国西北大学医学院芝加哥60611;郑州大学生物工程系郑州 450001; 郑州大学第一附属医院生物治疗中心郑州450052; 郑州大学第一附属医院肿瘤科郑州 450052; 河南省高等学校临床医学重点学科开放实验室郑州 450052【正文语种】中文【中图分类】R392-33#通讯作者,男,1964年4月生,博士,教授,研究方向:肿瘤免疫学、肿瘤干细胞和生物细胞治疗,E-mail:***************.cn细胞因子诱导的杀伤细胞(cytokine-induced killer cell, CIK)是一群异质性免疫活性细胞,具有较强的抗肿瘤能力[1]。
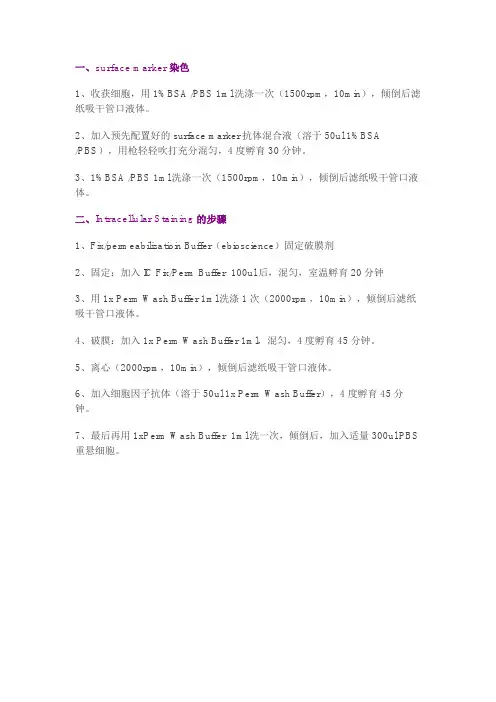
一、surface marker染色
1、收获细胞,用1%BSA /PBS 1ml洗涤一次(1500rpm,10min),倾倒后滤纸吸干管口液体。
2、加入预先配置好的surface marker抗体混合液(溶于50ul 1%BSA
/PBS),用枪轻轻吹打充分混匀,4度孵育30分钟。
3、1%BSA /PBS 1ml洗涤一次(1500rpm,10min),倾倒后滤纸吸干管口液体。
二、Intracellular Staining的步骤
1、Fix/permeabilizatioin Buffer(ebioscience)固定破膜剂
2、固定:加入IC Fix/Perm Buffer 100ul 后,混匀,室温孵育20分钟
3、用1x Perm Wash Buffer 1ml洗涤1次(2000rpm,10min),倾倒后滤纸吸干管口液体。
4、破膜:加入1x Perm Wash Buffer 1ml,混匀,4度孵育45分钟。
5、离心(2000rpm,10min),倾倒后滤纸吸干管口液体。
6、加入细胞因子抗体(溶于50ul 1x Perm Wash Buffer),4度孵育45分钟。
7、最后再用1xPerm Wash Buffer 1ml洗一次,倾倒后,加入适量300ul PBS 重悬细胞。
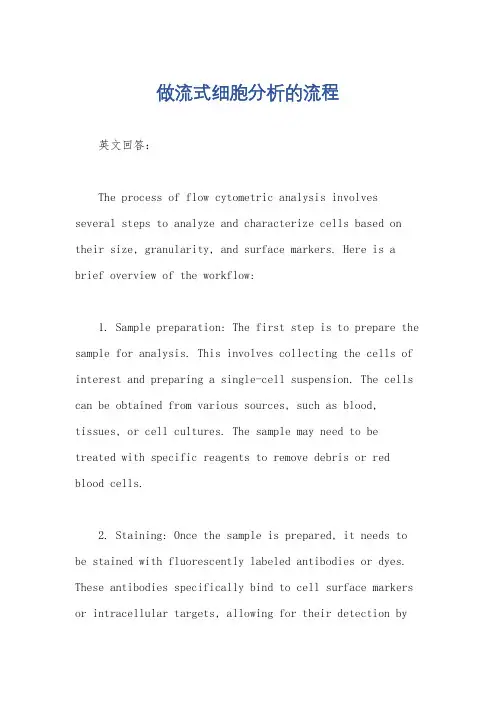
做流式细胞分析的流程英文回答:The process of flow cytometric analysis involves several steps to analyze and characterize cells based on their size, granularity, and surface markers. Here is a brief overview of the workflow:1. Sample preparation: The first step is to prepare the sample for analysis. This involves collecting the cells of interest and preparing a single-cell suspension. The cells can be obtained from various sources, such as blood, tissues, or cell cultures. The sample may need to be treated with specific reagents to remove debris or red blood cells.2. Staining: Once the sample is prepared, it needs to be stained with fluorescently labeled antibodies or dyes. These antibodies specifically bind to cell surface markers or intracellular targets, allowing for their detection bythe flow cytometer. Different fluorochromes are used to label different markers, enabling the simultaneous detection of multiple parameters.3. Instrument setup: Before running the sample on the flow cytometer, the instrument needs to be properly set up. This involves adjusting the laser power, detector voltages, and compensation settings. Calibration beads are often used to ensure accurate and consistent measurements.4. Data acquisition: The sample is then loaded into the flow cytometer, which passes the cells through a laser beam one at a time. As the cells pass through the laser, they scatter light and emit fluorescence. The scattered light and fluorescence signals are collected by detectors and converted into electronic signals, which are then processed by the software.5. Data analysis: Once the data is acquired, it needs to be analyzed to extract meaningful information. Flow cytometry software allows for the visualization and gating of the cell populations of interest. Gating involvessetting regions or gates on dot plots or histograms to identify specific cell populations based on their marker expression. The software can generate various statistical measurements, such as cell counts, percentages, and mean fluorescence intensity.6. Interpretation: Finally, the results of the flow cytometric analysis need to be interpreted. This involves comparing the data to known standards or control samples and drawing conclusions based on the observed cell populations and marker expression patterns. The interpretation may also involve additional statistical analyses or correlation with other experimental parameters.中文回答:流式细胞分析的流程包括几个步骤,用于根据细胞的大小、颗粒度和表面标记物等特征对其进行分析和表征。
流式细胞术检测胞内细胞因子的经验分析颜彩玲;张慧;周瑞祥【摘要】目的探讨流式细胞术检测胞内细胞因子的注意事项.方法制备小鼠脾脏淋巴细胞悬液.采用细胞表面抗原CD4、CD25及细胞核内因子FOXP3染色检测调节T细胞,胞内因子TNF-α的检测采用PMA/Iono-mycin,anti-CD3/CD28,PMA/Ionomycin与anti-CD3/CD28联合3种方案进行刺激,比较不同刺激条件下TNF-α胞内因子的表达情况,培养后各组细胞悬液采用固定破膜处理技术进行细胞表面抗原CD3、CD4及细胞内因子TNF-α染色.结果脾脏淋巴细胞悬液制备中研磨、裂解红细胞及染色过程中破膜等操作的不当,均导致前向/侧向(FSC/SSC)点图中目的细胞群模糊不清,从而影响后续分析.新鲜脾脏淋巴细胞得率、CD3+T淋巴细胞得率及TNF-α表达率与冻存的脾脏各类细胞比较,差别无统计学意义(P>0.05).胞内因子TNF-α检测结果显示,刺激组PMA/Ionomycin以及anti-CD3/CD28表达率显著高于未刺激组(P<0.05),PMA/Ionomycin与anti-CD3/CD28联合刺激组的表达率也显著高于未刺激组和独立刺激组(P<0.05).结论流式细胞术胞内细胞因子的检测有很多影响因素,包括脾脏细胞悬液制备中的研磨、裂解红细胞操作,染色处理过程中的破膜、固定,上机检测过程中补偿的调节、对照的设置等均影响实验结果,检测前应注意摸索选择适合待测胞内因子的测定条件.%Objective To investigate factors that may affect the detection of intracellular cytokines with flow cytometry . Methods Splenocytes from mice were disaggregated , and regulatory T cells (Treg) were detected by staining of CD4 ,CD25 ,and intranuclear transcription factor FOXP3 . Forthe detection of TNF-α,splenocytes were stimulated withPMA/Ionomycin ,anti-CD3/CD28 or PMA/Ionomy-cin plus anti-CD3/CD28 ,respectively . Following activation ,the cells were stained with anti-CD3 APC and anti-CD4 FITC ,then intracellularly stained to detect TNF-α after fixation and permeabilization . Controls were designed for both experiments . Results The improper operations in the grinding ,lysing erythrocytes ,fixing and perming the cells all leaded to indistinct target cells of interest in the FSC /SSC dot plots ,which affected the subsequent analysis . There were no significant differences in the percentages of lymphocytes ,CD3+ T lymphocytes ,and TNF-α p roducing cells between the fresh and frozen samples (P>0 .05) . Expression of TNF-αin cells stimulated by PMA/Ionomycin ,anti-CD3/CD28 ,or combined stimulation groups were significantly higher than controls (P<0 .05) . Conclusion Many factors may af-fect the detection of intracellular cytokines by flow cytometry ,including the spleen ,lysing erythrocytes in the preparation of splenocytes suspension ,fixing and perming the cells duringdyeing ,adjusting the com-pensation values ,designing controlled trials and so on . Therefore ,attentions should be paid to explore and select the suitable conditions for studying intracellular factors before testing .【期刊名称】《福建医科大学学报》【年(卷),期】2017(051)005【总页数】8页(P303-310)【关键词】流式细胞术;细胞因子类;小鼠【作者】颜彩玲;张慧;周瑞祥【作者单位】福建医科大学基础医学院 ,福州 350122;福建医科大学新药安全性评价中心,福州 350122;福建医科大学基础医学院 ,福州 350122【正文语种】中文【中图分类】R332;R341.1;R392.21;R977.6辅助性T淋巴细胞(T helper, Th)是人体内免疫系统的重要组成部分。
流式细胞术在免疫学研究中的应用流式细胞术(Flow Cytometry,FCM)是一种对细胞进行自动分析和分选的技术。
它可以快速、准确地测量细胞的物理和化学性质,如大小、形状、表面标志物、核酸含量等。
在免疫学研究中,流式细胞术已经成为了一种重要的研究工具,广泛应用于免疫细胞的分型、功能和活化状态的检测等方面。
1. 免疫细胞分型:流式细胞术可以通过检测细胞表面标志物的表达,对免疫细胞进行分型。
例如,可以通过检测 CD4 和 CD8 分子的表达,将 T 细胞分为辅助性 T 细胞(CD4+)和杀伤性 T 细胞(CD8+);通过检测 CD19 分子的表达,将 B 细胞分为 B1 和 B2 细胞等。
2. 免疫细胞功能检测:流式细胞术可以通过检测细胞内的分子,如细胞因子、活性氧等,来评估免疫细胞的功能。
例如,可以通过检测细胞内的干扰素-γ(IFN-γ)和肿瘤坏死因子-α(TNF-α)的表达,来评估 T 细胞的活化状态和功能。
3. 免疫细胞活化状态检测:流式细胞术可以通过检测细胞表面标志物的表达和细胞内的分子,来评估免疫细胞的活化状态。
例如,可以通过检测 CD69 和 HLA-DR 分子的表达,来评估 T 细胞的早期活化状态;通过检测 CD25 和 FoxP3 分子的表达,来评估调节性 T 细胞(Treg)的活化状态。
4. 免疫细胞分选:流式细胞术可以根据细胞的物理和化学性质,对细胞进行分选。
例如,可以通过分选 CD4+ T 细胞和 CD8+ T 细胞,来进行 T 细胞的功能研究;通过分选调节性 T 细胞(Treg),来进行 Treg 细胞的功能研究等。
总之,流式细胞术在免疫学研究中具有重要的应用价值,可以帮助我们更好地了解免疫细胞的分型、功能和活化状态,为免疫学研究提供了有力的技术支持。
流式胞内细胞因子检测I.导言单细胞胞内细胞因子分析方法在持续不断改进中,分析技术包括ELISPOT,原位杂交(in situ hybridization),免疫组织化学(immunohistochemistry),有限稀释分析和单细胞PCR等。
相比较流式细胞术是一种强大的分析技术,可以同时分析单个细胞的多个参数,包括大小和粒度,以及由荧光抗体表征的表面和细胞内标记物的表达。
胞内细胞因子和趋化因子对应的荧光标记单克隆抗体应用已经非常成熟,也适用于混合细胞群内胞内染色和多色分析。
表面和胞内相结合的多色免疫荧光染色提供了一种高分辨率方法,用于鉴定表达特定细胞因子的细胞的性质和频率。
已经有非常多的应用案例如细胞因子表达受限制的(如,Th4与Th2样)或不受限制的(如,Th0)各种细胞类型的分析。
除了能够同时对单个细胞进行高特异性和高灵敏的多个参数同时测量外,该方法还能够快速收集大量细胞信息,进行统计学意义上的分析。
胞内细胞因子的染色取决于细胞因子特异性单克隆抗体的鉴定,及其与固定-透化过程的相容性。
已经报道了使用多聚甲醛固定和用去污剂皂苷对细胞膜透化的组合的最佳细胞内细胞因子染色。
多聚甲醛固定允许保持细胞形态和细胞内抗原性,同时还使细胞能够承受去污剂的透化作用。
皂苷的膜透化使细胞因子特异性单克隆抗体穿透内质网和高尔基体的细胞膜,胞质溶胶和膜。
细胞因子染色的关键参数包括:细胞类型和激活方案-活化后细胞收获的时间-细胞活化过程中包含蛋白质转运抑制剂-和抗细胞因子抗体的选择等。
II.一般方法A.刺激细胞已经报道了各种用于刺激细胞产生细胞因子的体外方法。
多克隆活化剂包括有:佛波酯和钙离子载体;植物血凝素;葡萄球菌肠毒素B;和针对TCR/CD3复合物亚基的单克隆抗体(有或没有针对共刺激受体如CD28的抗体)。
注意:据报道,单独使用PMA进行细胞活化会导致小鼠T细胞表面CD4表达的瞬时丧失;用PMA和钙离子载体一起活化细胞会引起CD4表达的更大和更持久的降低,以及小鼠胸腺细胞、小鼠和人外周T淋巴细胞中CD8表达的降低。
细胞因子的流式检测细胞内细胞因子的流式细胞仪检测一、简介随着研究的进展,仅仅对细胞进行定量和活性的检测已不能满足需要。
在单细胞水平研究细胞因子的表达能力对研究细胞因子在疾病中的作用越来越显的重要无比。
目前检测单个细胞特定细胞因子的表达手段包括:ELIspot、原位杂交、免疫细胞化学、限制性稀释分析(limiting dilution analysis,LDA)和单细胞PCR,应用原位杂交技术和免疫组化方法观察细胞因子蛋白表达及mRNA表达可以识别Th1和Th2细胞,此方法可获得较强的细胞内信号,但此方法工作量大、主观性强,难以进行大样本检测,且人肉眼识别能力有很大的局限性,而ELISPOT及单细胞PCR技术,技术性强、劳动强度大,难以进行广泛推广。
随着多标记及胞内细胞因子标记流式细胞技术的出现,使对细胞内细胞因子的研究推向了一个新的阶段。
下面主要对胞内细胞因子流式细胞技术作以介绍。
TH1与TH2(IL-4,IL-5,IL-10),但这些研究很难外推,因为T细胞克隆与体内T细胞功能相关性还未被揭示。
早期细胞因子表达与细胞功能相关性研究是基于特定克隆细胞的激活。
尽管研究应用T淋巴细胞克隆证明了不同细胞因子的合成,如TH1(IL-2,IFN- ) 近来,Jung与Picker采用了monensin、PMA等药物预孵,用Brefeldin(BFA)、Monensin阻断了胞内高尔基体介导的转运的方法使得细胞因子聚集,蓄积,增强细胞因子信号可被流式细胞仪检测。
因为自然状态下,T淋巴细胞产生少量的细胞因子,通常要对T淋巴细胞体外活化进行研究。
在体外刺激过程中,T淋巴细胞产生的细胞因子已释放出来,胞内细胞因子信号较弱,难以进行检测。
这一方法可检测单个细胞内多个细胞因子,并可区分表达特定细胞因子的细胞亚群。
在细胞水平该方法证明了人与鼠的淋巴细胞都存在1型与2型分化,且这些分化在特定细胞因子增强时可被逆转。
且这些研究清楚地证明,只有激活的细胞亚群可以表达细胞因子,静止的正常淋巴细胞(T、B、NK)不能分泌细胞因子。

Multicolor staining in CytometryQualification for clinical immunology Michel JanssensQualification of a multicolor staining in CytometryOutlineIntroduction Development of the ICS test (Intracellular Cytokine Staining) Optimization of test Qualification/Validation of test Results ConclusionsIntroductionVaccinology and ImmunologyVaccine CandidateImmunogenicityEfficacy Clinical TrialsMeasurement of the Immune ResponseHumoralCellularIntroductionImmunological MemoryIntroductionWhich component do we need to measure cellular response ?PREPOSTCell FrequencyCell FunctionsIntroductionIn vitro restimulation of lymphocytes : Intracellular cytokine staining assay (1-day)Cytokine productionDevelopment of ICS testIntracellular cytokine staining : 4-color stainingNo activation0.04 0.00 0.10Antigen0.140.002.89CD8IL-20.050.002.061.05CD40.01 1.41!IFNγDevelopment of ICS testIntracellular cytokine staining : From 4 colors to 7 colorsInformative and sensitive read-outArticles: – "Nine-color flow cytometry for accurate measurement of T cell subsets and cytokine responses. Part I: Panel design by an empiric approach. Part II: Panel performance across different instrument platforms. (Roederer et al - Cytometry A. 2008;73A(5):400-410;410-420) – "Precision and linearity targets for validation of an IFNγ ELISPOT, cytokine flow cytometry, and tetramer assay using CMV peptides (Maecker et al - BMC Immunol. 2008;9:9.)In addition to IL2 and IFNγ, other markers were added :– CD3: discrimination of CD8+ vs NK cells – TNFα: pro-inflammatory cytokine, cytotoxicity, anti-viral – CD40L: T-cell help to B- and CD8+ T-lymphocytesFrom detection of: CD4, CD8, IL-2, IFNγ TO CD3, CD4, CD8, IL-2, IFNγ, CD40L, TNFαOptimization of ICS testWhat ?Which antigen to restimulate PBMCs?– Protein? Peptide pools? – Max number of peptides per pool? Size? Peptide concentration? – Antigen toxicity?In vitro stimulation period?– 6 hours vs 20 hoursAntibodies?– Concentration ? At what time? Extra/Intra cellular?Data : how to analyse? Capture of data? Automation?Optimization of ICS testResultsWhich Antigen to restimulate PBMCs: – 15-mer peptide pools (overlap 11 aa)Article: – "Use of overlapping peptide mixtures as antigens for cytokine flow cytometry." (Picker et al - J Immunol Methods. 2001;255(1-2):27-40)– Up to 210 peptides – At 1.25 µg/ml/peptide – Antigen toxicity assess using spiking with SEB or model Ag In vitro stimulation period : – 20 hours (Brefeldin A added after the two first hours)Optimization of ICS testResultsAntibodies used for staining : – matrix analysis [ ] A [ ] B [ ] CStep of stainingAt thawing Extracellular IntracellularAntibody concentration– Optimized results : (staining in plates - 106 cells-50 µl/well)Extracellular : 20 min RT– <> CD3, <> CD4 and <>CD8Intracellular : 20 min RT (after cytofix/cytoperm step)– <> IFNγ, <> CD40L, <> IL2,<> TNFα γ αOptimization of ICS testResultsData analysis:– focus on “double positives”– Articles : “Duration of antiviral immunity after smallpox vaccination” Erika Hammarlund (Nature Med 2003; 9 (9) -1131-7) "Live-cell assay to detect antigen-specific CD4+ T-cell responses by CD154 expression. " Chattopadhyay PK. (Nat Protoc 2006;1(1):1-6) "Direct access to CD4+ T cells specific for defined antigens according to CD154 expression." Frentsch M. (Nature Med 2005; 11(10):1118-24)– Internal validationCD40L (CD154) expressed on all activated CD4+ T cells Same magnitude of the results in "single" vs "double positive CD4+T cells Background is quite lower in double <> singleOptimization of ICS testResultsData analysis:– focus on “doubles positives"! #" "CD3+/CD4+ or CD3+/CD8+ : – – – – – All double: cells expressing at least two different cytokines (CD40L, IL-2, TNFα, or IFNγ) d-CD40L: cells expressing CD40L and another cytokine (IL-2, TNFα, or IFNγ) d-IL-2: cells expressing IL-2 and another cytokine (CD40L, TNFα, or IFNγ) d-TNFα: cells expressing TNFα and another cytokine (CD40L, IL-2, or IFNγ) α d-IFNγ: cells expressing IFNγ and another cytokine (IL-2, TNFα, or CD40L) γOptimization of ICS testResultsData analysis:– Diva software - batch analysis (1)Optimization of ICS testResultsData analysis:– Diva software - batch analysis (2)Analysis template double cytokine (Bkg response)CD3+/CD4+CD3+/CD8+Optimization of ICS testResultsData analysis:– Diva software - batch analysis (2)Analysis template double cytokine (Antigenic response)CD3+/CD4+CD3+/CD8+Optimization of ICS testGSK Standard ICS Method : protocol (SOP)Peripheral Blood mononuclear cells 1. Short term in vitro stimulation :106 cells/well w versus w/o antigen + CD28 and CD49d AB for 2 hours 37° C + Brefeldin A O/N 37° C Extracellular staining: CD3,CD8 and CD4 Fixation and permeabilisation Intracellular staining: IFNγ, IL-2, TNFα, CD40Lgiug2. Staining :3. Acquisition & Analysis : 4. Results :FACSCantoII /FACS LSRII instrument Diva softwareExpressed as frequencies of double cytokines CD4+ or CD8+ T cells responding to the antigenValidation of the ICS test used for Cellular Immune MonitoringWhy ?Rules? – Does this fall under regulation : GCP, GMP, GLP? – Is it a diagnostic assay (IVD)?NO NO(But ensure confidentiality)– Do we know if the assay is a correlate for efficacy NO – Is it an FDA/EMEA requirement? Recommendations We have to : – Be confident in the integrity of data – Generate reliable infoAs Product development & Critical decisions are guided by the assay dataValidation of the ICS test used for Cellular Immune MonitoringWhat is required?– – – – – –Sample integrity (confidentiality) A GLP-like environment to conduct experiments (documented) A qualified SOP for the method and documented Qualified and calibrated instruments Qualified operators Interpret FDA Guidance and ICH Q(R1)* parameter definitions for the assay:And design experiments to address the specific parameters– Defined statistical analysis for relevance and quality of the data* ICH = International Conference on Harmonization - guidelines part Q(R1)Validation of the ICS test used for Cellular Immune MonitoringAssay validation packageWill consist of : 1st part - Assay validation plan:Description, scope and goal of the assay GLP-like environment documentation Documented test method List of materials and equipments Documented qualification and calibration of critical instruments Documented competency tests to use the validated SOP for operators Procedures for testing each parameter of ICH Q(R1) Acceptance criteria for each performance parameter Definition of the statistical analysisValidation of the ICS test used for Cellular Immune MonitoringAssay validation packageWill consist of: 2nd part - Assay validation report :To :– Proof that validation was approached in a planned and logical manner – Proof that the plan was followed and is reflected in the data – Proof that the SOP used in the clinical trial is based on the validation testsConsisting of :– Concise report (an easily interpreted view of the data)All will be maintained in the QA archives (auditors will ask to see it)Validation of the ICS test used for Cellular Immune MonitoringAssay validation parametersShould fulfil the parameters described in: – The ICH Q(R1) guidelines; – using FDA "Guidance for Industry - Bio-analytical Method Validation"– "Validation involves documenting, through the use of specific laboratory investigations, that the performance characteristics of the method are suitable and reliable for the intended analytical applications"Validation of the ICS test used for Cellular Immune MonitoringAssay validation parametersValidation characteristics to be considered are:Accuracy Precision– Repeatability – ReproducibilitySpecificity Linearity Range Detection and Quantification Limits (LOD-LOQ)It may not be possible to test all parameters: explanation in the validation reportValidation of the ICS test used for Cellular Immune MonitoringAccuracyDefinition: – Comparison between "what's measured" and "true" values – Comparison of the results of the proposed analytical procedure with those of a second well-characterized procedure. In ICS assay for vaccine clinical trials: – Not applicableWhy?– There is no "International standard" available for CMI assay. – There is no "Gold standard assay" available.Validation of the ICS test used for Cellular Immune MonitoringPrecision / RobustnessDefinition: – "Closeness of agreement between a series of measurements for the same samples" = variability of the testUsually expressed as the variance, standard deviation or coefficient of variationR&R plan in GSK: – 10 samplesNot activated = Background Antigen activated– Tested :In duplicates at four different days By at least 2 OperatorsValidation of the ICS test used for Cellular Immune MonitoringPrecision / RobustnessPublished results: – BMC Immunology 2005, 6:13. Standardization of cytokine flow cytometry assays. Maecker H., Rinfret A., D'Souza P. et al.Reproducibility CV's (%) >0,5% 18-24 0,5%<>0.1% 24-57 <0.1% >57GSK results:Reproducibility CV's (%) >0,5% < 25% 0,5%<>0.1% 0.1%<>0.05% 25-36 32-57 <0.05% >57Validation of the ICS test used for Cellular Immune MonitoringPrecision / RobustnessGSK results : – Bridging (Deming's regression) : new operator or interlab validation– At least 40 independent samplesValidation of the ICS test used for Cellular Immune MonitoringSpecificityDefinition: – "Detection of the analyte in the presence of potentially interfering substances"Difficult to test adequately without a purified analyte. No international standard reference for calibrating detection of human T cells Antigen specific is currently available. HVTN (HIV Vaccine Trial Network) : not applicable in ICSIn GSK: to assess the specificity, we study the specific T cell responses before and after vaccination with the candidate vaccines.Validation of the ICS test used for Cellular Immune MonitoringSpecificityGSK results:4000 Frequency of c y t+ ac tiv ated CD4 (Cy t+ Ac t CD4/MioCD4) 3500 3000 2500 2000 1500 1000 500 0 D0 D60– –Pre-vaccinationLow/no cyt+ CD4+ T detectedPost-vaccinationSignificant CD4+ T cells detectedValidation of the ICS test used for Cellular Immune MonitoringLinearity and rangeDefinitions: – "Linearity is the ability to obtain results that are directly proportional to the concentration of analyte in the sample" – "Range is the range of analyte concentration over which the proportionality is maintained with good precision" In GSK: to demonstrate linearity & range : – What to use : Dilution "Post vac." into "Pre vac." PBMCs – Test a minimum of 5 levels (in triplicates) – Demonstration using linear regression and R²Validation of the ICS test used for Cellular Immune MonitoringLinearity and rangeGSK results:10 % CD4 specific T cells (estimated)Linearity1R2 = 0.99870.10.010.001 0.0010.010.1110% CD4 specific T cells (true)– –R² ≅ 0.999 ≅ linearity Specific response seems linear from ≅ 0.02% to …Difficult to define an upper limit for the range– Reported in literature : typical T cell responses range from 0.1 to 10 %Validation of the ICS test used for Cellular Immune MonitoringDetection and quantification limits = LOD - LOQDefinitions: – LOD : "the lowest concentration that can be detected but not necessarily quantified"In GSK :– As "stopped" gate put at 75000 of CD4+ Tcells – And as technically, cytometry is able to detect 1 CD4-specific T cell – LOD for CD4+ Tcells = 1/75000 = 0.0013%– LOQ : "the lowest concentration that can be quantified with acceptable precision"Two approaches:– + 2 SD over geomean of log of the background values ≈0.03% – Or more conservative: decide of an acceptable % of precision and determine the LOQ as the minimal concentration with at least this % of precision (f.i. if 30% ≈0.1%)In GSK: under evaluationValidation of the ICS test used for Cellular Immune MonitoringRobustness : some other aspectsQuality criteria : – Viability of samples at thawing must be upper than 80% – Acquisition of at least 4000 CD4+ and CD8+ T cells – Background response must be lower than 0.1% in CD4 and CD8 double cytokine positive population.Validation of the ICS test used for Cellular Immune MonitoringRobustness : internal standardsQuality controls : – QC standard controls: samples with a specific positive response introduced in each testing run. – ROLLING controls: 2 samples tested in previous testing run retested in the next one.S1 S2 S3 S4 S5 S6 S7… S2 S4 S10 S11 S12 S13… S11 S13 S20 S21 S22 S23…$%– Calibration of instruments by Calibration particles : mixture of particles dyed to eight different fluorescent intensitiesValidation of the ICS test used for Cellular Immune MonitoringRobustness : some other aspectsQuality controls: QC Chartscontrol4 3.8 Log(Events) 3.6 3.4 3.2 3 2.8 2.6 0 20 40 60 Day 80 100 120Validation of the ICS test used for Cellular Immune MonitoringRobustness : some other aspectsTechnical aspects / automation – Instruments : FACS BD LSRIITM or CANTOTM II + HTS:Auto-connection Instrument-PC Automatic fluidic start-up and shut-down Check of pressure and all fluid level– Software: BD FACSDivaTM (version 5)Automatic compensations Template of acquisition Template for batch analysis– Statistical analysis:Raw data charged automatically into clinical databases– (IT application developed for data capture & transfer)BD, BD FACSCanto, BD LSR II, BD FACSDiva are trademarks of Becton Dickinson and Company.ICS test in GSK vaccine clinical trialsResultsCD4 response measured after 2 vaccinations (rec.Ag +/- Adj.)4000 nbre of specific CD4 T cells per Moi of CD4 T cells 3500 3000 2500 2000 1500 1000 500 0 D0 D30 Ag D60 D0 D30 Ag + adj 1 group/tim epoint D60 D0 D30 Ag + adj 2 D60ICS test in GSK vaccine clinical trialsConclusionIn GSK Intracellular cytokine staining has been Developed Optimized & Validated To measure the cellular immune response induced by our candidate vaccinesAcknowledgments& – –' ( ! ! * * , ) ' ' ! ) + ( $ + ' . / -'。
十二项细胞因子检测(流式法)的临床意义与检验须知为提高我院疾病诊断技术水平,从即日起,检验科利用流式高通量检测技术开展十二项免疫功能相关细胞因子联合检测项目。
本项目将为感染、肿瘤、自身免疫病、妇产科和生殖医学科相关疾病等多种临床疾病的诊治提供重要依据,为前来医院就诊的临床患者提供更为优质全面的检验服务。
细胞因子是由免疫细胞(如单核、巨噬细胞、T细胞、B细胞、NK细胞等)及某些非免疫细胞(内皮细胞、表皮细胞、纤维母细胞等)经刺激而合成、分泌的一类具有广泛生物学活性的小分子蛋白质,参与机体免疫反应和炎症反应,包括白介素、干扰素、肿瘤坏死因子等。
不同患者在感染过程中反应不同,如感染流感后,机体免疫反应过强,促炎性细胞因子过度释放,引起严重免疫病理损伤称之为“细胞因子风暴”。
“细胞因子风暴”的目标是清除病毒,但也可能导致患者自身的机体损伤。
在流感发展成重症前,采取临床干预至关重要,因此需监测细胞因子,及早识别并监测过度炎症反应,能够为临床的诊疗提供有力帮助。
细胞因子监测范围主要包括感染、肿瘤、自身免疫性疾病、手足口病、胰腺炎或不明原因发热患者;抗生素、免疫调节剂、激素用药前、用药后;手术后;ICU患者等。
一、适用科室:肿瘤科、ICU、呼吸科、感染科、风湿免疫科、血液科、器官移植科、放化疗科、外科、皮肤科、肾内科、眼科、妇科等科室均可以开展,其结果可以为疾病的辅助诊断、指导用药、监测疗效及预后提供参考。
细胞因子12项包括:IL-1β、IL-2、IL-4、IL-5、IL-6、IL-8、IL-10、IL-12p70、IL-17、TNF-α、IFN-γ、IFN-α。
方法学:流式免疫荧光法二、收费标准:513元∕人(甲类医保)三、医嘱:医生工作站直接搜索“细胞因子12项”四、抽血要求及报告时限:1-2ml EDTA抗凝血浆(紫管)×1管,无需空腹,随时送检,当日或次日下午4点发出检验报告。
五、临床意义:细胞因子临床意义IL-1β可促进成纤维细胞增殖和胶原合成,参与纤维化;对胰岛β细胞有毒性,与Ⅰ型糖尿病有关;可刺激神经胶质细胞增生,形成瘢痕,与癫痫发病有关;有抗肿瘤作用,能协同IL-2、IFN-γ诱导CTL和NK细胞的杀伤活;与自身免疫病和抑制排斥有关。