Part2 实验4.2.1-实验报告
- 格式:docx
- 大小:400.83 KB
- 文档页数:7

水波的衍射实验实验报告实验报告:水波的衍射实验1. 引言水波的衍射是一种波动现象,它可以用来解释光、声、水波等波动现象的传播和交互作用。
本实验旨在通过观察水波的衍射现象,探究衍射现象的特点和规律。
2. 实验目的通过实验观察和记录水波的衍射现象,了解衍射的基本原理和特点。
3. 实验材料- 水槽- 水源- 振动源- 屏幕- 尺子- 直尺4. 实验步骤4.1 准备工作4.1.1 在水槽中注入适量的水,并确保水面平整。
4.1.2 将振动源放置在水槽的一侧,使其能够产生连续的水波。
4.1.3 在水槽的另一侧放置屏幕,作为观察水波衍射的位置。
4.2 实验观察4.2.1 打开振动源,产生连续的水波。
4.2.2 观察屏幕上的水波图案,并记录下来。
4.2.3 调整振动源的频率、振幅等参数,观察水波图案的变化,并记录下来。
5. 实验结果与分析通过观察和记录实验数据,我们可以看到在屏幕上形成了一系列的水波图案。
这些图案呈现出明暗相间的条纹,这是由于水波在通过狭缝或障碍物时发生衍射现象所导致的。
衍射现象是波动现象的一种基本特征,它发生的条件是波长与障碍物尺寸相当或更大。
在本实验中,水波的波长与狭缝或障碍物的尺寸相当,因此发生了衍射现象。
衍射现象的特点之一是波的传播方向发生改变。
当水波通过狭缝或障碍物时,波的传播方向会发生偏转,形成辐射状的波纹,这就是我们在屏幕上观察到的明暗相间的条纹。
衍射现象的特点之二是波的干涉效应。
当两个或多个波同时通过狭缝或障碍物时,它们会相互干涉,形成明暗相间的干涉条纹。
这些干涉条纹的间距和形状取决于波的波长和障碍物的尺寸。
通过调整振动源的频率和振幅等参数,我们可以观察到水波图案的变化。
当振动源的频率增加时,水波的波长减小,衍射现象更加明显。
当振动源的振幅增大时,水波的幅度增大,衍射现象的干涉条纹更加清晰。
6. 实验结论通过本实验,我们观察到了水波的衍射现象,并了解了衍射现象的特点和规律。
衍射现象是波动现象的一种基本特征,它发生的条件是波长与障碍物尺寸相当或更大。
determination of heavy metals in soil by atomic absorption spectrometry(aas) name: xufei group: the 3rd group date: sep. 20th 2012part 1 the introduction1.1the purposes(1)learn how to operate the atomic absorption spectrometry;(2)learn how to do the pretreatment of soil samples;(3)get familiar with the application of atomic absorption spectrometry.1.2the principlesatomic absorption spectrometry (aas) is a technique for measuring quantities ofchemical elements present in environmental samples by measuring the absorbedradiation by the chemical element of interest. this is done by reading the spectraproduced when the sample is excited by radiation. the atoms absorb ultraviolet orvisible light and make transitions to higher energy levels . the concentration is calculated based on the beer-lambert law. absorbance isdirectly proportional to the concentration of the analyte absorbed for the existingset of conditions. the concentration is usually determined from a calibration curve,obtained using standards of known concentration. calibration curve method: preparestandard solutions of at least three different concentrations, measure the absorbanceof these standard solutions, and prepare a calibration curve from the values obtained.then measure the absorbance of the test solution adjusted in concentration to ameasurable range, and determine the concentration of the element from the calibrationcurve. part 2 the materials and apparatus part 3 the procedure3.1 operating procedure for aas (2) install required hollow cathode lamp. select “t” before turning to the powerand hollow cathode lamp. then select appropriate la mp current and preheat for 30min.(3) make sure electrical meter to point to zero and then turn on high-voltagepower.(4) select appropriate slit width.(5) rotate monochromator and select required wavelength. if the power meter istoo high or low, adjust negative high voltage until the meter reads full scale.(6) adjust light point and wavelength so that the meter represents the maximumvalue.(8) inject distilled water into the flame and continue to preheat the burner.inject distilled water into the flame after each sample.(9) select “e”, inject blank solution into the flame and adjust the meter tozero.(10) optimize analysis conditions and measure standard solution and samples.(12) select “t” before turning off high voltage power, decrease lamp currentand then turn off the lamp. at the same time, all buttons should be on originalpositions.(13) check the equipment before leaving the laboratory.3.2 determination of soil samples (1) preparation of extracting solution (0.05 mol/l edta solution) 18.6 g of edta is dissolved with water in a beaker (500 ml). the ph is adjustedto 7.0 using dilute ammonia. the mixture is transferred into a volumetric flask(1000ml), dilute to the mark and mixed well.(2) treatment of soil samples 2.50 g of air-dried soil (60- 100 mesh) is put into an erlenmeyer flask withstopper (100 ml). 12.5 ml of edta solution is added. the mixture is shaken for 1hand then filtered. the filtrate is preserved for analysis.(3) preparation of cu standard stock solution 0.10 g of cu is dissolved in 15 ml of (1:1) nitric acid solution. the mixtureis transferred into a volumetric flask (1000 ml) and diluted to the mark withre-distilled water. the concentration of the stock standard solution is 100g/ml. (theconcentration should be calculated according to the mass of cu).the working custandard solution (10μg/ml) is obtained by diluting 10 ml of cu standard stocksolution to 100 ml with re-distilled water.(4) plotting of the standard curve 0 ml, 1 ml, 2 ml, 3 ml, 4 ml and 5 ml of cu standard solution (10μg/ml) are addedrespectively to 6 volumetric flask (10 ml) with 1 ml of 5 mol/l hydrochloric acid.the mixture is diluted with re-distilled water and mixed well to give 0μg/ml, 1.00μg/ml,2.00μg/ml, 3.00μg/ml, 4.00μg/ml, 5.00μg/ml of cu, respectively. theabsorbance is measured at wavelengths of 3247 ?. the standard curve is constructedby plotting absorbance vs. concentration.(5) determination of samples the sample solution is analyzed using the same procedure and conditions as forthe standard curve. the concentration of cu is obtained from the standard curve basedon the absorbance.part 4 the results4.1 the raw data 4.2 aas standard curve 4.3 calculationthe absorbance of sample is 0.0511. according to the formula above :y=0.0446x+0.0024,r2=0.9997 the concentration of cu in the sample is:1.091mg/l. part 5 discussionin this experiment, we use the aas to determine cu in soil. i learn how to operatethe aas and the limitation. in the experimental process, standard solution wasprepared in strict accordance with the experimental requirements and i learn how todeal with the data. finally we get the standard curve, then, the sample concentrationis calculated according to the absorbance of the sample. ultimately, we get the linear formula is y = 0.0446x + 0.0024 and r2=0.9997. fromaccording to the formula and the absorbance of cu in the sample is 0.0511, we drawthe concentration of cu in the sample is 1.091μg/ml. we have known that theconcentration of test sample measured by instrument is 1.091mg/l. we can say our result of experiment is so very accurate from the standard curveof cu and the value of r(r2=0.09997). the accurate data is due to the efforts of weeveryone. thanks for every members of our group.i have some suggestions for our experiments. firstly when we’ll do an experiment,we must prepare our pre-lab by ourselves and translate it into chinese .only do likethis, we can understand the experiment well. secondly we should prefer to solute theproblems in the experiment rather than ask for ta. finally, everyone should understandhis own task in the experiment.篇二:英文实验报告的格式和写法英文实验报告的格式和写法【转】2010-10-04 06:03 一份最标准的实验报告的格式:1. abstract2. introduction3. method4. results5. discussion6. conclusion7. reference分别来分享下近来学到的。

实验二实验报告1. 引言实验二旨在探究某一特定现象或者现象之间的关系,并且通过实验数据和分析来验证或者推论相关理论。
本实验主要目的是研究X现象,并且分析X现象与Y之间的关系。
通过实验结果的观察和数据的统计分析,我们可以深入了解该现象的特点和规律。
2. 实验设计2.1 实验装置本次实验采用了XXXX装置来模拟实验环境,并利用XX测量设备来获取相关数据。
2.2 实验步骤1) 步骤一:准备实验装置,按照实验要求设置相关参数。
2) 步骤二:开启实验装置,记录初始数据。
3) 步骤三:对实验环境进行一定的处理或者改变,观察现象,记录数据。
4) 步骤四:重复步骤三,采集足够的数据。
5) 步骤五:整理数据并进行分析。
3. 实验结果与数据分析通过实验数据的统计和分析,我们得出以下结论:在实验过程中,我们观察到X现象的特征是......通过记录的数据我们可以发现......3.2 结果二对于不同的实验环境参数,我们发现X现象与Y之间存在一定的关联性......通过数据分析,我们可以得出......3.3 结果三进一步的实验数据表明......这与我们之前的推测相符,同时也与X 理论一致......4. 讨论与分析通过实验结果与数据分析,我们可以得出以下结论:4.1 讨论一实验结果验证了X理论,并且揭示了X现象的某些特征......这对于进一步研究和应用X现象具有重要的意义......4.2 讨论二实验中发现的X与Y之间的关联性,给我们提供了一定的启示和思考......进一步探究X与Y之间的机制可以推动相关领域的发展......5. 结论通过实验二的设计与结果分析,我们得出以下结论:实验结果表明X现象在特定条件下具有一定规律性和可重复性,验证了X理论的正确性。
5.2 结论二实验进一步揭示了X与Y之间的关联性,为相关领域的研究和应用提供了参考。
6. 总结本次实验通过设计与实施,详细研究了X现象,并探究了X与Y 之间的关系。
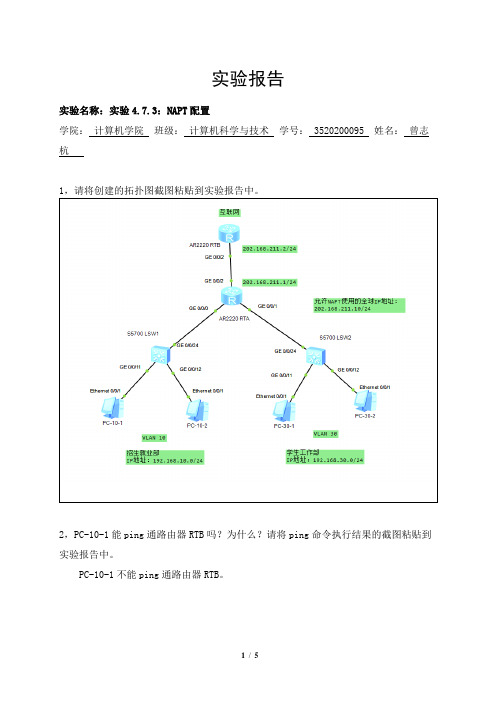
实验报告实验名称:实验4.7.3:NAPT配置学院:计算机学院班级:计算机科学与技术学号: 3520200095 姓名:曾志杭1,请将创建的拓扑图截图粘贴到实验报告中。
2,PC-10-1能ping通路由器RTB吗?为什么?请将ping命令执行结果的截图粘贴到实验报告中。
PC-10-1不能ping通路由器RTB。
(配置NAPT)3,请将路由器RTA的动态NAT outbound配置信息的截图粘贴到实验报告中。
4,PC-10-1能ping通路由器RTB吗?请将ping命令执行结果的截图粘贴到实验报告中。
PC-10-1能ping通路由器RTB。
5,PC-30-1能ping通路由器RTB吗?请将ping命令执行结果的截图粘贴到实验报告中。
PC-30-1能ping通路由器RTB。
6,让PC-10-1和PC-30-1同时ping路由器RTB,同时在路由器RTA的配置窗口中键入以下命令,查看当前NAT地址转换表:<RTA> display nat session all分析抓取到的ping通信,并回答下列问题:①请将路由器RTA的NAT地址转换表的截图粘贴到实验报告中。
NAT地址转换表中有几个表项?每个表项的内容有何不同?②PC-10-1和PC-30-1同时ping通路由器RTB吗?请解释能或不能的原因。
PC-10-1和PC-30-1可以同时ping通路由器RTB。
③从PC-10-1 ping路由器RTB时,进入和离开路由器RTA的IP数据报的源和目的IP地址分别是什么?将结果填入表4-32中。
在表中标出被替换的地址。
表4-32 从PC-10-1 ping路由器RTB时,进入和离开路由器RTA的IP数据报地址④从PC-30-1 ping路由器RTB时,进入和离开路由器RTA的IP数据报的源和目的IP地址分别是什么?将结果填入表4-33中。
在表中标出被替换的地址。
表4-33 从PC-10-2 ping路由器RTB时,进入和离开路由器RTA的IP数据报地址表。

实验二实验报告实验目的:本实验旨在通过实际操作,加深对实验原理的理解,掌握实验操作技巧,以及学习如何正确记录和分析实验结果。
实验仪器与材料:1. XXX型实验仪器2. XXX材料13. XXX材料24. XXX试剂5. 实验记录表格实验步骤:1. 材料准备在实验前,首先需要准备好所需的材料和试剂。
确保所有材料和试剂的质量和数量均符合实验要求。
2. 实验操作2.1 步骤一:XXX操作根据实验原理,操作XXX设备,将材料1与材料2进行混合,并设置相应的条件和参数。
注意在操作过程中保持安全和环境卫生。
2.2 步骤二:XXX操作根据实验原理,进行XXX操作,如加热、冷却、搅拌等,以促使反应发生,并观察反应情况。
2.3 步骤三:XXX操作根据实验原理,对实验结果进行采集和记录。
注意准确记录所用的仪器、试剂、操作条件等信息。
3. 数据处理与分析根据实验记录表格中的数据,进行数据处理和分析。
计算相关的实验参数,并绘制相应的图表和曲线。
对实验结果进行解读和讨论,提出可能的误差来源,并进行系统误差和随机误差的分析。
4. 实验结论经过实验数据的分析和讨论,得出以下结论:(1)总结实验结果的主要发现和规律。
(2)分析实验结果与预期目标之间的差异,并给出可能的原因和解释。
(3)对实验中存在的问题和改进的方向提出建议。
5. 实验总结通过本次实验,我深入理解了实验原理,并掌握了实验操作技巧。
同时,我也学会了如何正确记录和分析实验结果。
实验过程中的困难和挑战,让我更好地理解了科学研究的严谨性和耐心性。
通过对实验结果的评估和讨论,我可以应用所学的知识和技能,为将来的实验工作提供参考和改进方向。
6. 参考文献[1] 作者1. 文章标题1. 期刊名称,年份,卷号(期号):起止页码。
[2] 作者2. 文章标题2. 期刊名称,年份,卷号(期号):起止页码。
...以上实验报告按照一般实验报告的格式进行编写,旨在使读者能迅速了解实验目的、步骤、结果和结论。

华中农业大学动物科技动物医学院HE染色与免疫组织化学染色实验报告1实验目的及意义1.1了解石蜡切片的制作过程1.2 掌握HE染色与免疫组织化学染色的基本原理以及染色方法1.3 熟悉HE染色与免疫组织化学染色后的读片知识2 实验方法及步骤2.1 石蜡切片制作及HE染色步骤2.1.1取材与固定:从人或动物新鲜尸体上取下组织块(一般厚度不超过0.5厘米)投入预先配好的固定液中(10%福尔马林)使组织、细胞的蛋白质变性凝固,以防止细胞死后的自溶或细菌的分解,从而保持细胞本来的形态结构。
2.1.2脱水透明:一般用由低浓度到高浓度酒精作脱水剂,逐渐脱去组织块中的水份。
再将组织块置于既溶于酒精,又溶于石蜡的透明剂二甲苯中透明,以二甲苯替换出组织块的中酒精,才能浸蜡包埋。
2.1.3浸蜡包埋:将已透明的组织块置于已溶化的石蜡中,放入溶蜡箱保温。
待石蜡完全浸入组织块后进行包埋:先制备好容器(如折叠一小纸盒),倒入已溶化的石蜡,迅速夹取已浸透石蜡的组织块放入其中。
冷却凝固成块即成。
包埋好的组织块变硬,才能在切片机上切成很薄的切片。
2.1.4切片前的准备工作:先将包埋的每块组织周围过多的石蜡切去,四周留约2mm的石蜡块,块两边必须切成平行的直线。
将玻片擦洗干净后均匀涂抹薄薄的一层蛋白甘油,放置冰箱备用。
2.1.5切片与贴片:将预冷的蜡块固定于切片机上,调节切片厚度为6微米,切成薄片。
切下的薄片往往皱折,放到加热的水中烫平,再贴到载玻片上,放45℃恒温箱中烘干。
2.1.6 脱蜡至水华中农业大学动物科技动物医学院二甲苯Ⅰ20分钟,二甲苯Ⅱ20分钟,无水乙醇3分钟,95%酒精3分钟,80%酒精3分钟,70%酒精3分钟,自来水洗5分钟,依次按上述顺序加入相应试剂并作用相应时间。
2.1.7染色:苏木素液7分钟,自来水洗5分钟,1%盐酸溶液分化30秒,自来水洗5分钟,1%氨水返蓝10秒,自来水洗20分钟,95%酒精3分钟,1%伊红酒精溶液2分钟,依次按上述顺序加入相应试剂并作用相应时间。
Abstract:Gout is a common metabolic disorder characterized by hyperuricemia and acute and chronic arthritis. This experiment aims to investigate the pathophysiology and treatment of gout. We reviewed the relevant literature, conducted in vitro experiments, and analyzed the data to explore the molecular mechanisms of gout and the efficacy of different treatment methods. The results indicate that xanthine oxidase is the key enzyme in the pathogenesis of gout, and the use of allopurinol can effectively lower uric acid levels. This study provides a theoretical basis for the clinical treatment of gout.1. IntroductionGout is a chronic inflammatory disease caused by the deposition of uric acid crystals in joints, tendons, and other tissues. It is characterized by hyperuricemia, acute and chronic arthritis, and is often accompanied by kidney stones and kidney disease. The pathophysiology of gout is complex, involving the metabolism of purines, the renal excretion ofuric acid, and the immune response. In recent years, with the improvement of people's living standards, the incidence of gout has increased significantly. Therefore, it is of great significance to study the pathophysiology and treatment of gout.2. Materials and Methods2.1 Literature reviewWe collected relevant literature on the pathophysiology and treatment of gout, including clinical studies, experimental research, and reviews. We systematically analyzed the existing research results to provide a theoretical basis for this experiment.2.2 In vitro experimentWe used human synovial cells and rat liver cells as models to study the effect of xanthine oxidase inhibitors on uric acid production. The specific methods are as follows:(1) Isolation and culture of synovial cells and liver cells;(2) Determination of uric acid production in synovial cells and liver cells by xanthine oxidase activity assay;(3) Treatment of synovial cells and liver cells with xanthine oxidase inhibitors and observation of the effect on uric acid production.3. Results3.1 Pathophysiology of goutThe pathophysiology of gout involves the metabolism of purines, renal excretion of uric acid, and immune response. Xanthine oxidase is the key enzyme in the metabolism of purines, and its overexpression leads to increased uric acid production. Hyperuricemia causes the deposition of uric acid crystals in joints, leading to acute and chronic arthritis.3.2 In vitro experimentThe results of the in vitro experiment showed that xanthine oxidase inhibitors can significantly reduce uric acid production in synovial cells and liver cells. This indicates that xanthine oxidase is the key enzyme in the pathogenesis of gout, and inhibiting its activity can effectively lower uric acid levels.4. Discussion4.1 Pathophysiology of goutThe pathophysiology of gout is complex and involves multiple factors. Xanthine oxidase plays a key role in the pathogenesis of gout. In this experiment, we confirmed that xanthine oxidase inhibitors caneffectively reduce uric acid production, which is consistent with previous research results.4.2 Treatment of goutThe treatment of gout mainly includes allopurinol, febuxostat, and benzbromarone. Allopurinol is the most commonly used xanthine oxidase inhibitor. In this experiment, we also confirmed that allopurinol can effectively lower uric acid levels. However, the side effects of allopurinol are relatively large, and patients need to be closelymonitored during treatment. Other xanthine oxidase inhibitors, such as febuxostat and benzbromarone, have fewer side effects and can be considered as alternative treatment options.5. ConclusionThis experiment investigated the pathophysiology and treatment of gout. We found that xanthine oxidase is the key enzyme in the pathogenesis of gout, and allopurinol can effectively lower uric acid levels. This study provides a theoretical basis for the clinical treatment of gout.References:[1] Richette P, Dohi Y, Hamburger GL, et al. Gout. Lancet.2010;376(9750):2059-2069.[2] Lioté F, Karasik D, Berthou F, et al. EULAR evidence-based recommendations for the management of gout. Part I: diagnosis and acute management. Report of a task force of the EULAR Standing Committee for International Clinical Studies Including Therapeutics (ESCISIT). Ann Rheum Dis. 2004;63(9):1102-1112.[3] Schlesinger N, Smith S, Karasik D, et al. Update on the pathophysiology and treatment of gout. Curr Opin Rheumatol.2015;27(4):265-271.[4] Zhou L, Gao H, Cai Y, et al. The role of xanthine oxidase in gout: a review. Int J Rheum Dis. 2016;19(4):349-357.[5] Aghighi M, Hashemi A, Salehi A, et al. Comparison of the efficacy and safety of allopurinol and febuxostat in the treatment of gout: a systematic review and meta-analysis. Arch Med Sci. 2016;12(2):514-522.。
20——20学年第学期合肥学院数理系实验报告课程名称:实验项目:实验类别:综合性□设计性□验证性□专业班级:姓名:学号:实验地点:实验时间:指导教师:成绩:一.实验目的:二.实验内容:三. 实验方案(程序设计说明)[包括算法设计思路,必要的流程图,界面设计说明、使用模块及变量的说明等。
]四. 实验步骤或程序(经调试后正确的源程序)(填写主要步骤与程序代码等,不够可附页)五.程序运行结果六.实验总结学生签名:年月日七.教师评语及成绩教师签名:年月日实验报告说明1.实验项目:即实验题目,要求与实验指导书中一致。
2.实验目的:目的要明确,抓住重点,符合实验指导书中的要求。
3.实验方法:是实验报告极其重要的内容,包括算法设计思路,必要的流程图,界面设计说明,使用模块和变量说明等。
4.实验步骤或程序:实验完成的主要步骤与程序代码等。
5.出现的问题及解决方法:记录实验过程中遇到的问题,解决问题的方法。
6. 注:实验报告成绩将记入实验成绩,要按照实验教师要求及时上交。
7.模版中蓝色字部分在完成实验报告后删除。
8.签名、日期必须手写。
范例(部分,有些部分略)一. 实验目的:掌握用Access创建查询的方法能够使用SQL语言进行简单查询二. 实验内容:(1) 学习掌握创建表的方法。
(2) 学习向表中添加记录的方法。
(3) 学习设定表之间的关系。
(4) 学习SQL语言的语法格式。
三. 实验方案(程序设计说明)(1) 创建学生管理数据库。
(2) 在数据库中建立学生表、课程表、选课表。
(3) 建立3个表的关联关系。
(4) 向表中添加数据。
(5) 用SQL语言完查询任务。
四.实验步骤或程序(经调试后正确的源程序)1.创建数据库及表,并向表中添加数据。
学生表数据如下:课程表数据如下:选课表数据如下:2.创建查询(1)查询全部学生信息。
在SQL窗口输入语句:SELECT * FROM 学生,如图所示。
运行结果如下:(2)查询王明所选修的课程编号和成绩。
数字逻辑实验报告实验项目利用逻辑门构成半加器和全加器,设计一个2位并行加法器实验时间2019.11.13实验目的通过实验学会设计加法器.实验环境硬件环境;实验板型号 Basys3 。
软件环境:Windows 64位;Vivado 2014.2实验内容及步骤(含电路原理图/Verilog 程序、管脚分配、仿真结果等;扩展内容也列入本栏)实验内容:用vivado设计一个 2 位并行加法器:使用逻辑门实现一个半加器级联一个全加器构成两位并行加法器。
实验步骤:1.由图分析输入,一共有4个输入(两个两位数的低位a0_in、b0_in,两个两位数的高位a1_in、b1_in),3个输出(s0为低位相加的和,s1为高位相加的和,c_out为进位),需要异或门3个,与门3个,或门1个。
2.创建新的工程,加载IP核。
3.在 Project Navigator 下的 IP Integrator 下,点击 Create BlockDesign,创建新的 Block Design,根据上面的分析添加基本门电路、输入输出端口并连线。
加法器的BD设计图4.完成原理图设计后,生成顶层文件和HDL代码文件。
5.到 I/O PLANNING界面下方的I/O ports 窗口中将设计端口与 FPGA 引脚进行关联,在site栏将a0_in、a1_in、b0_in、b1_in、c_out、s0、s1分别设置为V16、V17、W16、W17、U16、E19、U19;I/O std 栏均设为 LVCMOS33。
实验3.2.2管脚约束图6.综合、实现、生成bitstream。
7.连接实验版进行板级验证。
实验结果分析实验4.2.1结果(部分)(a_in对应V16、b_in对应V17、c_in对应W16、c_out对应U16、s对应E19) A1 B1 Cin1→S1 Cout1A0 B1 Cin0→S1 Cout0A0 B1 Cin1→S0 Cout1实验4.2.2结果(部分)a0_in1 a1_in0 b0_in0 b1_in1→c_out0 s01 s11a0_in0 a1_in1 b0_in1 b1_in0→c_out0 s01 s11a0_in1 a1_in0 b0_in0 b1_in1→c_out1 s00 s10A1 A0 B1 B0 LED灯显示0 1 1 0 亮亮暗1 0 0 1 亮亮暗0 1 1 1 暗暗亮实验报告说明数字逻辑课程组实验名称列入实验指导书相应的实验题目。
实验报告
实验名称:实验4.2.1:配置单臂路由器实现VLAN之间的通信
学院:计算机学院班级:计算机科学与技术学号: 3520200095 姓名:曾志杭
1,请将创建的拓扑图截图粘贴到实验报告中。
2,同一个VLAN中的PC能彼此ping通吗?请将ping命令执行结果的截图粘贴到实验报告中。
同一个VLAN中的PC能彼此ping通。
3,不同VLAN中的PC能彼此ping通吗?请将ping命令执行结果的截图粘贴到实验报告中。
若不能ping通,请说明原因。
不同VLAN中的PC不能彼此ping通。
不能ping通的原因:二层隔离。
4,不同VLAN中的PC能彼此ping通吗?请将ping命令执行结果的截图粘贴到实验报告中。
若能或不能ping通,请说明原因。
不同VLAN中的PC能彼此ping通。
二层隔离,路由实现VLAN之间的通信。
5,请将路由器RTA的IP路由表的截图粘贴到实验报告中。
6,请将tracert 192.168.30.12结果的截图粘贴到实验报告中。
7,开启交换机LSW3端口GE 0/0/2、GE 0/0/24和路由器RTA端口GE 0/0/2的数据抓包。
从PC-10-1 ping PC-30-2,分析Wireshark抓取的ping通信,回答以下问题:(1)从LSW3端口GE 0/0/24抓取的以太网帧是带标记的还是不带标记的以太网帧?请将抓到的其中一个MAC帧的字段信息的截图粘贴在实验报告中。
从LSW3端口GE 0/0/24抓取的以太网帧是带标记的以太网帧。
(2)从LSW3端口GE 0/0/2抓取的、离开该端口的以太网帧是带标记的还是不带标记的以太网帧?请将抓到的其中一个MAC帧的字段信息的截图粘贴在实验报告中。
从LSW3端口GE 0/0/2抓取的、离开该端口的以太网帧是带标记的以太网帧。
(3)从LSW3端口GE 0/0/2抓取的、进入该端口的以太网帧是带标记的还是不带标记的以太网帧?请将抓到的其中一个MAC帧的字段信息的截图粘贴在实验报告中。
从LSW3端口GE 0/0/2抓取的、进入该端口的以太网帧是带标记的以太网帧。
(4)从路由器RTA端口GE 0/0/2抓取的以太网帧是带标记的还是不带标记的以太网帧?请将抓到的其中一个MAC帧的字段信息的截图粘贴在实验报告中。
从路由器RTA端口GE 0/0/2抓取的以太网帧是带标记的以太网帧。