BIOINFORMATICS APPLICATIONS NOTE doi10.1093bioinformaticsbtl682 Databases and ontologies Ap
- 格式:pdf
- 大小:68.73 KB
- 文档页数:2

欧湘滢等斑马鱼PKR 剪接异构体克隆、鉴定及转录表达分析第7期斑马鱼PKR 剪接异构体克隆、鉴定及转录表达分析①欧湘滢邵敏高宗泽代卫凯熊嘉鸿胡有生(井冈山大学医学部,吉安343009)中图分类号R392.12文献标志码A文章编号1000-484X (2021)07-0839-06[摘要]目的:克隆斑马鱼PKR (ZPKR )及其剪接异构体(ZPKRV )并对其进行鉴定和转录表达分析。
方法:采用基因克隆法克隆ZPKR 及ZPKRV ;利用生物信息学方法分析其结构差异,设计定量分析引物;使用病毒双链RNA 类似物(Poly I :C )刺激,提取斑马鱼组织总RNA 并反转录合成cDNA ,通过qPCR 检测ZPKR 及ZPKRV 转录表达的差异,推测ZPKR 及ZPKRV 的功能。
结果:首次在斑马鱼组织中克隆到ZPKRV ;生物信息分析显示,ZPKRV 仅仅在ZPKR 的双链RNA 结合结构域和激酶区之间的链接区缺失了28个氨基酸残基,并且缺失的序列包括链接区的碱性区;Poly I :C 刺激后的转录表达显示,在刺激后的12h ,ZPKR 表达上调到第一个峰值,24h 又下调,48h 再上调;而ZPKRV 仅在刺激后24h 表达上调到最高,然后下调。
结论:ZPKRV 碱性区的缺失,可能会导致其单链RNA 结合功能的丧失,进而促进蛋白的翻译表达;ZPKR 和ZPKRV 同时表达,可能通过显性的负效应,降低PKR 在抗病毒免疫反应中对蛋白翻译的抑制作用,促进抗病毒免疫细胞因子的翻译表达。
[关键词]斑马鱼;ZPKR ;ZPKR 剪接异构体;转录表达Cloning ,identification and transcription analysis of PKR transcript variant from ZebrafishOU Xiang -Ying ,SHAO Min ,GAO Zong -Ze ,DAI Wei -Kai ,XIONG Jia -Hong ,HU You -Sheng.Department of Medi⁃cine ,Jinggangshan University ,Ji′an 343009,China[Abstract ]Objective :To clone the Zebrafish PKR (ZPKR )and ZPKR transcript variant (ZPKRV ),then analyze its transcrip‐tional expression.Methods :ZPKR and ZPKRV were cloned by gene cloning method.Bioinformatics approaches were used to analyzethe structural differences and design primers for quantification it.Furthermore ,Zebrafish were stimulated with Poly I :C and the total RNA were extracted for reverse transcription.Then fluorescence qPCR was utilized to detect the difference in the transcriptional ex‐pression of ZPKR and ZPKRV ,and to speculate on their function.Results :It was the first time that the ZPKRV was cloned in Zebraf‐ish tissue.Bioinformatics analysis revealed that compared with ZPKR ,ZPKRV was only deleted 28amino acid residues in the linker between dsRBD and KD ,including the conserved basic region in the linker.After Poly I :C stimulation ,the transcriptional expressionof ZPKR was up -regulated to the first peak at 12h and then down -regulated at 24h ,again it was up -regulated at 48h.However ,ZP‐KRV was only up -regulated at 24h ,and it was down -regulated subsequently.Conclusion :The deletion of the basic region in the Ze‐brafish PKRV may result in the loss of its single -stranded RNA binding function ,which in turn promotes protein translation.ZPKR and ZPKRV coexisted in Zebrafish may reduce the inhibitory effect of PKR on protein translation in the antiviral immune response and enhance the translation of antiviral immune cytokines through dominant -negative effect.[Key words ]Zebrafish ;ZPKR ;ZPKR transcript variant ;Transcriptional expression非特异免疫是脊椎动物抵抗病毒侵入的第一道防线,干扰素系统则是机体非特异免疫抵抗感染和清除病毒的主要功能分子体系,而斑马鱼PKR(zebrafish double -stranded RNA -dependent protein ki‐nase ,ZPKR )是干扰素系统抗病毒作用的主要效应分子[1-6]。

BIOINFORMATICS APPLICATIONS NOTEVol.19no.122003,pages 1594–1595DOI:10.1093/bioinformatics/btg198Digital extractor:analysis of digital differential display outputStephen F .Madden 1,Barry O’Donovan 2,Simon J.Furney 1,Hugh R.Brady 1,Guenole Silvestre 2and Peter P .Doran 1,∗1HumanGenomics and Bioinformatics Research Unit,Department of Medicine andTherapeutics,University College Dublin,Mater Misericordiae Hospital,The Dublin Molecular Medicine Centre,41Eccles St,Dublin 7,Ireland and 2Department of Computer Science,University College Dublin,Belfield,Dublin 4,IrelandReceived on June 24,2002;accepted on March 3,2003ABSTRACTSummary:Digital Extractor is a program for the high-throughput processing of data sets derived from digital differential display-based comparisons of EST libraries.These comparisons can be utilized to identify discrete subsets of genes whose expression is restricted to distinct tissue types.The program facilitates these investigations by permitting parallel annotation of genes identified as being differentially expressed.Availability:The executable program,suitable for use on all UNIX-based platforms is freely available to non-profit usersContact:pdoran.genome@mater.ieDigital Differential Display (DDD)is an Internet based resource for the identification of genes whose expression is altered between different tissue types (/UniGene).This resource exploits the large number of publicly available cDNA libraries corresponding to different tissues,cancers,etc.This online system permits:(a)selection of cDNA libraries to be compared (e.g.cancer versus normal tissue);(b)comparison of the constituent sequences;and (c)output of a list of differentially expressed sequences.This resource offers exciting new avenues for exploration in the search for novel genes in health and disease;indeed it has recently been applied to the identification of cancer-associated transcripts (Scheurle et al.,2000).Whilst DDD represents an important tool for the biomedical research community,its main limitation rests in the cumbersome nature of the subsequent data analysis.Here we present a new program Digital Extractor,for the processing of data obtained from DDD-based investi-gations of differential gene expression.This program re-fines the DDD approach by permitting rapid,automated annotation of output gene lists.∗To whom correspondence should be addressed.Extractor is written in PERL and can be implemented on all UNIX platforms with PERL version 5.0or greater.The application can be executed using either a Java application or a command line interface.Digital Extractor integrates and utilizes a number of tools including:(a)CAP3(Huang and Madan,1999),for assembly of EST clusters into contigs;(b)RepeatMasker (Smit,1996),for masking of repetitive elements within the assembled EST contigs;and (c)BLAST (Altschul et al.,1990),for homology searching.The results file produced from a DDD experiment is an HTML page detailing all of the ESTs,whose expression differs between the conditions of interest with a link pro-vided to each UNIGENE cluster.Digital Extractor uses the DDD output HTML page as input.The page is loaded into the application and scanned to extract the accession numbers of the UNIGENE clusters,representing differen-tially expressed genes.These accession numbers are then used to complete automated extraction of the UNIGENE clusters from the locally-stored databases.The user can specify application parameters such as the database to be searched,and the e -values for the BLAST searches.Each UNIGENE cluster extracted from the database contains all of the cDNA sequences that correspond to an individual gene.The number of sequences in each cluster can range from a few dozen to many thousand.To date no attempt has been made to produce contigs from the representative sequences in these clusters due to a number of reasons including the presence in the UNIGENE cluster of all the splicing variants of the gene of interest and the inclusion of 5 and 3 reads from the same gene.However,if the information produced from the DDD is to be of use in the identification of differentially expressed genes,in particular the annotation of unknown transcripts,it is necessary to produce contiguous sequences,for database searching,by cluster assembly.This step is crucial to reduce the number of BLAST runs per experiment thus1594Bioinformatics 19(12)cOxford University Press 2003;all rights reserved.Digital extractorimproving throughput.Having obtained the complete UNIGENE clusters representing each hit in the DDD experiment,Digital Extractor integrates and utilizes the CAP3EST assembly program to produce contiguous sequences.The result of this procedure is the production of a sequence for BLAST analysis.This step obviates the need for BLAST searches of all the individual se-quences within each UNIGENE cluster,thus dramatically increasing the efficiency of the application.To facilitate the rapid,parallel identification of the gene corresponding to each assembled contig,by means of the BLAST algorithm,it is necessary to optimize the sequence inputs.To achieve this,the assembled contigs are masked for repeat elements and low complexity DNA using the Repeat Masker Application.This step substantially improves the performance of the BLAST-based sequence identification.Having assembled and masked each of the contiguous sequences corresponding to genes whose expression is altered between the conditions of interest, BLAST is used to search for homologous sequences in the non-redundant nucleotide database.The output of Digital Extractor is a results page with the identity of all annotated sequences,with links to the NCBI database for further information.To determine the speed and accuracy of Digital Extrac-tor,a test analysis was performed on a data set produced from a DDD-based comparison of cDNA libraries from human kidney and human pancreas.The output from this comparison was a web page containing171links to UNIGENE clusters.The web page was downloaded and submitted to the program via the Java GUI.The option to extract only un-annotated clusters was chosen,which focused the analysis on a subset of15UNIGENE clusters.It was also decided to compare the clusters to the nr database with an e-value of0.001(choosing a smaller database,and a lower e-value would obviously decrease run time of this aspect of the program).It takes approx-imately6minutes,to extract,assemble,mask,and blast each cluster,on a1GHz processor with216MB of mem-ory.The major limiting factor being the assembly process.A detailed analysis of the data set can be viewed on our web-site,/worked example.htm.In summary Digital Extractor represents an efficient, user-friendly platform for the rapid annotation of data de-rived from DDD-based experiments to analyze differential gene expression.ACKNOWLEDGEMENTSWe acknowledge the National Centre for Biotechnology Information for provision and curation of sequence databases,used herein.These studies were supported by the Irish Government’s Programme for Research in Third Level Institutions,the European Union Fifth Framework Programme and the Punchestown Kidney Research Fund. REFERENCESAltschul,S.F.,Gish,W.,Miller,W.,Myers,E.W.and Lipman,D.J.(1990)Basic local alignment search tool.J.Mol.Biol.,215,403–410.Huang,X.and Madan,A.(1999)CAP3:a DNA sequence assembly program.Genome Res.,9,868–877.Scheurle,D.,DeYoung,M.P.,Binninger,D.M.,Page,H.,Jahanzeb,M.and Naraynan,R.(2000)Cancer gene discovery using digital differential display.Cancer Res.,60,4037–4043.Smit,A.F.A.(1996)The origin of interspersed repeats in the human genome.Curr.Op.Gen.Dev.,6,743–748.1595。
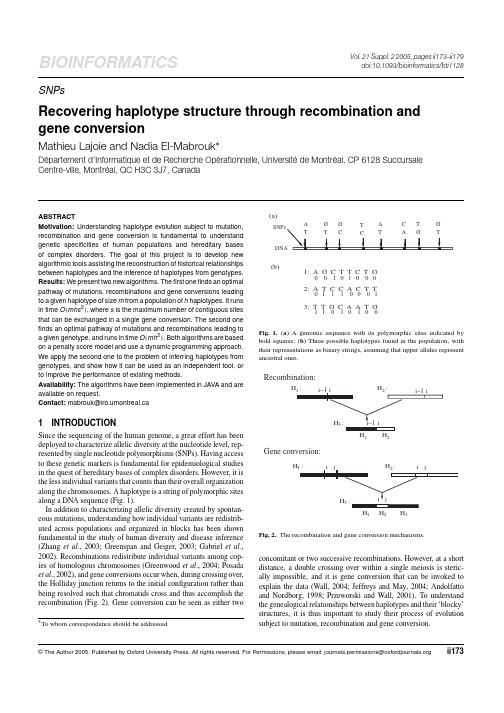
BIOINFORMATICS Vol.21Suppl.22005,pages ii173–ii179doi:10.1093/bioinformatics/bti1128 SNPsRecovering haplotype structure through recombination andgene conversionMathieu Lajoie and Nadia El-Mabrouk∗Département d’Informatique et de Recherche Opérationnelle,Universitéde Montréal,CP6128SuccursaleCentre-ville,Montréal,QC H3C3J7,CanadaABSTRACTMotivation:Understanding haplotype evolution subject to mutation, recombination and gene conversion is fundamental to understand genetic specificities of human populations and hereditary bases of complex disorders.The goal of this project is to develop new algorithmic tools assisting the reconstruction of historical relationships between haplotypes and the inference of haplotypes from genotypes. Results:We present two new algorithms.Thefirst onefinds an optimal pathway of mutations,recombinations and gene conversions leading to a given haplotype of size m from a population of h haplotypes.It runs in time O(mhs2),where s is the maximum number of contiguous sites that can be exchanged in a single gene conversion.The second one finds an optimal pathway of mutations and recombinations leading to a given genotype,and runs in time O(mh2).Both algorithms are based on a penalty score model and use a dynamic programming approach. We apply the second one to the problem of inferring haplotypes from genotypes,and show how it can be used as an independent tool,or to improve the performance of existing methods.Availability:The algorithms have been implemented in JAVA and are available on request.Contact:mabrouk@iro.umontreal.ca1INTRODUCTIONSince the sequencing of the human genome,a great effort has been deployed to characterize allelic diversity at the nucleotide level,rep-resented by single nucleotide polymorphisms(SNPs).Having access to these genetic markers is fundamental for epidemiological studies in the quest of hereditary bases of complex disorders.However,it is the less individual variants that counts than their overall organization along the chromosomes.A haplotype is a string of polymorphic sites along a DNA sequence(Fig.1).In addition to characterizing allelic diversity created by spontan-eous mutations,understanding how individual variants are redistrib-uted across populations and organized in blocks has been shown fundamental in the study of human diversity and disease inference (Zhang et al.,2003;Greenspan and Geiger,2003;Gabriel et al., 2002).Recombinations redistribute individual variants among cop-ies of homologous chromosomes(Greenwood et al.,2004;Posada et al.,2002),and gene conversions occur when,during crossing over, the Holliday junction returns to the initial configuration rather than being resolved such that chromatids cross and thus accomplish the recombination(Fig.2).Gene conversion can be seen as either two To whom correspondence should be addressed.(a)3: T T G C A A T G2: A T C C A C T T(b)1: A G C T T C T G0 1 1 1 0 0 0 10 0 1 0 1 0 0 011010100Fig.1.(a)A genomic sequence with itspolymorphic sites indicated by bold squares;(b)Three possible haplotypes found in the population,with their representations as binary strings,assuming that upper alleles represent ancestral ones.Recombination:112Fig.2.The recombination and gene conversion mechanisms.concomitant or two successive recombinations.However,at a short distance,a double crossing over within a single meiosis is steric-ally impossible,and it is gene conversion that can be invoked to explain the data(Wall,2004;Jeffreys and May,2004;Andolfatto and Nordborg,1998;Przeworski and Wall,2001).To understand the genealogical relationships between haplotypes and their‘blocky’structures,it is thus important to study their process of evolution subject to mutation,recombination and gene conversion.©The Author2005.Published by Oxford University Press.All rights reserved.For Permissions,please email:journals.permissions@ ii173joie and N.El-MabroukEarlier work on recombination and gene conversion has largely focused on statistical tests estimating the recombination events (Hudson and Kaplan,1985;Myers and Griffiths,2002;Song and Hein,2004),and on reconstructing the coalescent with recombina-tion and/or gene conversion,based on statistical models assuming constant population length,random mating,and given mutation and rearrangement rates per generation(Griffiths and Marjoram,1996; Wiuf and Hein,1999a,b,2000).Other methods based on algorithmic optimization have been considered for the reconstruction of a plaus-ible genealogy of haplotypes(Kececioglu and Gusfield,1998;Wang et al.,2001;Ukkonen,2002;Schwartz et al.,2002;Wu and Gu, 2001),but most of these reconstruction problems have been shown NP-hard.Consequently,simplified evolutionary models have been considered(Gusfield et al.,2004).In particular,because of a relat-ively simple pattern of haplotype diversity in the human genome with a domination of few common haplotypes(Jaruzelska et al.,1999; Labuda et al.,2000;Osier et al.,2002;Verrelli et al.,2002),the complexity of the haplotype network can be reduced by considering the most frequent haplotypes as the most likely to recombine.In thefirst part of this paper,we address the problem of infer-ring the most realistic pathway of mutations,recombinations and gene conversions generating a given haplotype from a population of h haplotypes of size m.This approach is informally considered in various population genetics studies.In particular,Zietkiewicz et al. (2003)analyzed haplotypes from the dys44segment of the dystrophin gene,and proposed putative genealogical reconstructions of these haplotypes by recombination of the most common ones.They were able to derive non-African haplotypes through at most two recom-binations.In contrast,haplotypes of the sub-Saharan Africans could not be related in a simple way to the set of common haplotypes. Previous systematic methods based on dynamic programming have been developed in the absence of gene conversion(El-Mabrouk and Labuda,2004;Schwartz et al.,2002).Introducing gene conversions requires a more involved dynamic programming algorithm,as not only haplotype prefixes,but also haplotype subsequences should be analyzed in this case.In our previous study(El-Mabrouk,2004), we formalized the problem and described the whole set of pathways involving a minimum number of recombinations and gene conver-sions leading to a haplotype.Here,we consider the more general case involving a penalty score model and describe a new dynamic programming algorithm that runs in time O(mhs2),where s is the maximum size of a gene conversion.This algorithm is described in Section2.In the second part of this paper,we present a new algorithm based on a similar evolutionary model,to infer haplotypes from genotypes. Preliminary to any human genetic project is the acquirement of a haplotype dataset.However,in diploid organisms,it is not feasible to examine homologous chromosomes separately.On the contrary, it is the(less informative)genotype,e.g.the combination of the two chromosomes,that is obtained.The haplotyping problem is then to extract,from this information,individual haplotypes.Sev-eral approaches have been developed for this purpose,beginning with the Clark’s inference approach(Clark,1990)and maximum-likelihood approaches(Excoffier and Slatkin,1995).In the absence of recombinations,more combinatorial approaches based on the per-fect phylogeny model have been developed(Gusfield,2002;Eskin et al.,2003).In the general case,the most widely used approach is PHASE,based on a Gibbs sampling method(Stephens et al.,2001; Stephens and Donnelly,2003).In most cases,the software reports a set of accurate haplotype pairs.However some genotypes give rise to ambiguous results,e.g.many possible haplotype pairs with low probabilities.Moreover,time before convergence may be long.In Section3,we present an efficient method,which runs in time(mh2), to resolve a given genotype with respect to a set of known haplo-types.In Section4,we give some preliminary results demonstrating the accuracy of this method for genotypes that have been revealed problematic for PHASE.2RECOVERING RECOMBINATION AND GENE CONVERSION PATHWAYS—ALGORITHM1We describe an algorithm thatfinds an optimal(least score)path-way of mutations,recombinations and gene conversions generating a given haplotype from a set HAP of known haplotypes.Most classical methods for inferring historical relationships between haplotypes assume an infinite site mutation model in which recurrent and back mutations are forbidden.Here,we consider a relaxed model which allows for recurrent and back mutations.2.1The model and notationsA haplotype of size m is a string of symbols which models m SNPs on a chromosomal segment.SNPs are usually biallelic such that in a population,only2nt are observed at each site.Therefore,haplotypes can be represented as binary strings of0s and1s(Fig.1).Ancestral alleles are usually represented by0s when they are known.A recombination between two haplotypes H1and H2can be modeled as an operation that breaks up H1and H2between sites i and i−1,and exchanges the two terminal parts of H1and H2 (Fig.2).A gene conversion between H1and H2is an operation that breaks up H1and H2into three parts each by choosing the same two pairs of adjacent sites in the two haplotypes,i−1,i and j,j+1,and exchanges the two middle parts of H1and H2(Fig.2).We will say that such a gene conversion affects sites i to j.As only one of the resulting haplotypes is transmitted,a recom-bination or a gene conversion can be represented as H1,H2−→H3, where H1,H2,H3are three haplotypes.Each SNP represents a mutation that has affected one haplotype in the population.Therefore,if recurrent mutations are ignored,then allelic changes can be explained solely by recombinations and gene conversions.In this paper,recurrent mutations are allowed,and we call a mutation an event that changes a0into a1or a1into a0in a haplotype.Schwartz et al.(2002)have considered a simplified probabilistic model allowing to evaluate a recombination and mutation pathway leading to a given haplotype.However,assigning the appropriate probabilities is an open problem by itself.In this paper,we consider an alternative approach,by attributing penalty scores for mutations, recombinations and gene conversions.The penalty score model is based on the following inputs:(1)MUT is the score of a mutation at any site in any haplotype.(2)REC(i)specifies the score of a recombination between sitesi and i−1.This value can be evaluated from the nucleotidedistance separating these sites.(3)GC(i,j)is the score of a gene conversion starting betweensites i−1and i and ending between sites j and j+1.This value depends on the length of the conversion tract,i.e.theii174Haplotype reconstructionH 4:H 3:H 2:H 1:0 0 1 0 1 1 0 1 1 0 0 0 1 0 0 11 0 0 1 0 1 1 0 0 0 1 1 1 0 0 01 1 0 0 0 1 1 0 0 0 1 0 1 1 1 00 1 1 1 0 0 0 0 1 1 1 1 0 1 1 0Gene −Conversion Gene–ConversionRecombination Gene −Conversion1 2 3 4 5 6 7 8 9 10 11 12 13 14 15 16PosHap Fig.3.A possible pathway generating the unitary haplotype from the set HAP ={H 1,H 2,H 3,H 4},with three gene conversions and one recombination.nucleotide distance separating sites i and j +1.We also define the parameter s representing the maximum site length of a gene conversion,l =(j −i)+1,that is the maximum number of sites that can be affected by a single gene conversion.This value,which depends on the nucleotide distances between the sites in the considered haplotypes,is usually small and serves as a bound for an efficient algorithmic complexity.(4)FREQ (p)is the score for choosing a particular haplotype H pas part of the solution.We use the negative log-frequency of H p .2.2The algorithmTo simplify the ensuing algorithmic developments,we recode the haplotypes in a way allowing to reformulate the problem as one of generating the unitary haplotype,that is the haplotype H such that H [i ]=1for any 1≤i ≤m .Let HAP be the set of h haplotypes of size m (Fig.3).We denote H p [i ..j ]=H p [i ]···H p [j ],for 1≤i ≤j ≤m .In other words,H p [i ..j ]is the subsequence of the haplotype H p of HAP beginning at position i and ending at position j .We denote by HAP [i ..j ]the set {H p [i ..j ],for 1≤p ≤h }.A pathway generating H [i ..j ]is said to end at haplotype H p if the last suffix of H [i ..j ]comes from H p .To compute the minimal penalty score C of a pathway generating H from HAP,we recursively compute the scores C(1,j)of the optimal pathways giving rise to the unitary haplotypes H [1..j ]from the set HAP [1..j ],for 1≤j ≤m .Let C p (i ,j)be the score of an optimal pathway R giving rise to H [i ..j ]and ending at haplotype H p .ThenC(i ,j)=min {C p (i ,j),for 1≤p ≤h }.We first show how to compute C p (i ,j)for i <j .The case i >j is symmetrical and obtained in the same way,but considering reversed haplotypes (read from right to left).Let REC (i ,j)=min k {REC (k),for i ≤k ≤j }and suppose first that H p [j ]=1.Then C p (i ,j)is one of the following (Fig.4):(1)C p (i ,j)=C p (i ,j −1):just extend the haplotype H p oneposition right.(2)If the last event of R is a recombination with H q betweensites j −1and j ,then C p (i ,j)=C q (i ,j −1)+REC (j)+FREQ (p).(3)If the last event of R is a gene conversion affectingsites k to j and R passes through C p (k −1),thenH hH pH qj mj–1HapPos k–1recombination (2)extension (1)gene conversion (4)gene conversion (3)i=1Fig.4.The main dynamic programming table and four possible cases for the last event of an optimal path giving rise to H [1..j ],with score C p (1,j).The dashed lines correspond to optimal subpaths stored in an auxiliary table.C p (i ,j)=C p (i ,k −1)+GC (k ,j)+C(k ,j).This case can happen only for i <k ≤j and j −k <s .(4)If the last event of R is a gene conversion affecting sites k to jand R passes through C q (k −1)with q =p ,then C p (i ,j)=C q (i ,k −1)+GC (k ,j)+C(k ,j)+REC (k ,j)+FREQ (p).Here the gene conversion overlaps an implicit recombination between sites k −1and j .This case can happen only for i <k ≤j and j −k <s .If H p [j ]=0,an additional mutational event is necessary to trans-form H p [j ]to 1with the cases (1)and (2).It does not apply to cases (3)and (4),since in these cases the value of H p [j ]is transformed by the gene conversion.Therefore,if we denote:M p (j)=0if H p [j ]=1MUT otherwise,C p (i ,j)=min {C p (i ,j −1)+M p (j),C(i ,j −1)+REC (j)+FREQ (p)+M p (j),min k {C p (i ,k −1)+GC (k ,j)+C(k ,j)},min k{C(i ,k −1)+FREQ (p)+REC (k ,j)+GC (k ,j)+C(k ,j)}}.ii175joie and N.El-MabroukInitialization:for j:=1to m doC(1,j):=∞;end for(j)for i:=1to m dofor j:=i to i+s−1doC(i,j):=∞end for(j)end for(i)For each column of the main dynamic programming table:for j:=1to m do“Reverse”reconstruction,beginning at position j:(An auxiliary table is required to store the C∗(j,∗)values)for i:=j down to j−s+1dofor p:=1to h docompute C p(j,i)C(j,i):=min(C p(j,i),C(j,i))end for(p)end for(i)“Forward”reconstruction to position j:for p:=1to h docompute C p(1,j)C(1,j):=min(C p(1,j),C(1,j))end for(p)end for(j)Fig.5.The algorithm for the computation of C(1,m).The basic cases are C p(i,i)=FREQ(p)+M p(i)for1≤i≤m and thefinal pathway is the one leading to the score C=C(1,m). The algorithm to recursively compute C(1,m)is described in Figure5.Complexity.For each column j of the main dynamic program-ming table,1≤j≤m,the algorithm is subdivided into two parts (Fig.5):•The‘reverse’computation of the C(j,i),for j−s<i≤j: for each haplotype p,this requires to consider all the values C(i,k),for i≤k<j.Therefore,the complexity of this part is O(hs2).•The‘forward’computation of C(1,j):for each haplotype p, this requires to consider the values C p(k,j),for j−s<k≤j.Therefore,the complexity of this part is O(hs).The total complexity of the algorithm is thus O(m(hs+hs2))= O(mhs2).3RECONSTRUCTING HAPLOTYPES FROM GENOTYPES—ALGORITHM2A genotype is commonly represented as a sequence of0,1and2, where0and1correspond to homozygous sites(both haplotypes have the same allele,i.e.two0s or two1s),and2represents heterozygous sites(a0on one haplotype and a1on the other).The haplotyping problem is to phase the heterozygous sites,i.e.to determine on which of the two haplotypes is the0allele and the1allele(Fig.6).2 1 2 0 1 2 0 1 20 1 1 0 1 1 0 1 1110010010H1H2Genotype:Resolution:Fig.6.A genotype G and two haplotypes representing a possible resolution of G.The most accurate haplotyping methods follow(at least implicitly) these principles:(1)If an unresolved genotype can be explained by a pair ofalready known haplotypes,then this pair is probably the right one.In case of many possible pairs,the most prob-able one depends on the frequencies of the haplotypes in the population.(2)Otherwise,at least one new haplotype is inferred.Any newhaplotype should be as close as possible,with respect to the genetic model,to the other ones in the population.In many cases,an initial set of haplotypes is directly obtained from the data.For example,Zietkiewicz et al.(2003)analyzed hap-lotypes composed of35polymorphisms from the dys44segment of the dystrophin gene.This gene is located on the X chromosome, which allows to directly observe the male haplotypes.The female haplotypes where then derived by using an ad hoc method based on the above principles.Haplotyping tools have been developed in the absence of a set of initial haplotypes.In particular,PHASE uses a Gibbs sampling method,beginning with an arbitrary resolution of the set of genotypes,and successively updating each pair of hap-lotypes with respect to the set of all other inferred haplotypes. The whole process is repeated for afixed number of times or until convergence.Pairs of haplotypes are then reported with their associated probabilities.However,in some cases convergence is not reached,and some genotypes give rise to many possible haplotype pairs with low probabilities.In these cases,altern-ative methods allowing to solve ambiguous genotypes may be valuable.In this section,we present a formal method to resolve a single genotype in light of a set of known(or inferred)haplotypes.The first step is tofind an optimal pathway of mutations and recombina-tions leading from the known haplotypes to the target genotype.This pathway in then used to infer the haplotype pair.The penalty model is based on the same three inputs MUT,REC(j) and FREQ(p)defined in the preceding section.3.1Finding an optimal pathwayWe generate the set G of all possible genotypes that can be obtained from two haplotypes of HAP.More precisely,G={G p,q= (H p,H q),for1≤p≤q≤h}.The problem is then tofind the recombination and mutation pathway of minimal score C generating the unresolved genotype G from G.For1≤j≤m,let C(j)be the score of an optimal pathway giving rise to G[1..j]from the set G[1..j],and C p,q(j)the score of such a path ending at genotype G p,q.ThenC(j)=min{C p,q(j),for1≤p,q≤h}.ii176Haplotype reconstruction Let R be an optimal pathway generating G[1..j]with scoreC p,q(j).Supposefirst that G p,q[j]=G[j].Then C p,q(j)iscomputed from some C p ,q (j−1)as follows:(1)If p=p and q=q (or similarly p=q and q=p ),thenwe just extend the genotype G p,q one position right.Thus,C p,q(j)=C p,q(j−1).(2)If p=q and p =q ,then there is one recombination betweenH p and H p (or similarly between H q and H q ),and C p,p(j)=C p ,p (j−1)+REC(j)+FREQ(p).(3)If{p,q}∩{p ,q }=∅,then two recombinations at site jare necessary,and C p,q(j)=C p ,q (j−1)+2.REC(j)+FREQ(p)+FREQ(q).(4)Otherwise,|{p,q}∩{p ,q }|=1.W.l.o.g.,assume p=p .Then there is a recombination between H q and H q ,andC p,q(j)=C p ,q (j−1)+REC(j)+FREQ(q).Let Cp ,q (j)be the value obtained from the preceding formula.IfG p,q[j]=G[j],mutation penalties should be added as follows: (a)If the values of G p,q[j]and G[j]are in{0,1}and p=q,then two mutations are necessary and C p ,q (j)=C p ,q (j)+ 2MUT.(b)If the values of G p,q[j]and G[j]are in{0,1},but p=q,thenonly one mutation is necessary and C p ,q (j)=C p ,q (j)+ MUT.(c)If G p,q(j)or G(j)has value2,then just one mutation isrequired and C(j)=C (j)+MUT.Thefinal result is C=C(m)with the associate path.Extension of the algorithm to include treatment of missing data is straightforward, since we simply need to consider that the value of the genotype at missing sites can be1,0or2without any additional cost. Complexity.It is possible to compute each value C p,q(j)in con-stant time,since REC(j),MUT,FREQ(p)and FREQ(q)do not depend on p ,or on q .All we need is to compute(at no additional cost)the following values,which correspond to the best choices of genotypes for the three possible scenarios of recombination:•min p ,q (C p ,q (j−1))•min p (C p ,q(j−1))•min q (C p,q (j−1))Since1≤p≤q≤h and1≤j≤m,the global complexity of the algorithm is in O(mh2).3.2Inferring haplotype pairsIn the case of a single recombination at one site(cases2and4above), there is no ambiguity to deduce the corresponding haplotype pair.For example,suppose we have a genotype G=0221,the haplotypes H1=1111,H2=0000,H3=0101and the following optimal pathR=H3H2H3H2H3H1H3H1.In this case,inferring the underlying pair of haplotypes isstraightforward:G=0101 0011.However,in the case of two recombinations at the same site (case3above),the phase can not be deduced for SNPs located apart Table1.Results summed over30independent simulated datasets of size 50for different values of the recombination parameter R=4N e r(120 independent datasets in total)4N e r Ambiguous genotypesCorrectly resolvedTotal By PHASE By Algorithm2 16491224 24482021 32551523 40541618Wefixed the mutation parameter toθ=4N eµ=16.The size of the resulting haplotypes varies from60to100polymorphic sites.this site.For example:H4H3H4H3H1H2H1H2≡H4H3H4H3H2H1H2H1.In this case,additional information should be considered to choose between the two different scenarios.Additional penalties can also be added to favor informative pathways.The situation with mutations is similar.Cases(a)and(b)leave no ambiguities,whereas case(c)does not allow to decide on which of the two haplotypes the mutation should be placed.Here also,it is possible to prevent this case by adding an extra penalty to this scenario.If ambiguous mutations persist,we choose to place them on the new haplotype,i.e.the farthest one from known haplotypes.4EXPERIMENTSWe tested the haplotyping method(algorithm2)on simulated and biological data.4.1Simulated dataWe simulated various independent datasets under the infinite-sites model by using the Hudson’s program(Hudson,2002).Each set consisted of50genotypes obtained by random pairing of100haplo-types,assuming a panmictic constant size population.For each set, we used PHASE version2.1with default parameters.The software returns the best possible pairs of haplotypes explaining each gen-otype,with a probability associated to each pair.We considered a genotype as ambiguous when all its best haplotype pairs were reported with P≤0.3.For other genotypes,we stored all pairs of haplotypes reported with P≥0.3in the set HAP of known hap-lotypes.Wefinally applied our method to the ambiguous genotypes. We then compared the predicted pairs with the true ones,and reported the number of correctly resolved genotypes for each method.All tests were done with penalty11for mutations and10for recombinations. Table1shows the results obtained on datasets generated with different recombination parameters.In each case,the number of ambiguous genotypes correctly resolved by our algorithm is higher. However,the impact on the overall performance remains small. Moreover,these preliminary results do not allow the evaluation of the effect of recombination rates on the accuracy of our method. We then performed similar tests with longer haplotypes(Table2). In this case,the number of ambiguous genotypes correctly resolved by our algorithm is significantly higher.Moreover,solving each ambiguous genotypes required no more than a few seconds.ii177joie and N.El-MabroukTable2.Results obtained for20independent simulated datasets of size50 generated with the parameters4N eµ=4N e r=32Dataset Ambiguous genotypesCorrectly resolvedTotal By PHASE By Algorithm2 1302221233014302571763007411830194121074511614125121351114403152001631317401186241930120702Total841444The size of the resulting haplotypes varies from125to185polymorphic sites. Table3.Results for datasets of different size generated from haplotypes of the APOE locusDataset size Ambiguous genotypesCorrectly resolvedTotal By PHASE By Algorithm2 25993829 50872232 75992149Results are summed over100independent experiments.4.2APOE locus dataSequence haplotype variation in5.5kb of genomic DNA encom-passing the APOE locus was identified in96individuals by Fullerton et al.(2000).They found30distinct haplotypes(considering the21 SNPs only).We applied the approach described in Section4.1to the sets of genotypes generated from these haplotypes.Each genotype comes from a pair sampled according to the haplotypes frequencies. We repeated100independent experiments,for three different sizes of dataset(number of genotypes).Results are shown in Table3.Our method performs better on large datasets.This could be attributed to the fact that it requires a sufficient number of haplotypes,and the more genotypes in the dataset,the larger is the set of haplotypes reported by PHASE with P≥0.3.5CONCLUSIONWe have developed formal tools tofind probable evolutionary path-ways giving rise to a given haplotype or genotype,under a realistic model involving mutations,recombinations and gene conversions. This is thefirst step toward a more general heuristic allowing to reconstruct the complete evolutionary network connecting all haplo-types.Another important application would be to estimate the rates of recombinations compared with those of gene conversions of different types,based on population data.A direct application to the haplotyping problem has been presen-ted.The preliminary results are encouraging and reveal a good performance on both simulated and biological data.The time efficiency of the algorithm makes it interesting to use as a com-plementary tool,especially for long haplotypes and large datasets. Moreover,our method can also be used as an independent tool when a previous set of haplotypes has been determined.In both cases,it has the advantage of providing an evolutionary pathway which helps to assess the reliability of the inferred haplotypes.However,more experiments have to be performed to determine the best way of choosing the penalty scores.The ones we used for our experiments slightly favor recombinations over mutations,and haplotype frequencies mostly serve the selection of the optimal path among those with the same number of recombination and mutation. At this stage,gene conversions were not explicitly included in our evolutionary model for haplotyping,as our method does not naturally extend to that case.However,this should have a limited effect as gene conversions usually involve one or two polymorphic sites and thus can be treated as mutations.ACKNOWLEDGEMENTSWe are grateful to Damian Labuda for the fruitful discussions. This work was supported by grants from the Natural Sciences and Engineering Research Council of Canada(N.E.M)and the Canadian Institutes of Health Research(M.L).Conflict of Interest:none declared.REFERENCESAndolfatto,P.and Nordborg,M.(1998)The effect of gene conversion on intralocus associations.Genetics,148,1397–1399.Clark,A.(1990)Inference of haplotypes from PCR-amplified samples of diploid populations.Mol.Biol.Evol.,7,111–122.El-Mabrouk,N.(2004)Deriving haplotypes through recombination and gene conversion.put.Biol.,2,241–256.El-Mabrouk,N.and Labuda,D.(2004)Haplotypes histories as pathways of recombina-tions.Bioinformatics,20,1836–1841.Eskin,E.et al.(2003)Large scale reconstruction of haplotypes from genotype data.In:Proceedings of the Seventh Annual International Conference on Research in Computational Molecular Biology(RECOMB),April10–13,Berlin,Germany.ACM Press,New York,NY,pp.27–31.Excoffier,L.and Slatkin,M.(1995)Maximum-likelihood estimation of molecular haplotype frequencies in a diploid population.Mol.Biol.Evol.,12,921–927. Fullerton,S.et al.(2000)Apolipoprotein e variation at the sequence haplotype level: implications for the origin and maintenance of a major human polymorphism.Am.J.Hum.Genet.,67,881–900.Gabriel,S.et al.(2002)The structure of haplotype blocks in the human genome.Science, 296,2225–2229.Greenspan,G.and Geiger,D.(2003)Model-based inference of haplotype block vari-ation.In Miller,W.,Vingron,M.and Istrail,S.(eds),Proceedings of the Seventh Annual International Conference on Research in Computational Molecular Biology (RECOMB),April10–13,Berlin,Germany.ACM Press,New York,NY,pp.131–137.ii178。
BIOINFORMATICS APPLICATIONS NOTE Vol.21no.52005,pages676–679doi:10.1093/bioinformatics/bti079 PhylogeneticsHyPhy:hypothesis testing using phylogeniesSergei L.Kosakovsky Pond1,Simon D.W.Frost1and Spencer V.Muse2,∗1Antiviral Research Center,University of California San Diego,San Diego,CA92103,USA and2Bioinformatics Research Center,North Carolina State University,Raleigh NC27695-7566,USAReceived on May12,2004;revised on September14,2004;accepted on October1,2004Advance Access publication October27,2004ABSTRACTSummary:The HyPhy package is designed to provide aflexible and unified platform for carrying out likelihood-based analyses on multiple alignments of molecular sequence data,with the emphasis on studies of rates and patterns of sequence evolution.Availability:Contact:muse@Supplementary information:HyPhy documentation and tutorials are available at 1INTRODUCTIONResearch problems in molecular evolution,though wide-reaching in their goals,can be separated into two somewhat disjoint classes: studies of evolutionary history(phylogenetics),and studies of pro-cesses that govern molecular evolution.Of course,each of these two categories encompasses many different types of questions, and many investigations require studies of both phylogeny and evolutionary process.Software for molecular evolution is focused disproportionately on addressing issues of phylogenetic reconstruc-tion,with a number of outstanding comprehensive packages to choose from.On the contrary,software for addressing questions about the evolutionary process tends to take the form of stand-alone programs that answer only one or two quite specific problems.There are a few exceptions,including PAML(Yang,1997),Mr Bayes (http://morphbank.ebc.uu.se/mrbayes/info.php)and library-oriented projects such as PAL(Drummond and Strimmer,2001)and PyEvolve (Butterfield et al.,2004).HyPhy was developed as a unified platform for designing,running and interpreting likelihood-based analyses of sequence alignments,with emphasis on modeling the evolutionary process and ease of use.The HyPhy package serves a number of purposes and a number of audiences.It includes(1)a simple menu-based interface to many standard methods of molecular evolutionary analysis;(2)a high-level programming language(HyPhy Batch Language,HBL)that allows users to implement and distribute new methods of sequence analysis or to modify existing methods to satisfy the novelties of their data and analysis objectives;(3)a graphical user interface(GUI)that enables users to access much of the power of the programming language without the time investment of learning the language itself. Unlike most other software packages for sequence analysis, HyPhy was designed to allow users to develop new methods of ana-lysis quickly and easily,as opposed to simply offering a friendly interface to collections of existing methods.Also unlike most other To whom correspondence should be addressed.packages,it was designed with multi-gene data sets in mind.Since the system was crafted in this style from the outset,HyPhy is uniquely positioned to address the needs of a wide variety of researchers as they seek to analyze comparative genomic data sets of ever-growing size and complexity.2METHODS AND DESIGN2.1Standard analysesThe following is a list of point-and-click prepackaged analyses currently included in HyPhy.2.1.1Modelfitting Given a character alignment,a tree,and a model, obtain maximum likelihood parameter estimates,assess parameter estima-tion variability by asymptotic normality,profile likelihood,or bootstrap,and reconstruct ancestral character states using an efficient maximum likelihood joint reconstruction method.2.1.2Model selection An all-in-one implementation and extension of Model-Test(Posada and Crandall,1998)for selection of nucleotide models; novel exhaustive schemes for selecting the bestfitting nucleotide rate matrix and nucleotide bias corrections for codon substitution models.2.1.3Molecular clock Test for the presence of a molecular clock on all or some model parameters(e.g.only on synonymous rates).Clocks can be global or local(applied only to a subtree).Statistical P-values can be calculated via the bootstrap.2.1.4Phylogenetic reconstruction Distance matrix construction, cluster analysis,and neighbor joining,including information-based distance measures for unaligned sequences(Li et al.,2001).Maximum likeli-hood reconstruction(with or without a topological constraint)under any substitution model using exhaustive search,sequential addition,or star decomposition.NNI and SPR branch swapping are available.2.1.5Positive selection Various likelihood and approximate methods for detecting natural selection operating on alignment sites and lineages. Many of the methods are new and in the process of being published.The procedures allow for potentially complex patterns of substitution rate vari-ation,including simultaneous variation of synonymous and non-synonymous substitution rates across sites.The methods can test for differential selection between populations and parts of the tree,and they can be run quickly on clusters of computers.A parallelized implementation of popular methods described in Yang et al.(2000)is also included.A public website implement-ing many of the methods can be accessed at . 2.1.6Relative rate tests A very general implementation of likelihood-based relative rate test methods(e.g.Muse and Weir,1992).Any subset of the model parameters can be tested(for instance,only the synonymous or the non-synonymous substitution rates).Allows for automatic exhaustive comparisons of all pairs of taxa in an alignment and optional bootstrap P-values.676©The Author2004.Published by Oxford University Press.All rights reserved.For Permissions,please email:journals.permissions@HyPhy2.1.7Relative ratio tests An implementation of the relative ratio test methods(Muse and Gaut,1997).Built-in tools for exhaustive comparisons of all pairs of taxa in a set of alignments and optional bootstrap P-values.2.1.8Miscellany KH tests(Hasegawa and Kishino,1994);fitness amino acid models(Dimmic et al.,2000);sliding window analyses; estimation of site-by-site substitution rates similar to Olsen et al.(1994, /∼gary/programs/DNArates.html).2.1.9Data tools Various tools for managing and manipulating sequence alignments.The list of standard analyses is being continuously expanded,and advanced package users can customize existing analyses or write new ones.2.2Graphical user interfaceThe HyPhy GUI enables even casual users of HyPhy to design complex data analyses,run them,process the results,and create publication-quality graph-ics.The package includes a feature-rich data viewer and processor,a tree viewer and editor,a graphical model design component,a hypothesis design and testing module,a charting and numerical data analysis module,a built-in help system,and a full-featured text console.All modules support print-ing and data import and export.Most components provide easy means for the user to expand their functionality.Sample screen shots for some of the components are shown in Figure1.The HyPhy documentation page (/docs)includes numerous examples and a tutorial on to how to use the GUI.2.3The‘hello world’of HBLThe HBL programming language allows for rapid implementation of new molecular evolutionary analyses,and is illustrated by the simple HBL pro-gram below.The following nine lines of code read an alignment of four sequences,define the F81model of sequence evolution(Felsenstein,1981), define a tree topology for the four taxa,find maximum likelihood estimates of all model parameters,and print the results:DataSet myData=ReadDataFile("../data/demo.seq");/*load an alignment from file*/ DataSetFilter myFilter=CreateFilter(myData,1);/*choose the sites to analyze(inthis case,all of them)*/ HarvestFrequencies(obsFreqs,myFilter,1,1,1);/*compute character frequencies*/F81RateMatrix={{*,mu,mu,mu}{mu,*,mu,mu}{mu,mu,*,mu}{mu,mu,mu,*}};Model F81=(F81RateMatrix,obsFreqs);/*define the model of substitution*/ Tree myTree=((a,b),c,d);/*specify a phylogenetic tree*/ LikelihoodFunction theLikFun=(myFilter,myTree); Optimize(paramValues,theLikFun);/*define and maximize thelikelihood function*/fprintf(stdout,theLikFun);/*output the results*/This tutorialfile and a complete explanation of the syntax are included with the distribution of HyPhy.For more details,tutorials and examples related to HBL,please refer to /docs/2.4HyPhy coreThe foundation of HyPhy consists of the following major modules.2.4.1Data reader andfilter This module reads,writes and converts sequence alignments(nucleotide,amino acid,codon or custom alphabets with custom genetic codes)in a variety offile formats,including PHYLIP, NEXUS and FASTA.Thefile format and standard alphabets(nucleotide or amino acid)are detected automatically.The module allows the user to select an arbitrary subset of any datafile for subsequent analysis and to perform mer-ging operations on data sets,including matching alignment sites or sequences to regular expressions.The module provides aflexible mechanism for tabu-lating observed frequencies of characters or groups of characters(e.g.codons or dinucleotides)from a data set.2.4.2Expression parser This module includes∼100functions and operations for processing and evaluating expressions of numbers,matrices and strings(e.g.x:=y(w+z)).Examples include the cumulative distribu-tion functions for common distributions,standard mathematical and logical operators,and many matrix operations.HyPhy also includes a growing func-tion toolkit,including numerical integration of arbitrary expressions,root finding,maximization of user-defined functions and expression simplifica-tion.The HyPhy parser can handle numerical,string,matrix and associative array data types.The parser is used to impose constraints on model paramet-ers,define rate matrices and process results.It is also heavily relied upon by the HBL interpreter and many other modules.2.4.3HBL interpreter This module converts scripts written in the HyPhy batch language into appropriate commands in the computational core. The language also providesflow control(conditional and looping statements and user-defined functions),user interaction(prompts),and window display options.2.4.4Tree parser The tree parser builds bifurcating or multifurcating phylogenetic trees from standard‘Newick’strings and assigns evolutionary models to tree branches.It has the ability to assign different models to dif-ferent tree branches.HyPhy can test rooted and unrooted trees for equality or inclusion,match tree patterns(e.g.to check whether certain sequences are monophyletic),find common subtrees and forests among trees,and reroot trees.2.4.5Likelihood function module This module transparently con-structs a wide range of likelihood functions,determines the number of parameters in a function,parses constraints on parameters,and performs appropriate non-linear optimization to obtain maximum likelihood parameter estimates,with applicable parallel enhancements.An efficient implementa-tion of likelihood evaluations(Kosakovsky Pond and Muse,2004)is included. HyPhy can performfitting,inference and simulation on any character data, using any Markov model of character substitution.The modeling capabilit-ies include(1)processes with multiple discrete rates variation across both sites and branches,with a large user-extensible collection of rate distribu-tions,(2)flexible means to define mixtures of models,(3)hidden Markov models,(4)the ability to combine heterogeneous data,such as interspersed coding(codon)and non-coding(nucleotide)sequences,into a single analysis, (5)a rich collection of predefined models for nucleotide,codon and amino acid data.3IMPLEMENTATIONHyPhy is written in ANSI C++and includes full-featured nat-ive GUIs for Mac OS(Carbon)and the Windows platform (Win32),and precompiled binaries are available.A command line version of the package can be built from the distributed source on any platform that is supported by the GCC fam-ily of compilers and includes POSIX compliant system lib-raries.HyPhy includes several open source libraries that are compiled into the binaries:GNU regular expressions library (/pub/gnu/regex/regex-0.12.tar.gz),SQLite data-base engine()and a Mersenne twister random number generator(http://www.math.keio.ac.jp/matumoto/emt.html).677S.L.Kosakovsky Pond etal.CAB D Fig.1.Graphical components of HyPhy .(A )Data viewer used to set-up an analysis with mixed (intron-exon)data.(B )Tree viewer using a fish-eye projection to explore a large tree.(C )Model parameter viewer used to set up a relative ratio constraint between partitions.(D )Model editor used to define a custom nucleotide substitution model.(E )A 3D chart of inferred counts of sites in different synonymous and non-synonymous rate classes in a data set,compared with the expected continuous surface.HyPhy transparently supports shared memory multiprocessing on systems that include a POSIX threads library by distributing like-lihood function calculations across processors,and it can use MPI-distributed environments via the batch language.Many of the standard analyses are programmed to take advantage of MPI clusters when possible.ACKNOWLEDGEMENTSThis work was supported in part by grants from the NSF (DBI-0096033and DEB-9996118to SVM),NIH (5R01AI47745and 5U01AI43638Supp),the University of California Universitywide AIDS Research Program (IS02-SD-701),and by a University of678HyPhyCalifornia,San Diego Center for AIDS Research/NIAID Develop-mental Award to S.D.W.F.(grant no.2P30AI36214).We thank two anonymous reviewers for useful comments on earlier versions of this manuscript.REFERENCESButterfield,A.,Vedagiri,V.,Lang,E.,Lawrence,C.,Wakefield,M.,Isaev,A.and Huttley,G.(2004)Pyevolve:a toolkit for statistical modelling of molecular evolution.BMC BIOINFORMATICS,5,1.Dimmic,M.,Mindell,D.and Goldstein,R.(2000)Modeling evolution at the protein level using an adjustable amino acidfitness model.In Pacific Symposium on Biocomputing, Honolulu.Drummond,A.and Strimmer,K.(2001)PAL:an object-oriented programming library for molecular evolution and phylogenetics.Bioinformatics,17,662–663. Felsenstein,J.(1981)Evolutionary trees from DNA-sequences—a maximum-likelihood approach.J.Mol.Evol.,17,368–376.Hasegawa,M.and Kishino,H.(1994)Accuracies of the simple methods for estimating the bootstrap probability of a maximum-likelihood tree.Mol.Biol.Evol.,11,142–145.Kosakovsky Pond,S.and Muse,S.(2004)Column sorting:rapid calcula-tion of the phylogenetic likelihood function.Systematic Biology53, 685–692.Li,M.,Badger,J.,Chen,X.,Kwong,S.,Kearny,P.and Zhang,H.(2001)An information-based sequence distance and its application to whole mitochondrial genome phylogeny.Bioinformatics,17,149–154.Muse,S.V.and Gaut,B.S.(1997)Comparing patterns of nucleotide substitution rates among chloroplast loci using the relative ratio test.Genetics,146, 393–399.Muse,S.V.and Weir,B.S.(1992)Testing for equality of evolutionary rates.Genetics, 132,269–276.Olsen,G.J.,Pracht,S.and Overbeek,R.(1994)DNArates.Posada,D.and Crandall,K.(1998)Modeltest:testing the model of DNA substitution.Bioinformatics,14,817–818.Yang,Z.H.(1997)PAML:a program package for phylogenetic analysis by maximum put.Appl.Biosci.,13,555–556.Yang,Z.H.,Nielsen,R.,Goldman,N.and Pedersen,A.M.K.(2000)Codon-substitution models for heterogeneous selection pressure at amino acid sites.Genetics,155, 431–449.679。
Vol.23no.112007,pages1321–1330 BIOINFORMATICS ORIGINAL PAPER doi:10.1093/bioinformatics/btm026 Structural bioinformaticsDe novo SVM classification of precursor microRNAs from genomic pseudo hairpins using global and intrinsic folding measures Kwang Loong Stanley Ng1,2,Ãand Santosh K.Mishra1,21Bioinformatics Institute,Singapore138671and2NUS Graduate School for Integrative Sciences&Engineering, Centre for Life Sciences,Singapore117456Received on July1,2006;revised on December13,2006;accepted on January23,2007Advance Access publication January31,2007Associate Editor:Charlie HodgmanABSTRACTMotivation:MicroRNAs(miRNAs)are small ncRNAs participating in diverse cellular and physiological processes through the post-transcriptional gene regulatory pathway.Critically associated with the miRNAs biogenesis,the hairpin structure is a necessary feature for the computational classification of novel precursor miRNAs(pre-miRs).Though many of the abundant genomic inverted repeats (pseudo hairpins)can be filtered computationally,novel species-specific pre-miRs are likely to remain elusive.Results:miPred is a de novo Support Vector Machine(SVM) classifier for identifying pre-miRs without relying on phylogenetic conservation.To achieve significantly higher sensitivity and speci-ficity than existing(quasi)de novo predictors,it employs a Gaussian Radial Basis Function kernel(RBF)as a similarity measure for29 global and intrinsic hairpin folding attributes.They characterize a pre-miR at the dinucleotide sequence,hairpin folding,non-linear statistical thermodynamics and topological levels.Trained on200 human pre-miRs and400pseudo hairpins,miPred achieves93.50% (5-fold cross-validation accuracy)and0.9833(ROC score).Tested on the remaining123human pre-miRs and246pseudo hairpins,it reports84.55%(sensitivity),97.97%(specificity)and93.50% (accuracy).Validated onto1918pre-miRs across40non-human species and3836pseudo hairpins,it yields87.65%(92.08%), 97.75%(97.42%)and94.38%(95.64%)for the mean(overall) sensitivity,specificity and accuracy.Notably,A.mellifera,A.geoffroyi, C.familiaris, E.Barr,H.Simplex virus,H.cytomegalovirus,O.aries, P.patens,R.lymphocryptovirus,Simian virus and Z.mays are unambiguously classified with100.00%(sensitivity)and493.75% (specificity).Availability:Data sets,raw statistical results and source codes are available at .sg/$stanley/Publications Contact:stanley@.sg;santosh@.sg Supplementary information:Supplementary data are available at Bioinformatics online.1INTRODUCTIONMicroRNAs(miRNAs)constitute an abundant class of small ($21–23nts),endogenous,and evolutionarily conserved ncRNA molecules that mediate post-transcriptionally the production of intra-cellular proteins in most eukaryotes via sequence-specific target mechanisms(Bartel,2004). The founding members lin-4and let-7miRNAs discovered respectively in1993and2000,are key heterochronic regulators directing temporal aspects of development timing in early larval C.elegans(Lee et al.,1993;Reinhart et al.,2000). Subsequently,thousands of novel miRNA genes have been unraveled across plants,worms,flies,vertebrates and even viruses;44000miRNAs spanning45species are listed in miRBase8.2(Griffiths-Jones et al.,2006).Biologically pivotal and more prevalent genomically than presumed,miRNAs perform key regulatory roles in diverse cellular and physiolo-gical events such as apoptosis,proliferation,and fat metabo-lism in the D.melanogaster(Brennecke et al.,2003;Xu et al., 2003);patterning and developmental specification in plants (Chen,2004;Palatnik et al.,2003);genetic diseases including oncogenesis(Calin and Croce,2006;Lu et al.,2005). Previously,novel miRNA genes were identified almost exclusively by directional cloning of endogenous small RNAs and high-throughput sequencing of large numbers of cDNA clones(Lagos-Quintana et al.,2001;Lau et al.,2001;Lee and Ambros,2001).Conventional forward genetic screening is highly biased toward abundantly and/or ubiquitously expressed miRNAs that usually dominate the cloned products(Lagos-Quintana et al.,2003).Evidently,miRNAs expressed constitu-tively at low levels or in highly constrained tissue-and time-specific patterns are intricate to detect experimentally. Computational prediction techniques have been employed extensively to overcome this technical hurdle(Berezikov et al.,2006).The underlying principle revolves around two tenets.First,precursor miRNAs(pre-miiRs)should possess statistically significant and evolutionarily conserved(a)sym-metric RNA hairpin,a structural prerequisite functionally critical for the early stages of the mature miRNA biogenesis (Bartel,2004;Kim,2005);details at supplemental‘Biogenesis of Mature MicroRNAs’.Second,the hairpin feature of pre-miiRs should be distinct from those of random inverted repeats (termed as pseudo hairpins)that can potentially fold into dysfunctional candidate hairpins e.g.1.1E7in human(Bentwich et al.,2005)and4.4E4in C.elegans(Pervouchine et al.,2003). Removing these overwhelming and irrelevant genomic pool of false-positives without sacrificing excessively putative pre-miiRs is most technically challenging,as they are relatively short in*To whom correspondence should be addressed.ßThe Author2007.Published by Oxford University Press.All rights reserved.For Permissions,please email:journals.permissions@1321 at TNA on June 4, 2014 /Downloaded fromlength($60–80nts in animal and$100–400nts in plants)and have highly diverse base compositions(Zhang et al.,2006b). Unlike protein-coding genes,they frequently exhibit seemingly weak or lack detectable statistically significant primary-sequence signals such as the open reading frames(ORFs), promoter motifs,and codon signatures(Berezikov et al.,2006). Earlier attempts in circumventing these difficulties relied on identifying close homologs of published pre-miRs e.g.let-7 (Pasquinelli et al.,2000).This can be as straightforward as aligning sequences through NCBI BlastN(McGinnis and Madden,2004)while allowing several mismatches and gaps depending on their inter-phylogenetic distance.False-positives not residing in the orthologous locations are deemed not conserved phylogentically among closely related species, and are consequently masked(Floyd and Bowman,2004; Pasquinelli et al.,2000).The candidate orthologues of evolutionary conserved miRNAs genes are then assessed for their capability to potentially fold into hairpin structures with the lowest Minimum Free Energy of folding(MFE), have!16-bps involving the first22-nts of the mature miRNA embedded within one arm of the fold-back precursor,and in the absence of large internal loops or bulges especially large asymmetric ones(Ambros et al.,2003).Apparently, mere application of simple alignment queries and positive-selection rules is likely to overlook novel families lacking clear homologues to published mature miRNAs.Advanced comparative approaches like MiRscan(Lim et al., 2003a,b),MIRcheck(Jones-Rhoades and Bartel,2004), miRFinder(Bonnet et al.,2004b),miRseeker(Lai et al.,2003),findMiRNA(Adai et al.,2005),PalGrade (Bentwich et al.,2005)and MiRAlign(Wang et al.,2005) have systematically exploit the greater availability of sequenced genomes for eliminating the over-represented false-positives. Cross-species sequence conservation based on computationally intensive multiple genome alignments is a powerful approach for genome-wide screening of phylogentically well conserved pre-miiRs between closely related species.However,it suffers lower sensitivity in divergent evolutionary distance(Berezikov et al.,2005;Boffelli et al.,2003).Identifying pre-miRs that differ significantly or evolve rapidly at the sequence level while retaining their characteristic evolutionary conserved hairpin structures may also be an issue.Another significant drawback is that non-conserved pre-miRs with genus-specific patterns are likely to evade detection.Pathogenic viral-encoded pre-miiRs have been uncovered in E.Barr virus,K.sarcoma-associated herpesvirus,M. -herpesvirus68,H.cytomegalovirus and Simian virus40that neither share significant sequence similarities with known host pre-miRs nor among themselves (Cullen,2006;Sarnow et al.,2006).(Table1)To surmount the technical shortfalls of compara-tive works for distinguishing species-specific and non-conserved pre-miRs,several state-of-the-art de novo(or ab initio) predictive approaches have been extensively developed. The inaugural and definitive work by Sewer et al.(2005) compiled40distinctive sequence and structural‘markers’from the hairpins that obviates the use of comparative genomics information.The SVM classifier model trained with the experimental domain knowledge and binary-labeled featureTable1.Existing(quasi)de novo classifiers,in chronological order,for distinguishing novel pre-miRs from genomic pseudo hairpinsWorks Classifiers Num Description of features DatasetsP N SE SPSewer et al.(2005)SVM4016statistics computed from the entirehairpin structure,10from the longestsymmetrical region of the stem,11fromthe longest relaxed symmetry region andthree from the candidate stem-loop.H178539571.0097.00ProMiR(Nam et al.,2005)HMMÀA hairpin structure is represented as apairwise sequence.Each position of thepairwise sequence has two states,structural and hidden.H136100073.0096.003SVM(Xue et al.,2005)SVM32Each hairpin is encoded as a set of32triplet elements:a nucleotide type andthree local continuous sub-structure-sequence attributes e.g.‘A(((’and‘G(..’.HH30391000244493.3092.3088.1089.00BayesMIRfinder (Yousef et al.,2006)NBI8462secondary structural features derivedfrom the foot,mature,and head of ahairpin-loop;12sequence featuresextracted from the candidate sequence.C.EM112215015083.0097.0096.0091.00RNAmicro(Hertel and Stadler2006)SVM122lengths of stem and hairpin loop regions;1GþC sequence composition;4sequenceconservation;4thermodynamic stability;and1structural conservation.Animal13639491.1699.47(Classifiers)SVM(Support Vector Machine),NBI(Naıve Bayesian Induction)and HMM(Hidden Markov Model).(Num)Number of features.(Data sets)H (H.sapiens),C.E(C.elegans)and M(M.musculus).P(real pre-miR s),N(pseudo hairpins),SE(Sensitivity)and SP(Specificity).K.L.S.Ng and S.K.Mishra1322 at TNA on June 4, 2014 /Downloaded fromvectors,recovered71%of the positive pre-miRs with a remarkably low false-positive rate of$3%.It also predicted $50to100novel pre-miRs for several species;$30%of these were previously experimentally validated.The validation rate among the predicted cases that were conserved in!1other species was higher at$60%;many had not been detected by comparative genomics approaches.The3SVM(Xue et al., 2005)improved the performances to$90.00%for human and up to90.00%in other species.Albeit its methodological simplicity,promising performances and independence of comparative genomics information,3SVM was strictly limited to classifying RNA sequences that fold into secondary structures without multiple loops.RNAmicro(Hertel and Stadler,2006)incorporating sequence and structural informa-tion as part of its feature vector,reported an incredibly promising efficiency of91.16%(sensitivity)and99.47% (specificity).Besides requiring computationally expensive mul-tiple sequence alignments for inputs,another major drawback of its classification pipeline was it excluded assessment of alignment windows whose consensus structure contained a stem with510-bps or!2hairpins with!5-bps each,and classified them instantly as non-pre-miRs.ProMiR(Nam et al.,2005)exploited a probabilistic co-learn-ing model technique HMM to discriminate miRNA genes according to their pairwise aligned sequences.It achieved a promisingly low false-positive rate of4.00%,but compromised for a less performing sensitivity of73.00%.A relatively recent work BayesMIRfinder(Yousef et al.,2006)adopted an alternative discriminative machine learning algorithm NBI as its underlying classifier model.Notwithstanding its technical novelty,BayesMIRfinder relied on the comparative analysis of conserved genomics regions for post-processing to yield a considerably higher sensitivity of97.00%and compar-able specificity of91.00%in mouse to existing algorithms.2MATERIALS AND METHODS2.1Biologically relevant datasetsTraining,testing and independent data sets.They were pooled separately from four independent sources;details at supplemental‘Materials and Methods’.To improve the quality of this comprehensive collection, sequences with non-ACG[TU]nucleotides were filtered and no sequence was reused.Entire set of2241pre-miRs was obtained from miRBase8.2(Griffiths-Jones et al.,2006);8494pseudo hairpins from human RefSeq genes(Pruitt and Maglott,2001)without undergoing any known experimentally validated alternative splicing(AS)events. For hyperparameter estimation and training the decision function of miPred,binary-class labeled samples consisting of200human pre-miRs (positives)and400pseudo hairpins(negatives)were randomly selected without replacement to avoid the classifier being skewed toward specifically screened training samples.The remaining123human pre-miRs(positives)and246randomly selected pseudo hairpins(negatives) were used for testing.They are denoted as TR-H and TE-H.The comparable ratio of1:2ensures that the selected negatives contribute more significantly to the specificity of a classifier than positives,while avoiding the problem of overtraining.Typically,the decision function of SVM converges to a solution where all samples belonging to the smaller class are classified as that of the larger class if the class sizes differ significantly.The performance of miPred was evaluated against three datasets IE-NH,IE-NC and IE-M.They represent the remaining1918pre-miRs spanning40non-human species(positives)and3836 randomly selected pseudo hairpins(negatives);12387functionalncRNAs(negatives)from Rfam7.0(Griffiths-Jones et al.,2005);and31mRNAs(negatives)from GenBank DNA database(Benson et al.,2005),respectively.Four complete viral genomes.They were downloaded from GenBankDNA database(Benson et al.,2005),namely E.Barr virus(EBV;171,823-bps;DNA circular;AJ507799.2),K.sarcoma-associated herpes-virus(KSHV;137,508-bps;DNA linear;U75698.1),M. -herpesvirus68strain WUMS(MGHV68;119,451-bps;DNA linear;U97553.2)andH.cytomegalovirus strain AD169(HCMV;229,354-bps;DNA linear;X17403.1).2.2Computational pipeline of miPredBackground of SVM.Integral to miPred is the Support Vector Machine (SVM),a supervised classification technique derived from the statisticallearning theory of structural risk minimization principle(Burges,1998).Given its simplicity to deal easily with multi-dimensional data sets thatcan be noisy or redundant(non-informative or highly correlated),SVMhas been adopted extensively as an invaluable discriminative machinelearning tool to address diverse bioinformatics problems(Dror et al.,2005;Han et al.,2004;Liu et al.,2006).Briefly,the primary objective of SVM is to explicitly construct a multi-dimensional hyperplane separating a set of complex feature vectors x iinto binary labeled classes y i2(1orÀ1)with the distance between the hyperplane and the closest support vectors(the margin)maximized.Innon-linear separable cases,the maximum-margin hyperplane is obtainedafter transforming uniquely the input variables into a high-dimensionalfeature space via the Gaussian Radial Basis Function kernel(RBF)K(x,x i)in Equation(1).Typically,SVM is conducted using three straightforward steps:feature extraction,training the decision functionon a set of selected binary-labeled training vectors,and classifying agiven test sample x i into either positive or negative classes(Burges,1998).K x,x iðÞ¼expðÀ xÀx i kk2Þ, ¼1=2 2:ð1ÞExtraction of miPred’s features.Considering that a single criterion tofilter pseudo hairpins has not yet been identified,miPred undertakes anovel approach that posits the entire hairpin-shaped structure of eachpre-miR can be characterized solely into a feature vector x i containing29RNA global and intrinsic folding attributes,without relying on phylogenetic conservation information(Ng and Mishra,2007);detailsat supplemental‘Materials and Methods’.Seventeen base composition variables:16dinucleotide frequencies%XY such that X,Y2P¼[A,C,G,U],and1aggregate dinucleotide frequency%GþC ratio. Dinucleotide is the preferred predicting descriptor to mononucleotideor higher-order frequencies,as it strikes a compromise between the resolution and computation tractability.Six folding measures:adjustedbase pairing propensity dP(Schultes et al.,1999),adjusted MinimumFree Energy of folding(MFE)denoted as dG(Freyhult et al.,2005;Seffens and Digby,1999),MFE index1MFEI1(Zhang et al.,2006a),adjusted base pair distance dD(Freyhult et al.,2005;Moulton et al.,2000),adjusted shannon entropy dQ(Freyhult et al.,2005),and MFEindex2MFEI2.One topological descriptor:degree of compactness dF(Fera et al.,2004;Gan et al.,2004).Five normalized variants of dP,dG,dQ,dD and dF i.e.zP,zG,zQ,zD and zF derived from dinucleotide shuffling.We computed the17sequence composition variables as wellas the non-linear statistical thermodynamics measures dQ and dD by acustom Perl program interfaced to the module RNAlib of Vienna RNAPackage1.4(Hofacker,2003);dG by RNAfold program(Hofacker,2003)that predicts the most favorable RNA secondary structureand the corresponding MFE;the topological descriptors S and dFby a custom program RNAspectral.After synthesizing the set ofDe novo SVM classification of precursor microRNAs1323at TNA on June 4, 2014/Downloaded fromrandom RNA sequences,the normalized variants zP,zG,zQ,zD, and zF were computed.Parameter estimation,training,and evaluation of miPred.The libSVM version 2.82(.tw/$cjlin/libsvm),a free SVM implementation was used for training and testing miPred’s binary classification.Samples were randomly selected without replacement via a custom python script.Foremost,the29attributes of miPred were rescaled linearly by the svm-scale program to the interval[À1.0,1.0]to guard against asymptomatic biasness in the numeric ranges for all the data sets;larger variance may dominate the classification e.g.[6.0,50.0] versus[À0.5,À0.2].All miPred classifier models were generated with ‘svm-train-b1-c2C-g ’;default RBF kernel;‘-b1’option computes the SVM probability estimates(P-values)for classification threshold-ing.As both the penalty parameter C(determines the trade-off between training error minimization and margin maximization)and the RBF kernel parameter (defines the nonlinear mapping from input space to some high-dimensional feature space)are critical for the performance of SVM(Duan et al.,2003),they were optimally calibrated by an exhaustive grid-search strategy.Briefly,at each hyperparameter pair (C, )selected from the search space log2C2[À10,À9,...,15]and log2 2[À15,À14,...,10],we performed a5-fold cross validation. The training data set was randomly partitioned into approximately five distinct equal-sized subsets.Repeating the validation process five times for each subset i.e.retaining a set for testing and the remaining four sets for training,the average accuracy of the five models gave the5-fold leave-one-out cross-validation(LOOCV)accuracy rate(Duan et al., 2003).To avoid over-fitting the generalization,the best combination of hyperparameters(C, )maximizing the5-fold LOOCV accuracy rate served as the default setting for training miPred.Finally,the classification was conducted on the testing and independent evaluation data sets with‘svm-predict-b1’.See supplemental‘Materials and Methods’for details on statistical tests and performance evaluation metrics.3RESULTS AND DISCUSSION3.1Training and classifying human pre-miRsWe calibrate miPred using TR-H,the optimal hyperparameter pair(C, )is(16.0,0.03125)that maximizes the5-fold cross-validation accuracy rate of93.50%.A classification score ranging[0.0,1.0]is assigned by miPred to each hairpin,which is designated as a candidate pre-miR if its score is beyond a specified threshold.Across the entire spectrum of thresholds,a trade-off generally exists between specificity(greater value at higher threshold)and sensitivity(value increases at lower threshold)(Dror et al.,2005;Liu et al.,2006).The ROC analysis of miPred’s classification model(figure not shown) reported that the ROC score is approximately unity i.e.0.9833. (Fig.1a and Table S1)With the default miPred’s threshold predefined at0.5,the SE(Sensitivity),SP(Specificity)and ACC (Accuracy)reported for TR-H are88.00%,97.50%and 94.33%,respectively.Here,SP4SE is more desirable in screening for novel pre-miRs from the entire genomic sequences or cloned small RNAs as abundant dysfunctional hairpins are encoded in the human(Bentwich et al.,2005)and C.elegans (Pervouchine et al.,2003)genomes.An implication of a slightly lower SP than SE will reduce the signal(genuine pre-miRs)to background(pseudo hairpins)ratio,inflating significantly the effort and resources demanded in experimental validation of the putative precursor transcripts as biologically functional pre-miRs.(Fig.1b and Table S1)Next,conducting miPred onto TE-H obtains comparable performances of84.55%(SE),97.97%(SP) and93.50%(ACC).In all,miPred can classify correctly86.69% (280/323)human pre-miRs as positives and97.68%(631/646) pseudo hairpins as negatives.Three of the human pre-miRs designated as negatives receive very low classification scores from miPred:hsa-mir-565(0.454),hsa-mir-566(0.012)and hsa-mir-594(0.187).Coincidently,they have been suspected to be falsely annotated as precursor transcripts encoding mature miRNAs on two grounds(Berezikov et al.,2006). First,both hsa-mir-565and hsa-mir-594overlap with tRNA annotations;hsa-mir-566overlaps with Alu repeats. Second,none was represented by41clone or differentially expressed in a Dicer-deficient cell-line(Cummins et al.,2006). Nevertheless,we believe that neither criterion is sufficient to eliminate a candidate as repeat-(Smalheiser and Torvik,2005) and pseudogene-derived miRNAs(Devor,2006)have been discovered,and miRNAs expressed at low levels may be elusive to detection in a Dicer-disrupted mutant(Berezikov et al., 2006).(Table S1)In contrast,3SVM based on triplet-encoding scheme(Xue et al.,2005)yields slightly poorer results:86.00%(SE),97.00%(SP)and93.33%(ACC)for TR-H;73.15%,95.37%and87.96%for TE-H;or overall81.49% (251/308)of human pre-miRs as positives and96.43%(594/616) of pseudo hairpins as negatives.The evaluation demonstrates the outstanding and consistent classification performance of miPred in partitioning specifically human pre-miRs from pseudo hairpins.The improved distinct separation by miPred is likely due to its excellent capability in recognizing the specific intrinsic and global features of human pre-miRs against those of pseudo hairpins.3.2Improved classification of non-human pre-miRs (Fig.1c and Table S1)We next extend the validation of miPred to IE-NH and quantify its mean(overall)SE,SP,and ACC. Here,mean denotes the average performance for all species within IE-NH;overall performance is derived from the entire IE-NH independent of species.In this setting,miPred yields excellent and comparable classification performances to those of TR-H and TE-H,with respective SE,SP and ACC of 87.65%(92.08%;1766/1918non-human pre-miRs as positives), 97.75%(97.42%;3737/3836pseudo hairpins as negatives)and 94.38%(95.64%).(Table S1)In contrast,3SVM reports 80.10%(86.15%;1443/1675non-human pre-miRs as positives), 96.81%(96.27%;3225/3350pseudo hairpins as negatives)and91.24%(92.90%).Apparently,these results point to miPred asa more credible and consistent classifier for distinguishing reliably specie-specific and evolutionary well-conserved pre-miRs across plants,worms,flies,vertebrates and viruses (Griffiths-Jones et al.,2006).Notably,those pre-miRs present in the genomes of A.mellifera,A.Geoffroyi,C.familiaris,E.Barr,H.Simplex virus, H.cytomegalovirus,O.aries,P.patens,R.lymphocryptovirus, Simian virus and Z.mays are unambiguously identified by miPred with100.00%(SE)and493.75%(SP).Moreover, pre-miRs encoded in C.briggsae and C.elegans are excellently classified with SE of94.74%and84.96%,as well as SP of 99.34%and96.90%;the remaining two pathogenic virusesK.L.S.Ng and S.K.Mishra1324 at TNA on June 4, 2014 /Downloaded fromM. -herpesvirus and K.sarcoma-associated herpesvirus have SE of 88.89%and 91.67%,as well as SP of 94.44%and 100.00%.Since miPred was not trained initially on any species-specific pre-miRs and especially viral-encoded ones,this supporting evidence reinforces the premise that its selected descriptors have successfully captured the intrinsic and global properties characterizing the biologically functional pre-miRs spanning across different species including viruses.(Table S2)An obvious question is how viral-encoded pre-miRs can be distinguished by miPred so outstandingly,especially when they are known to lack homologs in other viruses or in the host (Cullen,2006;Sarnow et al .,2006).As there are few experimental studies elucidating their biological activities and biogenesis (Sullivan et al .,2005),we speculate pathogenic viruses do not possess homologous genes that can express functionally similar host miRNA processing proteins e.g.Drosha,Dicer and RISC.After infecting the human immune cells,they hijack these critical host proteins to regulate viral and host gene expression (Cullen,2006;Sarnow et al .,2006).This will facilitate their viral replication and pathogen-esis by blocking the innate or adaptive host immune responses or by interfering with the appropriate regulation of apoptosis,S e w e re t . a l (H )P r o M i R (H )3S V M (H )3S V M (H )B a y e s M I Rf i n d e r (C .E )B a y e s M I R f i n d e r (M )R N A m i c r o (A n i m a l s )m i P r e d (H )m i P r e d (e x c e p tH )P erce n t a g e (%)A ccu ra c y(%)miPredmiPred 3miPred3/5miPred 3/10miPred 3/15miPred 3/20miPred3/21miPred3/22miPred3/23miPred3/24miPred3/25miPredImiPredIImiPredIII (TR-H and TE-H)pre-miRs (IE-NH)ncRNAs (IE-NC)mRNAs (IE-M)A c c ura c y(%)C i s -r e g C i s -r e g |f r a m e s h i f t C i s -r e g|I R E S C i s -r e g |r i b o s w i t c h C i s -r e g |th e r m o r e g u l a t o r G e n e G e n e |a n ti s e n s e G en e|ri b o z y m eG e n e |r R N A G e n e |s n R N A G e n e |sn R N A |g u i d e |C /D -b o x Gene |sn R NA |g u id e |H /A C A -b o x Gene|s nR N A |s p l i c i n g Ge n e |sR N A Ge n e|tR N A I n t r on mRN As S p ecif ic i ty(%)87.10 F1 score F 2s co reSensitivity (%)5060708090100S pec i fi city(%)miPred scores C o u n t s miPred scores C o u n t s (a)(d)(c)(g)(f)(e)Fig.1.(a Àb )Distribution of TR-H (200human pre-miRs and 400pseudo hairpins)and TE-H (remaining 123human pre-miRs and 246pseudo hairpins)by miPred scores.Default miPred decision boundary (vertical dash line at 0.5).(c )Distribution of IE-NH (1,918pre-miRs across 40non-human species and 3836pseudo hairpins)by specificity and sensitivity;details at Table S1.Dash lines denote overall performances.For clarity,only specie names are assigned in left-bottom quarter.(d )Performance comparison with existing (quasi)de novo classifiers (Table 1).H (H.sapiens ),C.E(C.elegans )and M (M.musculus ).(e )Distribution of IE-NC (12387ncRNAs)and IE-M (31mRNAs)by specificity;details at Table S3.Dash line denotes overall specificity.(f )F1and F2scores for features of miPred and 3SVM ;details at Table S5.For clarity,only top 12ranking attributes of miPred are shown.(g )Effects of feature selection on miPred ’s accuracy;details at Table S6.Dash lines denote accuracies of original miPred .De novo SVM classification of precursor microRNAs1325 at TNA on June 4, 2014/Downloaded from。
BIOINFORMATICS APPLICATIONS NOTE Vol.21no.112005,pages2791–2793doi:10.1093/bioinformatics/bti403 Genetics and population analysisVariScan:Analysis of evolutionary patterns from large-scaleDNA sequence polymorphism dataAlbert J.Vilella,Angel Blanco-Garcia,Stephan Hutter†and Julio Rozas∗Departament de Genètica,Facultat de Biologia,Universitat de Barcelona,Diagonal645,08028Barcelona,Spain Received on January19,2005;revised on March16,2005;accepted on March21,2005Advance Access publication April7,2005ABSTRACTSummary:VariScan is a software package for the analysis of DNA sequence polymorphisms at the whole genome scale.Among other features,the software(1)can conduct many population genetic ana-lyses;(2)incorporates a multiresolution wavelet transform-based method that allows capturing relevant information from DNA poly-morphism data;(3)facilitates the visualization of the results in the most commonly used genome browsers.Availability:The software with documentation is available under the GNU GPL software license from:http://www.ub.es/softevol/variscan Contact:jrozas@INTRODUCTIONAnalysis of DNA sequence polymorphisms and of single nucleotide polymorphisms(SNPs)are powerful approaches in understanding the evolutionary forces underlying nucleotide variation and in map-ping genes of disease.Currently,the detection of Darwinian positive selection(Sabeti et al.,2002;Olson,2002)is receiving a lot of interest,since,for instance,knowledge of the specific gene or gen-omic region under selection can help pharmaceutical research in vaccine and drug development,or in vaccination strategies.This detection,nevertheless,is not easy since demographic processes could mimic its footprint.The distinctive signature of natural selec-tion can nonetheless be detected by analysing the spatial distribution of polymorphisms across broad regions of the genome(Sabeti et al., 2002;Quesada et al.,2003)by using coalescent-based methods (Kingman,1982;Hudson,1990;Rosenberg and Nordborg,2002). The sliding window(SW)method has been extensively used for exploratory DNA polymorphism data analysis(Rozas and Rozas, 1995).Unfortunately,the SW approach has a number of limita-tions,such as the determination of the appropriate window size or the problem of multiple comparisons,that are critical in genome-wide based analysis.Here,we describe the VariScan software which has been designed for the analysis of DNA sequence polymorph-isms at the whole genome scale.Among other features,VariScan incorporates a wavelet transform(WT)-based analysis for capturing relevant information from DNA polymorphism data(Liò,2003).WT allows obtaining low and high frequency components from signals and therefore,it could be useful in capturing global and local features, such as conserved regions,peaks and valleys of nucleotide diversity,∗To whom correspondence should be addressed.†Present address:Department Biology II—Evolutionary Biology,University of Munich,Munich,Germany linkage disequilibrium(LD)clusters from DNA polymorphism data. The software has,therefore,the appropriate data handling and ana-lysis capabilities needed for genome-wide resequencing projects, which ultimately could lead to the detection of the imprint of natural selection.SYSTEMS AND METHODSVariScan software is written in ANSI C and has been tested on Linux, MacOSX and Win32platforms.It has been optimized for the high speed processing of large DNA sequence datafiles(∼100sequences of∼100Mb each).Indeed,the algorithms have been implemented for a running time of O(n),where n is the length of the DNA sequence.The inputfiles are multiple aligned DNA sequence data in a number of formats as MAF, MGA,XMFA,PHYLIP or the HapMap genotype format.Although VariScan can conduct some analysis using unphased data(in general,genotypic data is phase-unknown),the gametic phase information is needed in some of the implemented methods(e.g.LD,Haplotype diversity);therefore, the gametic phase should be determined before using these methods in VariScan.IMPLEMENTATIONMolecular population genetics parametersVariScan implements a number of population genetics paramet-ers including coalescent-based statistics(Rozas et al.,2003).In particular,VariScan estimates(1)summary statistics of nucleotide and haplotype polymorphism levels,(2)linkage disequilibrium-based statistics and(3)several coalescent-based tests of neutrality. VariScan can estimate these parameters on a specific number of sequences,or considering different options of treating gaps and miss-ing data.All of these analyses can be conducted using the sliding window(SW)method that,in turn,can be used to obtain a graphical representation of the results.Wavelet transform-based analysisVariScan can also conduct a signal decomposition analysis by means of WT methods.Unlike SW,WT-based results are nearly independ-ent of the chosen window length and,therefore,are more suitable for the separate detection of features of variable lengths independ-ently of their genomic background.The signal,which is the raw profile of the population genetic parameter estimated along the DNA sequence,is analysed by using LastWave v2.0software(E.Bacry, http://www.cmap.polytechnique.fr/∼bacry/LastWave/).We chose Daubechies’D4as the default waveletfilter(Daubechies,1992)since it is adequate for locating features as peaks and valleys from a signal,©The Author2005.Published by Oxford University Press.All rights reserved.For Permissions,please email:journals.permissions@2791A.J.Vilella etal.Fig.1.Application of the MRA analysis to the Patil et al.(2001)data.Lower panel:MRA analysis from the nucleotide diversity profile along∼28Mb region encompassing most of the21q chromosome(A).Signal reconstruction of high-frequency bands with information from5to9MRA levels(B)Signal reconstruction from10to14MRA levels.Levels1to4are not shown.Upper panel:small-scale map showing a chromosomal region(positions33500000–34500000)with reduced levels of nucleotide diversity.This1Mb region includes a number of genes,such as the receptors for interferon alpha/beta/gamma and Interleukin-10,and it is enclosed within one of the target-regions selected in the ENCODE project for their biological interest(ENm005).The regions of low-variation(track A)fit well with the larger haploytpes(Perlegen haplotype track),obtained independently by Patil et al.(2001).with a minimum degree of smoothness(Liòand Vanucci,2000); thisfilter,nevertheless,can be changed by the user.The sig-nal is further decomposed to all analysing levels(MRA analysis; Mallat,1999)using the orthogonal wavelet decomposition method; the orthogonal property of Daubechies wavelets allows the fur-ther reconstruction of the signal.The outcome,which is the reconstructed wavelet-transform profiles of the population genetic parameter along the sequence,can be used to identify genomic features at multiple resolution levels(i.e.at global and local scales);for instance,features located in diverse nucleotide diversity backgrounds.Results visualizationVariScan permits the visualization of the results through available genomic browsers(Fig.1).For instance,VariScan can write the outcome on custom annotation track formats as the WIG format used in the Genome browser at UCSC(Kent et al.,2002)or the xyplot format in GBrowse(Stein et al.,2002),conferring a visual representation of the wavelet-transform profile integrated with cur-rent annotation tracks for the genome of interest.As a result,it is possible to relate statistic profile results(of nucleotide diversity,LD, etc.)with present annotated genomic features(specific genes,inter-genic regions,haplotype information,etc.)from available genome projects.ACKNOWLEDGEMENTSWe are very grateful to M.Aguadé,J.M.Aroca,B.Audit,M.Casas, J.Castresana,S.O.Kolokotronis and C.Segarra for their valu-able comments and suggestions.This work was supported by grant BMC2001-2906from the Dirección General de Investigación Científica y Técnica,Spain,conferred on M.Aguadé,and by grant TXT98-1802from the Dirección General de Enseñanza Superior e Investigación Científica,Spain,conferred on J.R.2792VariScan:DNA polymorphism analysisREFERENCESDaubechies,I.(1992)Ten Lectures on Wavelets.SIAM,Philadelphia.Hudson,R.R.(1990)Gene genealogies and the coalescent process.Oxf.Surv.Evol.Biol., 7,1–44.Kent,W.J.et al.(2002)The Human Genome Browser at UCSC.Genome Res.,12, 996–1006.Kingman,J.F.C.(1982)On the genealogy of large populations.J.Appl.Prob.,19A, 27–43.Liò,P.(2003)Wavelets in bioinformatics and computational biology:state of art and perspectives.Bioinformatics,19,2–9.Liò,P.and Vanucci,M.(2000)Finding pathogenicity islands and gene transfer events in genome data.Bioinformatics,16,932–940.Mallat,S.(1999)A Wavelet Tour of Signal Processing.2nd edn.Academic Press, San Diego.Olson,S.(2002)Seeking the signs of selection.Science,298,1324–1325.Patil,N.et al.(2001)Blocks of limited haplotype diversity revealed by high-resolution scanning of human chromosome21.Science,294,1719–1723.Quesada,H.et al.(2003)Large-Scale Adaptive Hitchhiking upon High Recombination.Genetics,165,895–900.Rosenberg,N.A.and Nordborg,M.(2002)Genealogical trees,coalescent theory,and the analysis of genetic polymorphisms.Nat.Rev.Genet.,3,380–390.Rozas,J.and Rozas,R.(1995)DnaSP,DNA sequence polymorphism:an interactive program for estimating population genetics parameters from DNA sequence data.Comput.Appl.Biosci.,11,621–625.Rozas,J.et al.(2003)DnaSP,DNA polymorphism analyses by the coalescent and other methods.Bioinformatics,19,2496–2497.Sabeti,P.C.et al.(2002)Detecting recent positive selection in the human genome from haplotype structure.Nature,419,832–837.Stein,L.D.et al.(2002)The generic genome browser:a building block for a model organism system database.Genome Res.,12,1599–1610.2793。
Vol.21no.242005,pages4416–4419doi:10.1093/bioinformatics/bti715 BIOINFORMATICS APPLICATIONS NOTESequence analysisImproving disulfide connectivity prediction with sequential distance between oxidized cysteinesChi-Hung Tsai1,Bo-Juen Chen1,Chen-hsiung Chan1,Hsuan-Liang Liu2andCheng-Yan Kao1,3,Ã1Department of Computer Science and Information Engineering,National Taiwan University,Taipei,Taiwan106,2Department of Chemical Engineering and Graduate Institute of Biotechnology,National Taipei University of Technology,Taipei,Taiwan10608and3Institute for Information Industry,Taipei,Taiwan106Received on August19,2005;revised and accepted on October11,2005Advance Access publication October13,2005ABSTRACTSummary:Predicting disulfide connectivity precisely helps towards the solution of protein structure prediction.In this study,a descriptor derived from the sequential distance between oxidized cysteines(denoted as DOC)is proposed.An approach using support vector machine(SVM) method based on weighted graph matching was further developed to predict the disulfide connectivity pattern in proteins.When DOC was applied,prediction accuracy of63%for our SVM models could be achieved,which is significantly higher than those obtained from pre-vious approaches.The results show that using the non-local descriptor DOC coupled with local sequence profiles significantly improves the prediction accuracy.These improvements demonstrate that DOC, with a proper scaling scheme,is an effective feature for the prediction of disulfide connectivity.The method developed in this work is available at the web server PreCys(prediction of cys–cys linkages of proteins). Availability:.tw:5433/Disulfide/Contact:cykao@.twSupplementary information:Supplementary data,detailed results, tables and information are available at . tw:5433/Disulfide/1INTRODUCTIONDisulfide bonds,commonly found in extracellular proteins,stabilize folded conformations as they contribute to the stability of the three-dimensional structures with respect to thermodynamics (Wedemeyer et al.,2000).Since disulfide bonds impose length and angle constraints on the backbone of a protein,correct pre-diction of disulfide connectivity can be employed to dramatically reduce the search in conformational space and greatly raise the accuracy for protein structure prediction(Huang et al.,1999).Dif-ferent methods(Fariselli and Casadio,2001;Fariselli et al.,2002; Vullo and Frasconi,2004)have been developed to predict disulfide connectivity with the prior knowledge of the oxidization states of cysteine residues.These methods can be classified into two categories:(1)patternwise or(2)pairwise.The major difference between them is whether the methodology is developed to deal with alternative disulfide connectivity patterns(Vullo and Frasconi, 2004;Zhao et al.,2005)or the relationships between cysteine pairs(Fariselli and Casadio,2001;Baldi et al.,2005;Ferre`and Clote,2005).This difference decides how the information is encoded.However,the prediction accuracies of these methods are still limited so far($50%).Besides the methodology used,another critical factor determin-ing the predicting performance is the descriptor employed.Fariselli and Casadio(2001)computed residue contact potentials according to the nearest-neighbor residues of bonded cysteines.Secondary structure(Baldi et al.,2005;Ferre`and Clote,2005)and solvent accessibility(Baldi et al.,2005)were also used as descriptors to represent input information.All these descriptors only describe the local environments of bonded cysteines.However,a disulfide bridge is a long-range interaction between two linearly distant cysteines. Descriptors containing local information only are insufficient for predicting disulfide connectivity accurately.Therefore,information regarding relationships between cysteines is highly desired. Harrison and Sternberg(1994)have suggested that sequence separation between bonded cysteines correlates strongly with spe-cific connectivity patterns.Zhao et al.(2005)also observed that disulfide connectivity pattern is highly conserved with the same cysteine-separation pattern of oxidized cysteines.Although there have been some attempts(Vullo,2004;Baldi et al.,2005)to take advantage of such information by using descriptors such as posi-tions of cysteines or relative sequence length,no emphasis has been addressed on the effects of these features so far.In this paper,a descriptor derived from the linear sequence dis-tance between oxidized cysteines(denoted as DOC)was used to demonstrate its power on predicting disulfide connectivity.A pair-wise method using support vector machine(SVM)to generate bonding potentials of cysteine pairs was developed.This method was further validated with a dataset derived from Swiss-Prot 39(SP39),and significant improvements were obtained when theÃTo whom correspondence should be addressed.The authors wish it to be known that,in their opinion,the first two authorsshould be regarded as joint First Authors.ÓThe Author2005.Published by Oxford University Press.All rights reserved.For Permissions,please email:journals.permissions@ The online version of this article has been published under an open access ers are entitled to use,reproduce,disseminate,or display the open access version of this article for non-commercial purposes provided that:the original authorship is properly and fully attributed;the Journal and Oxford University Press are attributed as the original place of publication with the correct citation details given;if an article is subsequently reproduced or disseminated not in its entirety but only in part or as a derivative work this must be clearly indicated.For commercial re-use,please contact journals.permissions@non-local descriptor DOC coupled with local sequence profiles was applied.These results reveal that DOC is an effective feature in disulfide connectivity prediction.The web interface service of the method proposed in this study for disulfide connectivity prediction is available at .tw:5433/Disulfide/2METHODOLOGY2.1Prediction of the connectivity pattern ofdisulfide bridgesWith prior knowledge of the oxidation states of cysteine residues, a prediction strategy similar to previous studies(Fariselli and Casadio,2001;Baldi et al.,2005;Ferre`and Clote,2005)was applied.The whole problem was mapped to an undirected complete graph,where oxidized cysteines were considered as vertices and the probabilities of connectivity between cysteine pairs were assigned as the weights of the edges between corresponding vertices.Then the disulfide connectivity pattern can be inferred by solving the maximum weight matching of this graph,which implies maximum probabilities for bonding pairs of this resulting pattern.2.1.1SVM In this work,SVM was employed to predict the poten-tial of connectivity between cysteines.SVM has been applied broadly within thefield of computational biology to pattern-recognition pro-blems and is a promising technique for data classification(Vapnik, 1998).Given data x1,...,x1,we set their labels,y i,as+1if x i is in class1and asÀ1if x i belongs to class2.Then with these training data, SVM solves an optimization problem for binary classification:min v‚b‚j 1v T vþCX li¼1j i and y i v T w x iðÞþbÀÁ!1Àj i‚j i!0‚ð1Þwhere x i is mapped to a higher dimensional space by the function w;j i is the training error allowed and C is the cost of error.Moreover,SVM can further be solved to approximate posterior class probability P(y i¼1|x i)with a sigmoid function(Platt,2000):P y i¼1j f iðÞ¼1i‚ð2Þwhere A and B are parameters and f i¼v T w(x i)+ing(2),we can infer the bonding probability for each pair of cysteines.The software LIBSVM(Chang and Lin,2000),a library for SVMs,was adopted in our experiments.2.1.2Data encoding Two descriptors were mainly considered to encode input data for the SVM:(1)local sequence profiles (evolutionary information)around target cysteines from multiple sequence alignments and(2)the linear DOC.We generated sequence profiles by performing multiple sequence alignments with the widely used program PSI-BLAST(Altschul et al.,1997).For each cysteine pair Cys(i,j),profiles were extracted using a window centered at cysteines i and j.The window size indicates the scope of vicinity of the target cysteine and determines how much information is provided for our models.In our experi-ments,the window size was set to13,and the values of elements in the profiles were scaled to[0,1].For a cysteine pair with sequence indexes i and j,the correspond-ing DOC is defined as follows:DOC i‚jðÞ¼k iÀj k:ð3ÞSince scaling approaches may affect the performance of SVM, three scaling schemes for DOC were tested:(1)DOC L,DOC normalized with the protein sequence length L.(2)DOC max,DOC normalized with the maximum value of thewhole dataset.(3)DOC log,DOC values normalized with the logarithm function.2.1.3Maximum weight matching Features were encoded with respect to each pair of cysteines,and SVM models were trained with these data to generate posterior probabilities that indicate the potential of connectivity between cysteine pairs.After the bonding probability of each cysteine pair was produced by SVM models,an implementation of Gabow’s algorithm(Gabow,1973), wmatch(Rothberg,http://elib.zib.de/pub/Packages/mathprog/ matching/weighted/),was used tofind the maximum weight match-ing.Finally,the matching with maximum weight was transformed to the corresponding disulfide connectivity pattern.2.2Evaluation criteriaOur models were evaluated by Q p and Q c which are defined as follows:Q p¼C pT p‚Q c¼C cT c‚ð4Þwhere C p is the number of proteins whose connectivity patterns are correctly predicted;T p is the total number of proteins in the test set;C c is the number of disulfide bridges correctly predicted and T c is the total number of disulfide bridges in test proteins.3IMPLEMENTATION AND RESULTS3.1DatasetIn order to compare our method with the approaches reported previously(Vullo and Frasconi,2004;Baldi et al.,2005),the same dataset extracted from SP39(Bairoch and Apweiler,2002) was employed.The samefiltering procedure(Fariselli and Casadio, 2001)was applied to ensure only high quality and experimentally verified intra-chain disulfide bridge annotations were included.For cross-validation,this dataset was further divided into four subsets so that each of the two shared sequence homology30%.3.2Cross-validation of SP39Table1lists the accuracies of4-fold cross-validation performed with the dataset SP39for our model along with the results reported ing sequence profiles only,our SVM models obtained a Q P of59%,which is better than those obtained in previous works. This may benefit from the generality of SVM,which avoids over-fitting during the training process.Another reason for the improve-ment is the enlarging of window size when extracting sequence profiles.We tried to use different window sizes to build SVM models,and the accuracy of the predictions is shown in Figure1. The overall Q P increases with enlarging window size and peaks at 13,which was adopted in this ing the same window size of 5as used by Vullo and Frasconi(2004)and Baldi et al.(2005), similar accuracy of52%was also obtained using our method. Moreover,when DOC was used,the prediction accuracy was further improved.To explore the effects of scaling schemes on DOC,three scaling functions were considered:DOC L,DOC maxDisulfide connectivity prediction4417and DOC log .The trend of DOC between cysteine bonding pairs in dataset SP39is shown in Figure 2a,and the distributions of DOC L ,DOC max and DOC log are also shown in Figure 2b–d,respectively.As can be seen,DOC max remains the distribution of the DOC since the scaling is simply performed by dividing the distance with a fixedvalue.On the other hand,the originally skewed distribution of DOC becomes close to a normal distribution after logarithm function was applied,and the distribution of DOC L becomes blurred due to the variation of sequence lengths.The prediction accuracies of 59and 61%were obtained by using the scaling function DOC L or DOC max .On the other hand,the highest prediction accuracy of 63%was obtained by using the scaling function DOC log ,which was selected to build our SVM models for disulfide connectivity prediction.These results suggest that the scaling of DOC can affect its contribution to our models.With a proper scaling function,DOC can enhance the performance of SVM models.3.3PreCys (prediction of cys–cys linkages in proteins)web serverThe PreCys server (at .tw:5433/Disulfide/)provides the service of disulfide connectivity prediction by the method developed in this work.In addition,a simple CSP search can also be accessed on the website.This server provides two SVM models built from Swiss-Prot releases 39and 47.With the sequence and the positions of oxidized cysteines (optional)input,the bonding probabilities of cysteine pairs and the final connectivity pattern can be generated.Additional experimental results and the chain lists used can be found at this website.4DISCUSSION AND CONCLUSIONThere are two major categories for the methods of disulfide con-nectivity prediction.The ‘patternwise’approaches take the whole protein as a unit directly and rank alternative connectivity patterns (Vullo and Frasconi,2004).They can easily include global infor-mation,such as the sequence length,amino acid contents or the positions of all cysteines.On the other hand,the ‘pairwise’methods(Baldi et al .,2005;Ferre`and Clote,2005)lack the overview of the whole protein and are usually limited to the scope of local environ-ments of cysteines.However,the patternwise methods often suffer from the problem of insufficient data,especially when the number of disulfide bonds increases.For proteins with five disulfide bonds,there aresomeFig.1.The accuracy (Q p )of predictions using different window sizes to extract sequence profiles on the datasetSP39.Fig.2.Histogram of the fraction of chains versus (a )the original distribution of DOC without normalization,(b )DOC L ,(c )DOC max and (d )DOC log in the dataset SP39.Table 1.Results of cross-validation on the data extracted from SP39MethodsB ¼2B ¼3B ¼4B ¼5B ¼2–5Q p (%)Q c (%)Q p (%)Q c (%)Q p (%)Q c (%)Q p (%)Q c (%)Q p (%)Q c (%)MC graph-matching a 5656213617372212938NN graph-matching b 6868223720372263442BiRnn-2profile c 737341512437133044492D-Rnn profile d 74745161274411414956dNN2e 62—40—55—26—49—CSP72725466335018365258SVM profile76765362486244605965SVM profile +DOC log79795362557058716370a Fariselli and Casadio (2001).bFariselli et al .(2002).cVullo and Frasconi (2004).dBaldi et al .(2005).eFerre`and Clote (2005),only results of Q p are available.C.-H.Tsai et al.4418patterns that only have one instance in the dataset.These patterns are not likely to be predicted correctly by patternwise methods because there is not enough information for model training.For example,the connectivity patterns of the protein chains CTRA_BOVIN (PDB:1HJA,pattern:[1–4,2–3,5–9,6–7,8–10],Fig.3)and UROK_HUMAN (PDB:1LMW,pattern:[1–3,2–4,5–9,6–7,8–10])only appear once in the dataset SP39.The patternwise method CSP fails to predict the disulfide connectivity of these chains,because no template is available for the patterns to be pre-dicted.On the other hand,our pairwise SVM models can still predict their connectivity correctly,since the pattern can be assembled by the bonding pairs predicted.In addition,the imbalance situation between the positive and negative data differs for pairwise and patternwise methods.As to a protein with B disulfide bonds,the positive/negative ratio is 1:(2B À2)for pairwise encoding.However,for the patternwise encoding,the imbalance is more severe,since there is only one correct pattern among the (2B À1)!!generated entries.Taking B ¼5for an example,the positive/negative ratio is only 1:8in pairwise encoding.With the same bond number B in patternwise encoding,there are 945entries where the positive/negative ratio is 1:944.Such severe imbalance can bias the learning process and result in poor models.Due to the insufficiency of data and the severe imbalance issue of patternwise encoding,we adopted the pairwise approach in our method.In this paper,we developed a method to predict disulfide con-nectivity based on SVMs.The non-local descriptor DOC describing the distance between oxidized cysteines was proposed to encode additional information for our input.For the dataset SP39,the pre-diction accuracy can be improved significantly with the combina-tion of local sequence profiles and the non-local descriptor DOC.The significant improvement on prediction accuracies against pre-vious approaches is because of the following reasons.First,SVMs can avoid over-fitting problems commonly seen in neural networks and other machine learning methods.Second,we explored the local environments of oxidized cysteines and found the optimum windowsize with best Q p values.Third,the non-local descriptor DOC log also contributes to the prediction accuracies.Our method achieved an accuracy of 63%in dataset SP39when DOC was used,which outperforms other previous approaches.Consistent improvements were also obtained on other datasets,detailed results can be found in the Supplementary data.These results imply that the formation of disulfide linkages between cysteines is determined not only by the local information of cysteines but also by the relationships between them.The descriptor DOC contains important information about the relationships between oxidized cysteines and is an effective feature for predicting disulfide connectivity accurately.This descriptor can be additionally applied to other problems where the knowledge of disulfide bridges is required.The web interface of our program is provided on the PreCys website.The results from our method may be useful for advanced studies in protein structure prediction,pro-tein structure modeling and protein engineering.ACKNOWLEDGEMENTSWe would like to thank Jianlin Cheng for generously sharing data-sets and useful comments and Shih-Chieh Chen for enlightening discussion.Funding to pay the Open Access publication charges for this article was provided by the Institute for Information Industry.Conflict of Interest:none declared.REFERENCESAltschul,S.F.et al.(1997)Gapped BLAST and PSI-BLAST:a new generation ofprotein database search programs.Nucleic Acids Res.,25,3389–3402.Bairoch,A.and Apweiler,R.(2000)The Swiss–Prot protein sequence database and itssupplement TrEMBL in 2000.Nucleic Acids Res.,28,45–48.Baldi,P.,Cheng,J.and Vullo,A.(2005)Large-scale prediction of disulphide bondconnectivity.In Saul,L.K.,Weiss,Y.and Bottou,L.(eds),Advances in Neural Information Processing Systems 17.MIT Press,Cambridge,MA,pp.97–104.Chang,C.-C.and Lin,C.-J.(2000)LIBSVM:introduction and benchmarks.TechnicalReport ,Department of Computer Science and Information Engineering,National Taiwan University,Taipei,Taiwan.Fariselli,P.and Casadio,R.(2001)Prediction of disulfide connectivity in proteins.Bioinformatics ,17,957–964.Fariselli,P.,Riccobelli,P.and Casadio,R.(2002)A neural network based methodfor predicting the disulfide connectivity in proteins.In Damiani,E.,Jain,L.C.,Howlett,R.J.and Ichalkaranje,N.(eds),Knowledge based intelligent information engineering systems and allied technologies (KES 2002).IOS Press,Amsterdam,1,pp.464–468.Ferre`,F.and Clote,P.(2005)Disulfide connectivity prediction using secondary struc-ture information and diresidue frequencies.Bioinformatics ,21,2336–2346.Gabow,H.N.(1973)Implementation of algorithms for maximum matching on non-bipartite graphs.Phd Thesis,Stanford University,CA.Harrison,P.M.and Sternberg,M.J.E.(1994)Analysis and classification of disulphideconnectivity in proteins.J.Mol.Biol.,244,448–463.Huang,E.S.et al.(1999)Ab initio fold prediction of small helical proteins usingdistance geometry and knowledge-based scoring functions.J.Mol.Biol.,290,267–281.Platt,J.(2000)Probabilistic outputs for support vector machines and comparisonto regularized likelihood methods.In Smola,A.J.,Bartlett,P.L.,Scho¨lkopf,B.and Schuurmans,D.(eds),Advances in Large Margin Classifiers .MIT Press,Cambridge,MA,pp.61–74.Rothberg,E.(1985)wmatch:a C Program to solve maximum weight matching.Vapnik,V.(1998)Statistical Learning Theory .Wiley,New York,NY.Vullo,A.and Frasconi,P.(2004)Disulfide connectivity prediction using recursiveneural networks and evolutionary information.Bioinformatics ,20,653–659.Wedemeyer,W.J.et al.(2000)Disulfide bonds and protein folding.Biochemistry ,39,4207–4216.Zhao,E.et al.(2005)Cysteine separations profiles on protein sequences infer disulfideconnectivity.Bioinformatics ,21,1415–1420.Fig.3.(a )The structure and the connectivity pattern of disulfide bridges and (b )the bonding potential P (i ,j )for each cysteine pair cys(i ,j )generated by SVM model for chymotrypsinogen A (PDB id 1HJA).Selected bonding pairs are boxed.Disulfide connectivity prediction4419。
BIOINFORMATICS ORIGINAL PAPER Vol.25no.172009,pages2236–2243doi:10.1093/bioinformatics/btp376 Systems biologyReconstruct modular phenotype-specific gene networks by knowledge-driven matrix factorizationXuerui Yang1,2,Yang Zhou3,Rong Jin3and Christina Chan1,2,3,∗1Department of Chemical Engineering and Materials Science,2Department of Biochemistry and Molecular Biology and3Department of Computer Science and Engineering,Michigan State University,East Lansing,MI48824,USA Received on March9,2009;revised on May19,2009;accepted on June9,2009Advance Access publication June19,2009Associate Editor:Trey IdekerABSTRACTMotivation:Reconstructing gene networks from microarray data has provided mechanistic information on cellular processes.A popular structure learning method,Bayesian network inference,has been used to determine network topology despite its shortcomings,i.e. the high-computational cost when analyzing a large number of genes and the inefficiency in exploiting prior knowledge,such as the co-regulation information of the genes.To address these limitations, we are introducing an alternative method,knowledge-driven matrix factorization(KMF)framework,to reconstruct phenotype-specific modular gene networks.Results:Considering the reconstruction of gene network as a matrix factorization problem,wefirst use the gene expression data to estimate a correlation matrix,and then factorize the correlation matrix to recover the gene modules and the interactions between them.Prior knowledge from Gene Ontology is integrated into the matrix factorization.We applied this KMF algorithm to hepatocellular carcinoma(HepG2)cells treated with free fatty acids(FFAs).By comparing the module networks for the different conditions,we identified the specific modules that are involved in conferring the cytotoxic phenotype induced by palmitate.Further analysis of the gene modules of the different conditions suggested individual genes that play important roles in palmitate-induced cytotoxicity. In summary,KMF can efficiently integrate gene expression data with prior knowledge,thereby providing a powerful method of reconstructing phenotype-specific gene networks and valuable insights into the mechanisms that govern the phenotype. Contact:krischan@Supplementary information:Supplementary data are available at Bioinformatics online.1INTRODUCTIONCellular activities are believed to be coordinately regulated by genes and proteins that function in complex networks.Disease states ensue upon abnormal regulation of cellular activities.Reconstructing the gene networks that give rise to the different phenotypes may provide insights into the cellular mechanisms involved(Said et al.,2004; Srivastava et al.,2007).Biological networks of protein–protein interaction(Han,2008),metabolic pathways(Ravasz et al.,2002) and transcriptional regulation(Ihmels et al.,2002)are modular in ∗To whom correspondence should be addressed.structure,enabling mutations to be isolated to specific modules without affecting the overall viability of the system(Jeong et al., 2000;Thieffry and Romero,1999;Yook et al.,2004).Since organized modularity is ubiquitous in biological systems,identifying the gene modules and their interplay in a modular network should help to provide insights into the differential mechanisms involved in normal versus disease states.Previously we identified that saturated free fatty acid(FFA), e.g.palmitate,induced cytotoxicity in liver cells,while unsaturated FFAs,e.g.oleate and linoleate,were not significantly cytotoxic(Li et al.,2007a,b;Srivastava and Chan,2007;Yang and Chan,2009). Palmitate-induced cytotoxicity of liver cells has been implicated in the pathogenesis of many obesity-related metabolic disorders, such as fatty liver disease,non-alcoholic steatohepatitis(NASH) and non-alcoholic fatty liver disease(NAFLD)(Farrell and Larter, 2006;Scheen and Luyckx,2002).Tumor necrosis factor(TNF)-α, a proinflammatory cytokine often is involved,along with elevated FFA,in these diseases(Bruce and Dyck,2004),and further potentiates the cytotoxicity induced by palmitate(Li et al.,2007b; Srivastava and Chan,2007;Srivastava et al.,2007).To study the multi-faceted effects of palmitate and provide insights into potential mechanism of saturated FFA-induced alterations,we obtained gene expression profiles of hepatocellular carcinoma(HepG2)cells upon exposure to different FFAs and TNF-α,and applied a module-based gene network reconstruction method that integrates prior knowledge and phenotypic information.The proposed methodology consists of two phases.Thefirst phase,the‘gene selection phase’,selects a subset of genes that are relevant to the phenotype,palmitate-induced cytotoxicity,using a mixture regression model.The second phase,the‘network reconstruction phase’,clusters the selected genes into modules,and reconstructs a module network based upon the interactions between the modules.Selecting the genes that are potentially relevant to the desired metabolic/phenotypic response of the cells can be viewed as a feature selection problem(Ressom et al.,2008;Saeys et al.,2007), which is extensively studied in machine learning(Bhaskar et al., 2006;Inza et al.,2004).Most feature selection methods,such as the Wilcoxon’s rank sum test(Troyanskaya et al.,2002)and Fisher’s Discriminant Analysis(FDR;Chan et al.,2003),are data driven,and thus susceptible to the noise level of the microarray data.One strategy to ameliorate this problem is to incorporate domain knowledge and functional information of the genes(Phillip et al.,2004).Typically these knowledge-based methods qualitatively2236©The Author2009.Published by Oxford University Press.All rights reserved.For Permissions,please email:journals.permissions@ at Tsinghua University on January 25, 2015 /Downloaded fromModular gene network reconstructionincorporate the prior knowledge in post-processing the genes that are selected by the data-driven approaches.In the present work,we address this limitation with a Bayesian mixture regression model that quantitatively incorporates the prior knowledge of the gene functions,upfront,in the gene-selection phase(see Supplementary Methods for details).By this process250genes are selected. Clustering methods,such as Self Organizing Map(Toronen et al.,1999;Yin et al.,2006),hierarchical clustering(Eisen et al., 1998)and K-means(Ma et al.,2005),commonly used to identify gene modules,cannot uncover the interactions among the modules or clusters.To address this limitation,several studies integrated clustering methods with structure learning algorithms,such as graphical Gaussian modeling and Bayesian network learning(Li and Chan,2004;Segal et al.,2003;Toh and Horimoto,2002).These approaches are predominantly data-driven and thus susceptible to noise in the expression data,and suffer from the sparse data problem associated with limited number of experimental conditions(Husmeier,2003;Yu et al.,2004).Previous studies recognized the importance of exploiting prior knowledge in reconstructing networks with sparse and noisy expression data(Bar-Joseph et al.,2003;Berman et al.,2002; Hartemink et al.,2002;Ideker et al.,2001;Ihmels et al.,2002; Li and Yang,2004;Pilpel et al.,2001).Similarly,we developed a framework based on knowledge-driven matrix factorization, termed KMF,to exploit the domain knowledge and reconstruct modular gene networks.This framework views the gene network reconstruction as a matrix factorization problem.In brief,the pairwise correlation coefficients between any two genes are computed from their expression data and used to construct a correlation matrix.This correlation matrix is decomposed into a product of three matrices,from which the gene modules and module interaction information are extracted.During this process, the Gene Ontology(GO)information is introduced as regularization in matrix factorization,which affects the decomposed matrices and eventually the derived gene modules and interaction among pared with the existing approaches for gene network reconstruction,the key features of the proposed KMF framework are:(i)derives both the gene modules and their interactions from a combination of expression data and GO information;(ii) incorporates the prior knowledge of co-regulation relationships into the network reconstruction using a regularization scheme;and (iii)presents an efficient learning algorithm based on non-negative matrix factorization and semi-definite programming.Finally,although a number of algorithms have been developed for matrix factorization(Ding and He,2005;Lee and Seung,1999),this study distinguishes from the prior studies in that it incorporates the prior knowledge of the gene functions into the matrix factorization. In addition,unlike most matrix factorization methods that only identify gene clusters,the current framework derives both the gene modules and their interactions simultaneously.2METHODSKMF is a technique based on matrix factorization.Itfirst computes pairwise correlation between two genes based on their expression levels across different experimental conditions.The matrix of pairwise gene correlation, denoted by W,is approximated by the product of three matrices,M×C×M.A gene modular network,including gene modules and their interaction,is derived from the decomposed matrices M and C.We denote the gene expression data by X=(x1,x2,...,x n)where n isthe number of genes,and each x i=(x i,1,x i,2,...,x i,m)∈R m is the expressionlevels of the i-th gene measured under m conditions.We can compute thepairwise correlation between any two genes using statistical correlationmetrics such as Pearson correlation,mutual information andχ2-statistics.In our experiment,we use RBF kernel function.This computation resultsin a symmetric matrix W=[w i,j]n×n where w i,j measures the correlationbetween gene x i and x j.This estimated correlation matrix W providesvaluable information about the structure of the gene network since a high correlation w i,j between two genes x i and x j could suggest that:(i)genes x iand x j belong to the same module,or(ii)gene x i regulates the expressionlevels of gene x j or vice versa.To derive these two types of interactions simultaneously,we follow the framework of weighted non-negative matrix factorization(WNMF)of Ding and He(2005)and factorize W as follows:W≈M×C×Mwhere M is a matrix of size n×r and C is a matrix of size r×r,wherer n is the number of modules that can be determined empirically as wewill discuss later.Matrix M=[m i,j]n×r represents the memberships of the ngenes in r modules where m i,j≥0indicates the confidence of assigning thei-th gene to the j-th module.Matrix C=[c i,j]r×r represents the relationshipsamong r modules where c i,j≥0indicates the confidence of the two genemodules to interact(regulate)with each other.Note that in this study,wefocus on the undirected network since the gene module regulation matrix Cis symmetric.To determine the appropriate factorization of matrix W,wefirst define aloss function l d(W,MCM )that measures the difference between W and the factorized matrices M and C as follows:l d(W,MCM T)=||W−MCM ||2F=ni,j=1(W i,j−[MCM T]i,j)2Second,we regularize the solution of M using the prior knowledge from GO information.We encode the information within GO by a similarity matrix S,where S i,j≥0represents the similarity between two genes in their biological functions.The discussion of gene similarity by GO can be found in Jin et al. (2006).To ensure the modules to be consistent with the prior knowledgewithin the GO,we introduce another loss function l m(M,S)that measuresthe inconsistency between M and S as follows:l m(M,S)=rk=1m k L(S)m k=tr(M L(S)M)where m k is the k-th column of M matrix.L(S)is the combinatorial Laplacianof matrix S.The definition of combinatorial Laplacian and its application to regularize numerical solutions can be found in Chung(1997).Furthermore,we regularize the solution for C by the regularizer l c(C)=||C||2F.Regularizer,as already shown in statistical machine learningtheory(Scholkopf and Smola,2001),is important for improving the stabilityof solutions as well as the generalization error of statistical models.This regularizer enforces sparse regulation among the gene modules,and as pointout in Andrade et al.(2005),will result in a scale-free structure of the genemodule network.By combining the above factors together,we obtain thefollowing optimization problem:argminM∈R n×r,C∈R r×rl d(W,Z)+αl m(M,S)+βl c(C)s.t.C 0,C i,i=1,i=1,2,...,n,C i,j≥0,i,j=1,2,...,rM i,j≥0,i,j=1,2,...,n,Z=MCMWe solve the above optimization problem through alternating optimization.It alters the process of optimizing M withfixed C and theprocess of optimizing C withfixed M iteratively till the solution convergesto the local optimum(see Supplementary Methods).Furthermore,the key2237at Tsinghua University on January 25, 2015/Downloaded fromX.Yang et al.parameters that determine the outcome of the algorithm,i.e.α,βand the number of modules,are tuned automatically.In particular,bothαandβare determined by a supervised learning method;the number of modules is decided by a stability analysis.Further details can be found in the Supplementary Methods.The KMF algorithm was applied to toxic and non-toxic conditions, separately.It was also applied to the combination of both conditions.We denoted by C t and C n the interaction matrices of toxic and non-toxic conditions,respectively,and by C all the interaction matrix derived from all the conditions.In order to ensure that matrices C t and C n are comparable,we align C t and C n with C all.The alignment is achieved by linearly transforming C t(and C n)to minimize|C t−C all|2F(and|C n−C all|2F).Finally,we emphasize that although this framework follows the work of WNMF,it is different from WNMF in that it incorporates the prior knowledge of the gene functions by introducing regularizer l m(S,M),which not only results in a different objective function to be optimized but also a different method of optimization.3RESULTS AND DISCUSSIONWe applied the proposed KMF framework to HepG2cells cultured in different FFAs,with or without TNF-αfor24h(see Supplementary Methods for details).To reconstruct the network,250genes selected in the gene selection phase(see Supplementary Methods)were used. Prior knowledge can be incorporated to help reconstruct networks with sparse and noisy expression data(Bar-Joseph et al.,2003; Berman et al.,2002;Hartemink et al.,2002;Ideker et al.,2001; Ihmels et al.,2002;Li and Yang,2004;Pilpel et al.,2001).Typically, the prior knowledge of the gene interaction is encoded in a Bayesian prior,in which a high probability is given for each gene relationship derived from prior knowledge.By incorporating a Bayesian prior, Bayesian network(BN)analysis penalizes any gene relationship (i.e.gives a low score)when it violates the prior knowledge of the gene relationships,thus improving both the accuracy and efficiency of BN analysis.In this study,the prior knowledge of the genes is taken from the GO database.Although GO information does not directly reveal the gene relationships,nevertheless it does provide co-regulation relationships and functional information of the genes, both of which are still potentially useful for reconstructing gene networks.Unlike existing methods that apply the GO information to generate predefined sets of genes based on supervised feature selection(Subramanian et al.,2005),our KMF algorithm applies an alternative unsupervised feature selection,which allows us to identify the feature genes when the classification of the experimental conditions is unknown.In addition,KMF tunes the impact of the GO information on the model selection to obtain optimal results(see Section2).This is in contrast to the other methods where the GO information takes precedence over the subsequent analysis(Srivastava et al.,2008).The KMF algorithm yields two matrices,M and C.M is the module matrix.Each element M i,j in matrix M represents the confidence of assigning the i-th gene to the j-th module.We can derive the member genes for each module by assigning each gene i to the module j∗with the highest weight,i.e.j∗=argmax1≤j≤m M i,j. These member genes will furthermore allow us to infer the overall biological functions of each module.C is the network structure matrix that indicates the connectivity between gene modules.In particular,each element C i,j in matrix C represents the strength of the interaction between modules i and j.The interaction information revealed by the C matrix may shed light onto how biological Table1.Gene modules identified by KMFModule Function1Lipid metabolism and lipid processing.2Signaling proteins,intracellular and membraneprotein-mediated:GPCR signaling,chemokine/TNF-αreceptor signaling and ion channel-related signaling.3Glucose metabolism:glycolysis and pentose phosphatepathway.4Post-translational modification:ubiquitin-proteasomepathway,protein folding,transportation,phosphorylation. 5Reactive oxygen species(ROS)homeostasis,redox systemregulation and the TCA cycle.6Energy:ATP and GTP metabolism.7Protein synthesis:translation initiation and transcription.8Amino acid metabolism and urea cycle.9Apoptosis:executors and regulators.information is processed and passed between different cellular activities.Furthermore,comparing the C matrices for the different conditions suggests structural changes in the module network in response to the toxic conditions,and these changes may confer the cytotoxic phenotype.3.1Application of KMF to identify gene modules andthe interactions between the modulesNine gene modules are identified by the proposed.We observe that the identified modules are highly enriched with genes involved in specific cellular functions or activities(Table1).A full list of the genes in each module is available online at /groups/chan/GO_KMF_genecluster.xls. Next,KMF identified the interactions between the modules,namely the connections between different cellular functions,in the form of the C matrix(Table2),and thereby recovered a module network (Fig.1).The bottom row(‘sum’)of Table2sums the correlation coefficients(C i,j)between a module with the other eight modules, thereby capturing an overall snapshot of the module connections.A higher‘sum’value indicates that the module is more highly correlated with the other modules and thereby takes a more central position in the overall gene module network.A map of the module network is provided in Figure1,where the strengths of the interactions between the gene modules are indicated by both darkness and thickness of the edges.From the C matrix(Table2)and the module interaction network (Fig.1),module6(ATP and GTP metabolism)has the highest‘sum’value among the nine modules,and is presented as the largest node in the module interaction map.Indeed,as the molecular currency of intracellular energy transfer,ATP(as well as GTP)is either produced or consumed by most cellular activities,e.g.metabolism (catabolism and anabolism)and signaling pathways.Module6has the highest interaction values with modules3,5and8in the C matrix,reflecting that glucose metabolism(module3)and TCA cycle(module5)are the major metabolic pathways that produce ATP,the electron transport chain(ETC)(module5)produces the proton gradient across the mitochondria membrane to provide the driving force for ATP production(Lehninger et al.,2005),and amino acid metabolism(module8)is highly dependent on the ATP2238 at Tsinghua University on January 25, 2015 /Downloaded fromModular gene network reconstructionTable 2.C matrix of the modules Module 12345678910.1520.2340.1950.1910.2750.1010.2360.17620.1520.1770.1550.1520.2140.0920.1830.14030.2340.1770.2360.2150.3050.1070.2840.20940.1950.1550.2360.2040.2950.1200.2490.18850.1910.1520.2150.2040.3020.1220.2530.18660.2750.2140.3050.2950.3020.1700.3600.26770.1010.0920.1070.1200.1220.1700.1380.10880.2360.1830.2840.2490.2530.3600.1380.22790.1760.1400.2090.1880.1860.2670.1080.227Sum 1.560 1.265 1.767 1.642 1.625 2.1880.958 1.930 1.501Elements in rows 1–9represent the interaction strength between modules.The bottom row (sum)is the summation of eachcolumn.Fig.1.Gene module interaction network.Interactions among the nine gene modules are visualized according to the C matrix.The nodes represent modules and the edges indicating the strength of the interaction between modules.A higher C i ,j value in the C matrix,suggesting stronger interaction,is indicated by a thicker and darker edge line,whereas a higher ‘sum’valuein the C matrix,suggesting more relevant module,is indicated by a larger and darker node.levels.Therefore,from the example of module 6,KMF recovered a high connectivity between ATP (and GTP)synthesis and the major cellular activities that are known to be related to energy production and consumption.3.2Application of KMF to identify the interactions involved in palmitate-induced cytotoxicity KMF,if applied to the different conditions separately,yields different C matrices specifically for the toxic (saturated FFAs and TNF-α,see Supplementary Table 1)and non-toxic (control,unsaturated FFAs and TNF-α,see Supplementary Table 2)conditions.This is in contrast to the average C matrix obtained using all the conditions discussed above (Table 2).Similarly,these condition-specific C matrices indicate module networks composed of interactions between cellular activities for their corresponding condition.The C matrix in the toxic conditions differs significantly from the non-toxic conditions,suggesting that the interactions between the gene modules in the toxic (saturated FFAs and TNF-α)case are altered significantly,and these changes potentially may help to explain the phenotype,palmitate-induced cytotoxicity.To quantitatively assess these changes,we subtracted the C matrix for the non-toxic conditions from the C matrix for the toxicconditions,and obtained a matrix we denoted as the ‘difference C matrix’(Table 3).This matrix indicates the differences in theinteractions between the gene modules for the toxic versus the non-toxic conditions.Positive values indicate stronger interactions between the modules under the toxic than the non-toxic conditions,and vice versa.The summation of each column in the difference C matrix (the row denoted as ‘sum’in Table 3)indicates the difference between the toxic and the non-toxic conditions in the interactions of a module with the other modules.As shown in the difference C matrix (Table 3),modules 2,3,4and 5are more highly connected to the other modules,while modules 6and 9are less connected to the other modules in the toxic than in the non-toxicconditions.Since modules 4and 6have the largest positive andnegative ‘sum’values,0.144and −0.294,respectively,we focused on these two modules in the discussion of their potential involvementin palmitate-induced cytotoxicity (Supplementary Discussion).Inbrief,the ubiquitin-proteasome pathway and post-translationalmodifications (folding/unfolding,transportation and degradation)of proteins,module 4,was identified to be important in saturatedFFA-induced cytotoxicity,which is supported by the literature (Dinget al.,2007;Guo et al.,2007;Lai et al.,2008;Zhang et al.,2006).In contrast,module 6,ATP metabolism,was suggested to be lesscorrelated with the other cellular processes in the toxic than non-toxic conditions.Indeed long-term exposure of saturated FFAs canactivate uncoupling proteins (UCP)(Lameloise et al.,2001),whichuncouple mitochondrial oxidative phosphorylation and produce heatinstead of ATP (Breen et al.,2006).As a result,with this additionalregulation through UCPs,the level of ATP should be less connectedwith the cellular activities in the toxic than the non-toxic conditions.The proposed KMF algorithm identified the gene modules and their interactions,as well as how they change in the toxic versus non-toxic conditions.The results suggested that post-translational modification and uncoupling proteins (UCP)play important roles in mediating the palmitate/TNF-αinduced cellular responses,therebyshedding light on potential mechanisms involved in palmitate-induced cytotoxicity.Thus far,this methodology has focused onthe module network.To further uncover the specific genes that may be responsible for the palmitate-induced cytotoxicity,we performed further analysis to assess the contribution of each gene in the two gene modules that were deemed important.3.3Identifying potential genes responsible forpalmitate-induced cytotoxicityAs described above,the values in the M matrix (M i ,j )indicate the strength or contribution of gene i to module j .The rank of the genes in a module by their M i ,j values provides a relative index of the importance of a gene to the cellular function that corresponds to that module.Under different conditions,the modules remained relatively stable with respect to their size and gene members,however,the rank of certain genes changed significantly in some of the modules.The importance or the weights of these genes in their corresponding modules varied across the different conditions,suggesting that these genes may play important roles in conferring a phenotype.Given the importance of modules 4(post-translational modification of proteins)and 6(ATP and GTP metabolism),we ranked the genes in these two modules according to their M i ,j values in the toxic conditions.The top 10out of 33genes in2239 at Tsinghua University on January 25, 2015/Downloaded fromX.Yang et al.Table3.Difference C matrix.Obtained by subtracting the C matrix of the non-toxic conditions(Supplementary Table2)from the C matrix of the toxic conditions(Supplementary Table1)Module123456789 10.0060.0160.0230.008−0.050−0.0160.006−0.007 20.0060.0370.0310.017−0.017−0.0070.023−0.002 30.0160.0370.0380.039−0.053−0.0010.0100.011 40.0230.0310.0380.034−0.0240.0070.0270.008 50.0080.0170.0390.034−0.0210.0110.015−0.005 6−0.050−0.017−0.053−0.024−0.021−0.010−0.062−0.057 7−0.016−0.007−0.0010.0070.011−0.0100.003−0.027 80.0060.0230.0100.0270.015−0.0620.003−0.010 9−0.007−0.0020.0110.008−0.005−0.057−0.027−0.010Sum−0.0140.0880.0970.1440.098−0.294−0.0400.012−0.089 The largest positive(0.144)and negative(−0.294)sum values are marked in bold.Table4.Top10out of33genes in module4ranked according to their contributions to the module under toxic conditionsRankToxic Non-toxic Difference Gene143LCMT253MAP3K12 330PRSS242−2ST13 52520HSP105B 660APOC1 73023RABGGTA 8146UVRAG97−2DPM2 102313MAPKAPK3 The ranking difference was calculated by subtracting the ranking number of the specific gene under toxic conditions from non-toxic conditions.Positive ranking differences indicate bigger ranking numbers and less contribution in non-toxic conditions.The two genes with the highest Difference ranks are highlighted in grey.module4and all the genes in module6are listed in Table4and Supplementary Table3,respectively.The ranking numbers of these genes in the toxic and non-toxic conditions are listed,as is the difference in the rankings of the genes between these conditions (Table4and Supplementary Table3).In module4,the positions of two genes,Rab geranylgeranyltrans-ferase(RABGGTA)and heat shock105kDa(HSP105B)changed significantly in the toxic conditions,as indicated by high positive differences in the ranking,23and20,respectively,suggesting that these two genes may be more involved in the toxic than non-toxic conditions and thereby play a role in conferring the toxic phenotype. RABGGT catalyzes the transfer of a geranyl–geranyl moiety from geranyl–geranyl pyrophosphate to Rab proteins(GTPases)such as RAB1A,RAB3A and RAB5A(Leung et al.,2006).As a member of the Ras superfamily of monomeric G proteins,Rab proteins regulate membrane traffic,which facilitates the trafficking of cell membrane proteins from the Golgi apparatus to the plasma membrane and the recycling of the membrane proteins(Seabra et al., 2002;Stenmark and Olkkonen,2001).RABGGT,by facilitating the prenylation of Rab proteins(Leung et al.,2006),ensures that the Rab proteins are insoluble and correctly anchored in the membrane. The response of RABGGT to saturated FFAs and its potential role,if any,in the saturated FFA-induced cytotoxicity has never been studied.The mRNA level of RABGGT is not affected by oleate and increased by palmitate albeit insignificantly(Fig.2a, see Supplementary Methods for the details of the experiments). However,further analysis by silencing the gene expression level of RABGGT revealed a very interesting feature of RABGGT in regulating cytotoxicity(Fig.2b).In the non-toxic conditions, i.e.BSA(vehicle of the FFAs)or oleate,the LDH release was increased by the siRNA of RABGGT(Fig.2b),suggesting that RABGGT may help to maintain normal healthy cellular activities under physiological and non-toxic conditions.Indeed,membrane traffic pathways,regulated by RABGGT through Rab GTPases,are important in maintaining normal vesicle formation and movement and membrane protein trafficking and recycling.In contrast,in the toxic condition,i.e.palmitate,the LDH release was decreased by the siRNA of RABGGT(Fig.2b),suggesting that RABGGT may be involved in mediating the cytotoxic effect of palmitate.The potential mechanism of the distinct roles of RABGGT under the different conditions is unclear at this point.Given that RABGGT catalyzes the prenylation and therefore the activation of Rab GTPases, we hypothesize that the toxic conditions(i.e.palmitate)induce disordered trafficking and recycling of the membrane proteins and disrupt the membrane integrity,through RABGGT and Rab proteins, thereby enhancing the cytotoxicity.As discussed in the Supplementary Discussion,as an important chaperone protein involved in processing denatured proteins under stress conditions(Yamagishi et al.,2000,2003),HSP105B may also be involved in the cellular responses induced by the toxic conditions, potentially by regulating the post-translational modifications,such as denaturation,folding/unfolding,transportation and degradation. Indeed,we found that both the mRNA(Supplementary Fig.1A) and protein(Supplementary Fig.1B)expression levels of HSP105B were significantly increased by palmitate but not by oleate, suggesting that this gene potentially plays a role in the cytotoxicity induced by saturated FFA.HSP105B usually exists as a complex associated with Hsp70and Hsc70(a constitutive member of the HSP70family)in mammalian cells and functions as a negative regulator of Hsp70/Hsc70by suppressing the Hsp70/Hsc70 chaperone activity(Yamagishi et al.,2000).More detailed2240 at Tsinghua University on January 25, 2015 /Downloaded from。
BIOINFORMATICS APPLICATIONS NOTE Vol.21no.162005,pages3450–3451doi:10.1093/bioinformatics/bti528 Data and text miningMineBlast:a literature presentation service supporting protein annotation by data mining of BLAST resultsGuido Dieterich∗,Uwe Kärst,Jürgen Wehland and Lothar JänschDivision of Cell Biology,German Research Centre for Biotechnology(GBF),Mascheroder Weg1,D-38124Braunschweig,GermanyReceived on April5,2005;revised on June3,2005;accepted on June5,2005Advance Access publication June7,2005ABSTRACTSummary:MineBlast is a web service for literature search and presentation based on data-mining results received from UniProt. Users can submit a simple list of protein sequences via a web-based interface.MineBlast performs a BLASTP search in UniProt to identify names and synonyms based on homologous proteins and subsequently queries PubMed,using combined search terms in order tofind and present relevant literature.Availability:http://leger2.gbf.de/cgi-bin/MineBlast.plContact:gdi@gbf.de1INTRODUCTIONComparative genome analyses are an essential part of the process of assigning functions to open reading frames.But even in Escherichia coli,arguably the best studied of all prokaryotic organisms,only 70%of the genes have known functions.To overcome this limita-tion,functional studies are carried out continuously in many different organisms characterizing so far unknown gene functions or providing additional functional insights that subsequently are archived primar-ily in literature databases,and later in sequence databases such as UniProt(Bairoch et al.,2005).Since comparative genome analyses are mainly based on sequence homology evaluated by tools such as BLAST(Altschul et al.,1997),genome annotations of previ-ouslyfinished genome projects may quickly become outdated.Apart from information stored in UniProt,most recent information on a gene usually exists in the biomedical literature covered by PubMed (Putnam,1998).To retrieve functional annotations and to assure the complete-ness of literature relevant to a list of genes,we implemented a two-step query in MineBlast to search for PubMed abstracts.In thefirst step,we perform a BLASTP query against UniProtfind-ing homologous proteins and extracting gene names and synonyms, because global gene names overlap between different species,as well as literature references within entries.In the second step we query PubMed with a combined term of gene names and syn-onyms,and process found literature references in order to transform the data into a clearly laid out presentation that aids individual researchers in the manual and cost intensive process of literature evaluation.To whom correspondence should be addressed.2IMPLEMENTATION AND FEATURESMineBlast is accessed by entering FASTA-formatted protein sequences and setting optional parameters(e.g.published year over a specific period,BLAST E-value cut-off or additional search terms).A Perl script using BioPerl modules(Stajich et al.,2002)will pro-cess the query,and the user will receive an Email that the job is finished.The script performs a BLASTP search against UniProt with an E-value or bit score minimum cut-off.UniProt entries of all homologous genes are parsed to extract annotations,gene names and synonyms.Biomedical literature references as mentioned in the entry are retrieved with the help of the efetch utility from the NCBI.Gene names and synonyms are used to perform a keyword-based query using the PubMed interface to MEDLINE.The resultingfile representation is enhanced by the use of popup information boxes.These boxes contain additional information extracted from the annotations of the corresponding UniProt entry. MineBlast also provides direct links to query InterPro(Mulder et al., 2005),STRING(von Mering et al.,2005)and to access the BLAST resultfile for the query sequence.Finally,MineBlast recognizes interaction types by12terms and putative gene names in the abstract.Genes names and synonyms are extracted initially from all UniProt entries.3RESULTSWe tested MineBlast with74selected protein sequences that were originally annotated without functional assignment and are supposed to be involved in virulence of Listeria monocytogenes EGD-e,a human pathogen(Glaser et al.,2001).The MineBlast report reveals for50%(37proteins)of all subjec-ted sequences additional functional information that can be extracted from UniProt and PubMed.For22proteins,a highly reliable func-tional annotation was retrieved from homologues and should be taken into account for the planned reannotation of the listerial genomes. Infive of these cases,precise gene names can now be added to the corresponding database entries.Whereas information about the subcellular localization and func-tionally relevant domains was mainly obtained directly from UniProt (MineBlast,Step1),the PubMed search—considering automat-ically extracted synonyms and names—revealed that eight homo-logues were already the subject of individual studies and are3450©The Author2005.Published by Oxford University Press.All rights reserved.For Permissions,please email:journals.permissions@MineBlast:a literature presentation servicecited either in the title or in the abstract of the found literat-ure(MineBlast,Step2).The result table can be found under http://leger2.gbf.de/Table1_MineBlast.html4DISCUSSION AND CONCLUSIONWe have used BLAST tofind entries in UniProt related by sequence similarity.The retrieved gene names and synonyms allow a broad query in PubMed,extracting the most recent state of biological information.We have demonstrated with a sample analysis that MineBlast provides some highly valuable information.Additional assigned functions that were found by MineBlast have to be considered in new and ongoing projects of L.monocytogenes,a model organism for infection research.Different approaches exist to address the problem of text min-ing in biology.The major interest of these existing systems is the identification of relevant biological entities(genes,proteins,etc.) in text thus enabling both the extraction of relationships between entities and pathway discovery from the literature(Becker et al., 2003;Jenssen et al.,2001;Mika and Rost,2004;Perez-Iratxeta et al., 2003;Tanabe et al.,1999).MineBlast presents information that sup-ports the functional annotation of genes,a further step towards the automation of the total process and the standardization of genome projects and furthermore can assist in the generation of experimental designs.Specifying an Entrez Date ranging over afixed period provides the possibility to search only for the newest literature in PubMed. The restriction of a query to a specific genus often also improves the accuracy.To cite an example:the query of‘fmtc’as a gene name in the Staphylococcus genus(query term:‘fmtc AND staphylococcus’)in PubMed prevents thefinding of‘fmtc’as an abbreviation for‘familial medullary thyroid carcinoma’.Since MineBlast includes data from UniProt as well as from PubMed it can also help to shorten the delay between thefirst evid-ence of a protein function that is published in the literature and its assignment to homologous proteins from other organisms.This is of highest interest for both researchers continuously involved in genome annotation and those who have to maintain the actuality of knowledgebases.Moreover,the functionality of MineBlast also supports the fast and reliable interpretation of results from proteome and transcriptome studies which very often suffer from incomplete or‘hidden’functional descriptions. ACKNOWLEDGEMENTSWe are very grateful to Victor Wray for critical proof-reading of the manuscript.This work was funded by the German Bundesmin-isterium für Bildung und Forschung(BMBF)‘Verbundvorhaben: Intergenomics–Bioinformatische Modellierung der Wechselwirkung von Genomen’(031U110A/031U210A).Conflict of Interest:none declared.REFERENCESAltschul,S.F.et al.(1997)Gapped BLAST and PSI-BLAST:a new generation of protein database search programs.Nucleic Acids Res.,25,3389–3402.Bairoch,A.et al.(2005)The Universal Protein Resource(UniProt).Nucleic Acids Res., 33(Database issue),D154–D159.Becker,K.G.et al.(2003)PubMatrix:a tool for multiplex literature mining.BMC Bioinformatics,4,61.Glaser,P.et al.(2001)Comparative genomics of Listeria species.Science,294,849–852. Jenssen,T.K.et al.(2001)A literature network of human genes for high-throughput analysis of gene expression.Nat.Genet.,28,21–28.Mika,S.and Rost,B.(2004)NLProt:extracting protein names and sequences from papers.Nucleic Acids Res.,32,W634–W637.Mulder,N.J.et al.(2005)InterPro,progress and status in2005.Nucleic Acids Res.,33 (Database issue),D201–D205.Perez-Iratxeta,C.et al.(2003)Update on XplorMed:a web server for exploring scientific literature.Nucleic Acids Res.,31,3866–3868.Putnam,N.C.(1998)Searching MEDLINE free on the Internet using the National Library of Medicine’s PubMed.Clin.Excell.Nurse Pract.,2,314–316.Stajich,J.E.et al.(2002)The Bioperl toolkit:Perl modules for the life sciences.Genome Res.,12,1611–1618.Tanabe,L.et al.(1999)MedMiner:an Internet text-mining tool for biomedical information,with application to gene expression profiling.Biotechniques,27, 1210–1217.von Mering,C.et al.(2005)STRING:known and predicted protein–protein associations, integrated and transferred across organisms.Nucleic Acids Res.,33(Database issue), D433–D437.3451。
BIOINFORMATICS APPLICATIONS NOTE Vol.28no.72012,pages1048–1049doi:10.1093/bioinformatics/bts069 Systems biology Advance Access publication February4,2012 IDEOM:an Excel interface for analysis of LC–MS-based metabolomics dataDarren J.Creek1,2,Andris Jankevics3,4,Karl E.V.Burgess1,Rainer Breitling3,4and Michael P.Barrett1,∗1Institute of Infection,Immunity and Inflammation,Wellcome Trust Centre for Molecular Parasitology,College of Medical,Veterinary and Life Sciences,University of Glasgow,Glasgow G128TA,UK,2Department of Biochemistry and Molecular Biology,University of Melbourne,Parkville,Victoria3010,Australia,3Institute of Molecular,Cell and Systems Biology,College of Medical,Veterinary and Life Sciences,University of Glasgow,Glasgow,G128QQ,UK and4Groningen Bioinformatics Centre,Groningen Biomolecular Sciences and Biotechnology Institute,University of Groningen,9700CC Groningen,The NetherlandsAssociate Editor:Jonathan WrenABSTRACTSummary:The application of emerging metabolomics technologies to the comprehensive investigation of cellular biochemistry has been limited by bottlenecks in data processing,particularly noisefiltering and metabolite identification.IDEOM provides a user-friendly data processing application that automatesfiltering and identification of metabolite peaks,paying particular attention to common sources of noise and false identifications generated by liquid chromatography–mass spectrometry(LC–MS)platforms.Building on advanced processing tools such as mzMatch and XCMS,it allows users to run a comprehensive pipeline for data analysis and visualization from a graphical user interface within Microsoft Excel,a familiar program for most biological scientists.Availability and implementation:IDEOM is provided free of charge at /ideom.html,as a macro-enabled spreadsheet(.xlsb).Implementation requires Microsoft Excel(2007 or later).R is also required for full functionality.Contact:michael.barrett@Supplementary Information:Supplementary data are available at Bioinformatics online.Received on December1,2011;revised on January9,2012; accepted on January31,20121INTRODUCTIONMetabolomics aims to measure all small molecules(metabolites) in a biological system.However,challenges associated with data analysis,in particular the accurate identification of metabolites (Moco et al.,2007;Neumann and Böcker,2010)have restricted progress.Recent advances in high resolution mass spectrometry(MS) provide accurate mass detection that significantly improves metabolite identification from liquid chromatography–MS(LC–MS) (Breitling et al.,2006;Moco et al.,2007)although limitations still abound(Kind and Fiehn,2010;Neumann and Böcker,2010),and noise or artifact peaks are often incorrectly identified as metabolites (Scheltema et al.,2009).∗To whom correspondence should be addressed.Applications are freely available for detection,quantification and alignment of signals in LC–MS data(Blekherman et al.,2011), and numerous multivariate statistical methods have been proposed to extract significant features from these high-dimensional datasets (Madsen et al.,2010).However,many of the most powerful tools are implemented in statistical software,and while the graphical user interface(GUI)in MZmine(Pluskal et al.,2010)simplifies data pre-processing,recent advances in noisefiltering and identification algorithms(Brown et al.,2011;Scheltema et al.,2011)are difficult to use without special training.IDEOM is a Microsoft Excel template with a collection of VBA macros that enable automated data processing of high resolution LC–MS data from untargeted metabolomics studies,with a particular focus on removal of noise[which accounts for∼80%of peaks in typical LC–MS metabolomics datasets(Jankevics et al.,2012)], metabolite identification and data visualization.Its GUI allows users to exploit the power of data-processing methods such as mzMatch (Scheltema et al.,2011)and XCMS(Smith et al.,2006)from within Excel,and enables rapid and simple conversion of raw or pre-processed LC–MS data into afiltered,interpretable list of putative metabolites,with associated confidence levels and sample intensities.2METHODSOpening the IDEOM template in Excel provides a spreadsheet on which to specify the parameters for data processing(default values are provided).All IDEOM macros for data processing are then activated by buttons or in-cell hyperlinks,and pop-up dialog boxes are used to specify important parameters for individual processing steps.Raw LC–MS datafiles(.mzXML)are processed by IDEOM using the freely available XCMS(Smith et al.,2006)and mzmatch.R tools (/index.php)(Scheltema et al.,2011),by automatic generation and execution of scripts in the R environment ()(R,2008)using readily adjustable parameters.Raw peaks are extracted by XCMS,and mzMatch applies peak matching,noise filtering,gap-filling and annotation of related peaks.Pre-processed peak lists from mzMatch or MZmine can be directly imported into IDEOM as text or csvfiles.During data import,any number of samples can be assigned to(up to30)study groups(e.g.blanks,controls and QCs)to improve datafiltering,analysis and visualization.Sample consistency,according1048©The Author2012.Published by Oxford University Press.All rights reserved.For Permissions,please email:journals.permissions@ at Wuhan University Library on April 6, 2012 /Downloaded fromIDEOMto average peak height and internal standards(optional),is automatically checked and normalization can be applied.Noisefiltering within IDEOM removes common sources of noise in high resolution LC–MS data:chromatographic peak shoulders,irreproducible peaks,background or contaminant signals,and fourier transform(FT) and electrospray ionisation(ESI)artifacts including isotopes,adducts and fragments(based on Brown et al.,2011and Scheltema et al.,2011),as described in the documentation(Supplementary Material).Metabolite identification is achieved by matching the accurate mass and retention time of observed peaks to metabolites in the included database, which incorporates all likely metabolites from a wide range of biological databases,and can be updated by users for specific applications.Retention times for authentic standards,and a retention time prediction model, are included for ZIC-HILIC chromatography data(Creek et al.,2011); however,as retention times are instrument specific,users are encouraged to upload standard retention times from their own platform with the macro provided.Subsequent to initial metabolite identification,a data-dependent polynomial mass recalibration step can be applied to correct for mass-dependent calibration errors.Thefinal lists of identified,and rejected,peaks are annotated with confidence scores regarding the identification of each metabolite,based on retention times,organism-specific(or user-defined) databases and annotation as possible‘related peaks’(Scheltema et al.,2009). Univariate statistics(mean,relative intensity,SD,t-test and Fisher ratio)are calculated in Excel.Multivariate statistics are obtained by calls to the R environment.3RESULTSThe automated pre-processing steps in IDEOM drastically reduce the need for manual curation of LC–MS data by applyingfilters to remove hundreds of false-identifications(Creek et al.,2011). The example tutorial dataset(Supplementary Material)demonstrates putative identification of1314metabolites and rejection of1942 false-identifications from serum samples.The putatively identified metabolites are displayed in an interactive table that includes metabolite information,sample intensities,comparative statistics, LC–MS data,and links to websites and graphs(Fig.1).Putative identifications can be rapidly scrutinized by double-click access to LC–MS metadata,or adjusted by selecting alternative isomers from dropdown lists.Data visualization is enhanced by Excel’s conditional formatting,filtering and sorting,allowing users toview Fig. 1.Screenshot of results visualization showing the dropdown list selection of isomers and some of the automatically generated hyperlinked charts.results according to sample intensities,significance,pathways orother properties.Additional IDEOM tools include:merging dual-polarity data, chemical formula determination for unidentified masses,stableisotope tracking and targeted analysis.Full documentation,tutorials,source code and the IDEOM template are freely available at/ideom.html.IDEOM provides a user-friendly interface for analysis of complex metabolomics datasets without the need for specialist bioinformaticsskills,allowing for the rapid production of meaningful,interactiveresults for biological interpretation of untargeted metabolomics datasets.ACKNOWLEDGEMENTSThe authors thank Gavin Blackburn,Isabel Vincent and Anubhav Srivastava for testing and feedback.Example datasets were providedby the Scottish Metabolomics Facility,funded by the Scottish Universities Life Sciences Alliance(SULSA).Funding:Australian National Health and Medical Research Council postdoctoral training fellowship.Funding for AJ was provided by an Netherlands Organisation for Scientific Research NWO-VIDI grantto RB.Conflict of Interest:none declared.REFERENCESBlekherman,G.et al.(2011)Bioinformatics tools for cancer metabolomics.Metabolomics,7,329–343.Breitling,R.et al.(2006)Precision mapping of the metabolome.Trends Biotech.,24, 543–548.Brown,M.et al.(2011)Automated workflows for accurate mass-based putative metabolite identification in LC/MS-derived metabolomic datasets.Bioinformatics,27,1108–1112.Creek,D.J.et al.(2011)Towards global metabolomics analysis with Liquid Chromatography-Mass Spectrometry:improved metabolite identification byretention time prediction.Anal.Chem.,83,8703–8710.Jankevics,A.et al.(2012)Separating the wheat from the chaff:a prioritisation pipeline for the analysis of metabolomics datasets.Metabolomics[Epub ahead of print,doi:10.1007/s11306-011-0341-0,July30,2011].Kind,T.and Fiehn,O.(2010)Advances in structure elucidation of small molecules using mass spectrometry.Bioanal.Rev.,2,23–60.Madsen,R.et al.(2010)Chemometrics in metabolomics—a review in human disease diagnosis.Anal.Chim.Acta,659,23–33.Moco,S.et al.(2007)Metabolomics technologies and metabolite identification.Trends Analyt.Chem.,26,855–866.Neumann,S.and Böcker,S.(2010)Computational mass spectrometry for metabolomics: identification of metabolites and small molecules.Anal.Bioanal.Chem.,398,2779–2788.Pluskal,T.et al.(2010)MZmine2:modular framework for processing,visualizing,and analyzing mass spectrometry-based molecular profile data.BMC Bioinf.,11,395.R Development Core Team.(2008)R:a language and environment for statistical computing.In R Foundation for Statistical Computing.R Development Core Team,Vienna,Austria..Scheltema,R.et al.(2009)Simple data-reduction method for high-resolution LCMS data in metabolomics.Bioanalysis,1,1551–1557.Scheltema,R.A.et al.(2011)PeakML/mzMatch:a File Format,Java Library, R Library,and Tool-Chain for mass spectrometry data analysis.Anal.Chem.,83,2786–2793.Smith,C.et al.(2006)XCMS:processing mass spectrometry data for metabolite profiling using nonlinear peak alignment,matching,and identification.Anal.Chem.,78,779–787.1049at Wuhan University Library on April 6, 2012/Downloaded from。
Vol.23no.62007,pages783–784 BIOINFORMATICS APPLICATIONS NOTE doi:10.1093/bioinformatics/btl682 Databases and ontologiesAphidBase:a database for aphid genomic resourcesJean-Pierre Gauthier1,Fabrice Legeai2,Alain Zasadzinski3,Claude Rispe1andDenis Tagu1,Ã1INRA,Agrocampus Rennes,UMR1099BiO3P(Biology of Organisms and Populations applied to Plant Protection), F-35653LE RHEU,France,2INRA,URGI-Genoplante Info,Infobiogen,523place des Terrasses,F-91000Evry, France and3CNRS INIST,2,alle´e du Parc de Brabois54500Vandoeuvre-le`s-Nancy,FranceReceived and revised on October13,2006;accepted on January5,2007Advance Access publication January19,2007Associate Editor:Alvis BrazmaABSTRACTAphidBase aims to(i)store recently acquired genomic resources on aphids and(ii)compare them to other insect resources as functional annotation tools.For that,the Drosophila melanogaster genome has been loaded in the database using the GMOD open source software for a comparison with the17069pea aphid unique transcripts (contigs)and the13639gene transcripts of the Anopheles gambiae. Links to FlyBase and A.gambiae Entrez databases allow a rapid characterization of the putative functions of the aphid sequences. Text mining of the D.melanogaster literature was performed to construct a network of co-cited gene or protein names,which should facilitate functional annotation of aphid homolog sequences. AphidBase represents one of the first genomic databases for a hemipteran insect.Availability:http://w3.rennes.inra.fr/AphidBaseContact:denis.tagu@rennes.inra.fr,jean-pierre.gauthier@rennes.infra.fr1INTRODUCTIONSince the genome of Drosophila melanogaster,several other insect genomes have been or are currently being sequenced. These new genomic resources require the development of databases in order not only to store and analyse each insect genome separately,but also for interspecies comparisons. Aphids are plant-sucking insects attacking plants by feeding on fluids circulating in the plant phloem.These hemipterans diverged from other insects300million years ago(Grimaldi and Engels,2005)and are responsible for considerable damage worldwide to cultivated and ornamental plants.Genomic tools have been recently developed on aphids,mainly on the pea aphid Acyrthosiphon pisum.In the last3years,a large collection of ESTs(more than60000)have been developed,and the complete genome sequence is currently being released. AphidBase is a project of the International Aphid Genomic Consortium as a resource for users to analyse,compare, retrieve,and annotate aphid sequences,in comparison with D.melanogaster and Anopheles gambiae.2DATABASE STRUCTUREWe used the Generic Model Organism Database(GMOD; /home)open source project for adminis-trating of genomic databases.Among GMOD tools,Chado (database architecture on PostgreSQL;/ apollo-chado)and Gbrowse(a genomic data browser,Stein et al.,2002)were installed to set up and develop AphidBase. The complete D.melanogaster chromosome sequences(Flybase version r4.2.1;Drysdale et al.,2005),13639A.gambiae gene transcripts(MOZ2a)and17069 A.pisum putative unique transcribed sequences(or contigs;see Sabater-Mun oz et al., 2006)were retrieved.These17069 A.pisum contigs were assembled from53190ESTs,forming the so-called updated ‘v5’version of contigs(Sabater-Mun oz et al.,2006and unpublished data).In order to compare A.pisum and A.gambiae to D.melanogaster sequences,tblastx was performed between the A.pisum contigs or A.gambiae gene transcripts and the D.melanogaster genomic sequence.Matching A.pisum or A.gambiae sequences to fly sequences were displayed onto the D.melanogaster genome.For A.pisum,12280(72%)contigs had no match to D.melanogaster sequences(e value¼10À6)and 4789(28%)were homologous to D.melanogaster sequences. 5551(32%)A.pisum contigs were homologous to A.gambiae sequences,and2922(17%)matched to both D.melanogaster and A.gambiae sequences.This lack of homology reflects the divergence between hemipteran and dipteran,as already discussed in Sabater-Mun oz et al.(2006).3FUNCTIONAL ANNOTATION TOOLBOXIn order to facilitate functional annotation of the pea aphid sequences for which very little data is available on gene and protein functions,several descriptions are proposed for each of the4789 A.pisum contigs homologous to D.melanogaster and/or A.gambiae sequences.A direct link to the FlyBase report for each D.melanogaster gene was activated, in order to take advantage of the whole molecular and genetic description of fly genes homologous to aphid genes.In parallel, a similar direct link was performed for the A.gambiae gene transcripts annotated at the Ensembl Mosquito Transcript Report.Finally,a contig report for each of the A.pisum sequences was created,containing a list of*To whom correspondence should be addressed.ßThe Author2007.Published by Oxford University Press.All rights reserved.For Permissions,please email:journals.permissions@783several features.First,the sequence of each contig as well as EST composition and cDNA libraries of origin were indicated. Second,the translation in the six open reading frames were displayed,as well as the identification of the largest putative ORF after FrameD analysis(Schiex et al.,2003).Third,as each of the aphid transcripts had several matches to D.melanogaster genomic sequences,only the first hit was displayed on Gbrowse for search of clarity.Thus,the complete tblastx report was included on the contig report.A major fraction(2872)of the 4789pea aphid contigs homologous to D.melanogaster sequences had a single match(the one visualized by Gbrowse) but1827contigs still had between2and7different matches on the D.melanogaster genome(see‘‘Global Report’’).Fourth,the result of Uniprot annotation(e value¼10À5,Sabater-Mun oz et al.,2006)was displayed.Finally,a text mining analysis was set up,based on the large D.melanogaster literature.For this, the thesaurus of the D.melanogaster bibliography(about37000 bibliographical records from the Medline database)was constructed(i)by automatic extraction of gene names from the abstracts,(ii)by automated pattern recognition and natural language processing methods for names of genes and their products,and(iii)by compiling literature annotations available in various databases such as FlyBase,SwissProt or Entrez Gene.Co-citation clusters and networks were also constructed by automatic clustering approaches,and annotated by biolo-gical and functional information from Medline records (indexation keywords)and by available information for D.melanogaster genes and their products in databases and ontologies.Each of the4487pea aphid contigs homologous to a D.melanogaster gene was thus linked to literature records,clusters and networks by using the names of D.melanogaster homologous. This bibliographic network of co-occurrence of cited genes in the literature is a quick and efficient tool to infer biological functions in which a given pea aphid contig might be involved.4FUTUREAs soon as the sequence and assembly of the530Mb genome of A.pisum will be available,gameXML files of specific regions of interest would be easily extracted in order to be loaded into genome annotation parisons with(i)other aphid ESTs or cDNAs sequences(e.g.Hunter et al.,2003), (ii)D.melanogaster and A.gambiae genomes or(iii)other insect genomes under annotation(e.g.the honey bee)will help human expert decisions.AphidBase will also be implemented with new functional annotation modules,mainly for transcript and proteic profilings.AphidBase will thus represent the necessary infrastructure for curation,archiving and functional annotation of an aphid genome,one of the first hemipteran sequenced genome.ACKNOWLEDGEMENTSS.Cain(Gmod),O.Chenede(INRA Rennes),J.P.Gaultier (INRA Jouy en Josas), C.Pommier(INRA,URGI), J.C.Simon,C.Soster(INRA Rennes)and L.Stein(CSHL, USA)are acknowledged for their technical support,advice and discussions.Financial support was received from Rennes Metropole and ANR Exdisum.Conflict of Interest:none declared.REFERENCESDrysdale,R.et al.(2005)FlyBase:genes and gene models.Nucleic Acids Res.,33, D390–D395.Grimaldi,D.and Engels,M.S.(2005)Evolution of the Insects.Cambridge University Press,New York.Hunter,W.B.et al.(2003)Aphid biology:expressed genes from the alate Toxoptera citricida,the brown citrus aphid.J.Ins.Sci.,3,23.Sabater-Mun oz,B.et al.(2006)Large-scale gene discovery in the pea aphid Acyrthosiphon pisum(Hemiptera).Genome Biol.,7,R21.Schiex,T.et al.(2003)FrameD:a flexible program for quality check and gene prediction in prokaryotic genomes and noisy matured eukaryotic sequences.Nucleic Acids Res.,31,3738–3741.Stein,L.D.et al.(2002)The generic genome browser:a building block for a model organism system database.Genome Res.,12, 1599–1610.J.-P.Gauthier et al. 784。